

Abstract
There is increasing attention in the literature towards understanding the behaviour of lipid-based drug formulations under digestion conditions using in vitro and in vivo methods. This necessitates a convenient method for quantitation of lipids and lipid digestion products. In this study, a simple and accessible method for the separation and quantitative determination of typical formulation and digested lipids using high performance liquid chromatography coupled to refractive index detection (HPLC–RI) is described. Long and medium chain lipids were separated and quantified in a biological matrix (gastrointestinal content) without derivatisation using HPLC–RI on C18 and C8 columns, respectively. The intra- and inter-assay accuracy was between 92% and 106%, and the assays were precise to within a coefficient of variation of less than 10% over the range of 0.1–2 mg/mL for both long and medium chain lipids. This method is also shown to be suitable for quantifying the lipolysis products collected from the gastrointestinal tract in the course of in vivo lipid digestion studies.
Electronic supplementary material
The online version of this article (doi:10.1208/s12249-013-9976-7) contains supplementary material, which is available to authorized users.
KEY WORDS: lipid-based formulations, lipolysis, triacylglycerides
INTRODUCTION
Interest in lipid-based formulations as a strategy to enhance oral bioavailability of poorly water-soluble drugs has increased recently (1–3). Lipid-based formulations commonly contain long or medium chain lipids either individually, or as a mixture, often in combination with surfactants and/or co-solvents. Excipients are initially selected for optimal solvency and their ability to maintain drug in a solubilised state during dispersion of the formulation in bio-relevant media. However, the impact of lipid digestion on drug solubilisation and consequently absorption, and oral bioavailability is increasingly being appreciated as an important factor in the development of lipid-based formulations (4–10).
On oral administration, lipids such as triacylglycerides (TAG) are lipolysed initially by lingual and gastric lipase, then quantitatively by pancreatic lipase/co-lipase complex in a two-step reaction (11). Lipolysis of TAG generates a fatty acid and diacylglyceride (DAG); DAG is further digested to produce another fatty acid and monoacylglyceride (Fig. 1). Mixed micelles formed by interaction of endogenous bile salts with lipid digestion products significantly increase the drug solubilisation capacity of the gastrointestinal fluids, thereby enhancing the absorption and bioavailability of poorly water-soluble drugs (12,13).
Fig. 1.
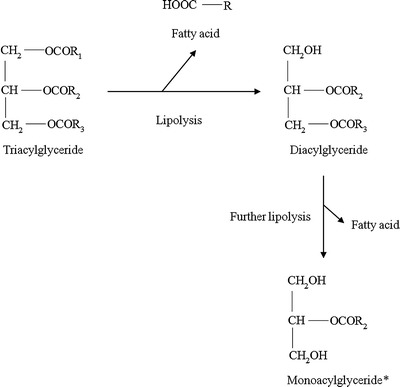
Representative chemical structures of glycerides formed during lipid digestion. R represents fatty acids and chain length can vary from C7 to C17. *A small amount of monoacylglyceride may racemise to 1(3)-monoacylglyceride in solution due to the migration of the esterified fatty acid
Many studies both in vitro and in vivo have investigated the process of lipid digestion (14–17); however, the separation and quantification of lipid digestion products remain a complex and specialised process. Advances in the development of analytical techniques have produced numerous methods for the detection and quantification of lipids. Lipid analysis is complicated by the lack of a strongly ultraviolet (UV) absorbing chromophore or fluorophore in most simple lipids, which limits the utility of chromatographic techniques such as HPLC with UV or fluorescence detectors. Evaporative light-scattering detection (ELSD) has been reported but, like mass spectrometry, it has a number of disadvantages as a detection method, including the laborious optimisation of a number of operating parameters, destruction of the sample and variable detector response necessitating the use of an internal standard. Other chromatographic methods such as gel permeation and gas chromatography often suffer from excessively long run times (up to 50 min) (18,19).
Other non-HPLC methods such as in vitro assay kits based on enzymatic and colorimetric detection are also commonly used to identify lipids. Although relatively simple and easy to use they are unsuitable for samples in matrices other than the standard biological matrices (plasma, serum or other body fluids) for which they are designed. In addition, most kits quantitate only total fatty acids or total glycerides, and are not capable of separating and quantitating the different lipid species present in a mixture.
Hence there is a need for an effective and efficient analytical method with simple sample preparation that has the capacity to quantify lipid components during digestion. The purpose of this study was therefore to develop a simple and precise HPLC method to separate and quantitate the long and medium chain lipids typically encountered in in vitro and in vivo investigations of lipid-based formulations. The assays developed utilised common reversed-phase HPLC columns and quantification was achieved using a refractive index (RI) detector. To demonstrate the applicability of the methods to quantitate lipids in bio-relevant biological matrices, the concentration of different lipid constituents was determined in lipid samples obtained from the gastrointestinal tract (GIT) of rats administered a simple TAG.
MATERIALS AND METHODS
Materials
Oleic acid was obtained from Honeywell Riedel-de haën® (Seelze, Germany). Dicaprylin (1,2-dioctanoyl-sn-glycerol) was purchased from Avanti Polar Lipids, Inc. (Alabaster, Alabama, USA). Triolein (glyceryl trioleate, Sigma grade, ≥99%), diolein (1,2-dioleoyl-rac-glycerol, approximately 99%), monoolein (1-oleoyl-rac-glycerol, approximately 99%), tricaprylin (glyceryl trioctanoate, minimum 99%), dicaprylin (1,2-dioctanoyl-sn-glycerol, approximately 97% TLC), monocaprylin (1-octanoyl-rac-glycerol, approximately 99%) and octanoic acid (minimum 99%) were all obtained from Sigma-Aldrich (St. Louis, Missouri, USA). All lipids were used as obtained without further processing or purification. Acetonitrile (ACN), methanol (MeOH) and tetrahydrofuran (THF) were all from Merck and were of HPLC grade. Trifluoroacetic acid (TFA) was purchased from Pierce (Rockford, Illinois, USA) and water was obtained from a Millipore Milli-Q filtration/purification system (Billerica, Massachusetts, USA).
Methods
Separation and Quantification of Long and Medium Chain Lipids
The long and medium chain lipids employed here are representative of common formulation lipids. They span a wide range of lipophilicity from the long chain TAG to the medium chain fatty acid, prohibiting a single method to separate all components within a reasonable run time. After initial optimisation studies, it was necessary to separate the lipids into four groups comprising (A) long chain fatty acid and monoacylglyceride, (B) long chain DAG and TAG, (C) medium chain fatty acid and monoacylglyceride, and (D) medium chain DAG and TAG. Slightly differing assays were then used to analyse samples and standards for each group as described in the following section.
Reversed-Phase HPLC Assays
Groups A and B (Long Chain Lipids)
Samples containing long chain lipids were separated by an isocratic HPLC method using a 4.6 × 75 mm Waters Symmetry® C18 (3.5 μm) analytical column (Waters corp., Milford, Massachusetts, USA) and 15 × 3 mm Brownlee RP-18 (7 μm) guard column (Alltech Associates Inc., Deerfield, Illinois, USA). The HPLC system consisted of a Shimadzu CBM-20A system controller, LC-20AD solvent delivery module, SIL-20A auto sampler and a CTO-20A column oven, coupled to a RID-10A differential refractometric detector (Shimadzu Corp., Kyoto, Japan). Oleic acid and monoolein (group A) were separated using a mobile phase consisted of ACN/water (90:10 v/v) with 0.1% TFA (v/v of total mobile phase). Diolein and triolein (group B) were separated using ACN/MeOH/THF (40:40:20 v/v/v). The injection volume was 40 μL and samples were eluted at a flow rate of 1 mL/min with the column temperature set at 40°C. Details of all other HPLC parameters are shown in Table I.
Table I.
HPLC Assay Parameters Used for Long and Medium Chain Lipid Analysis
| Compounds | Column | Mobile phase | Retention times (min) | Run time (min) | Calibration range (mg/mL) | LOQ (mg/mL) |
|---|---|---|---|---|---|---|
| Oleic acid (OA) | 4.6 × 75 mm Waters Symmetry® C18 (3.5 μm) | 90:10 ACN/water | 4.6 | 8.0 | 0.10–2.0 | 0.10 |
| Monoolein (MO) | (0.1% TFA) | 3.7 | ||||
| Diolein (DO) | 40:40:20 | 2.6 | 12.0 | |||
| Triolein (TO) | ACN/MeOH/THF | 8.2 | ||||
| Caprylic acid (CA) | 4.6 × 150 mm Phenomenex Luna C8 (2) (5 μm, 100 Å) | 60:40 MeOH/water | 10.5 | 14.0 | 0.10–2.0 | 0.10 |
| Monocaprylin (MC) | (0.1% TFA) | 7.5 | ||||
| Dicaprylin (DC) | 45:45:10 | 3.8 | 14.0 | |||
| Tricaprylin (TC) | ACN/MeOH/water | 9.3 |
LOQ limit of quantification
Groups C and D (Medium Chain Lipids)
Samples containing medium chain lipids were determined by an isocratic HPLC method using a 4.6 × 150 mm Phenomenex Luna C8 (2) (5 μm, 100 Å) analytical column and 15 × 3 mm Brownlee RP-18 (7 μm) guard column. The same Shimadzu HPLC system described above was used. Octanoic acid and monocaprylin (group C) were separated using a mobile phase consisting of MeOH/water (60:40 v/v) with 0.1% TFA (v/v of total mobile phase). Dicaprylin and tricaprylin (group D) were separated using ACN/MeOH/water (45:45:10 v/v/v). Injection volume, flow rate and column temperature were as for long chain lipids.
Preparation of Standards
Calibration standards for each of the four groups (A–D) described above were prepared as follows. Stock solutions of each lipid were prepared at a concentration of 5 or 10 mg/mL in the corresponding mobile phase listed in Table I. Mixed standards containing both lipids for each group (i.e. A and B or C and D) were prepared by mixing and dilution of the individual stock solutions in the corresponding mobile phase to provide a set of standards containing 0.1, 0.2, 0.5, 1.0, 1.5 and 2.0 mg/mL of both lipids in each mixed standard. All stock solutions and standards were stored at 4°C before analysis. Standard curves were prepared by plotting peak area against a known concentration of standard solutions.
Preparation of Samples
All gastrointestinal tissue samples used in this study were obtained from animals post mortem. Stomach contents were collected into 10-mL polyethylene tubes containing 5 mL of chloroform/methanol (2:1 v/v). Liquid contents were removed by syringe, and the internal lining of the stomach was scraped clean using a metal spatula. The polyethylene tube containing stomach contents and scrapings was then vortexed to promote dissolution. The process was repeated to collect the contents of the upper small intestines [duodenum and jejunum (20)]. The tubes were vortexed to ensure complete dissolution of the lipids and centrifuged for 15 min at 3,500×g at 20°C to separate any solids, hair or tissue that was also obtained during the scraping process. The supernatant was subsequently collected into a new tube and stored at −20°C until analysis.
An appropriate volume of chloroform/methanol extract (between 0.1 and 1.0 mL) was transferred to a 2-mL glass vial and evaporated to dryness. Mobile phase (1 mL) was added to redissolve the lipids and subsequently yielding a dilution of up to 100-fold (v/v) to ensure lipid quantities were within the concentration range of the assay. The glass vials were mixed by vortex and centrifuged again to separate any remaining solids. The supernatant was subsequently collected for injection into HPLC for analysis. Gastrointestinal samples generally contain a mixture of glycerides ranging from fatty acids to TAG. Samples can be split into aliquots prior to dilution in the relevant mobile phase to enable analysis of all partial glycerides as well as TAG and fatty acid.
Unknown sample concentrations were calculated from the standard equation  , as determined by the linear regression of the standard curve. Linearity was confirmed by calculating the correlation statistics of the regression line.
Assay Validation
Validation was run on three consecutive days. Intra-assay accuracy was determined by replicate analysis (n = 5) of standard solutions of each pair of lipids at three concentrations (0.1, 1.0 and 2.0 mg/mL). The data were expressed as the percentage ratio of the measured concentration over the expected concentration. Inter-assay accuracy was similarly determined on three separate days. The mean and standard deviation were calculated with the requirement for mean accuracy within ±15% of the theoretical concentration for both intra-and inter-assay validation. Intra-assay precision (repeatability) and inter-assay precision (reproducibility) were calculated in all three runs for each lipid at all three concentrations and were expressed as the coefficient of variation (CV %) of replicate assays. The requirement for the CV % for repeatability and reproducibility were both ≤10% at all concentrations. A test for linearity was performed on all standard curves for each run by calculating the regression line obtained from the standards. Linearity was fulfilled when the correlation coefficient (r2) was >0.99.
To confirm the robustness of recovery of the various lipids during the sample preparation process (evaporation and reconstitution), blank samples of stomach and intestinal scrapings dissolved in 5 or 10 mL of sampling solvent (chloroform/methanol 2:1 v/v) were spiked with known concentrations of triolein or tricaprylin. Aliquots of spiked samples were removed and processed as described above for the experimental samples. The samples in mobile phase were analysed to test the robustness of the preparation steps. Recovery was determined by the percentage ratio of measured concentration divided by the spiked concentration.
In Vivo Lipid Digestion Studies
To generate bio-relevant digestion samples, commercial sources of triolein (long chain TAG) and tricaprylin (medium chain TAG) were administered to rats, and gastrointestinal samples were obtained as described below. All animal procedures were conducted under approval from the Victorian College of Pharmacy Animal Ethics Committee. Rats (280–320 g Sprague–Dawley) were fasted for at least 15 h overnight, and given free access to water, to allow gastrointestinal emptying of any previously ingested material prior to dosing. After brief anaesthesia via isoflurane inhalation (5% v/v), 500 mg of lipid was administered orally via gavage to 28 rats. At specific experimental time points, four animals were sacrificed and the stomach and upper intestinal sections removed for sample analysis. This process was repeated at times 5, 30, 60, 90, 120, 150 and 180 min post-dose. A separate cohort of animals was not administered lipids but treated in an identical manner to serve as controls and to generate blank samples for method validation purposes.
RESULTS
Assay Validation
The chromatograms obtained for each group of lipids using HPLC–RI analysis are shown in Fig. 2. Each labelled peak was clearly separated, and all peaks were eluted within the run time.
Fig. 2.

Representative chromatograms for the separation of standards for long (groups a and b) and medium chain lipids (groups c and d) in mobile phase on HPLC–RI (1 mg/mL)
Linearity, Precision and Accuracy
The calibration plots for all lipids in all four assays were linear (r2 > 0.9989) (Fig. 3, Table II). The intra-assay coefficients of variation (expressed as CV %) determined for repeatability and reproducibility ranged from 0.3% to 8.3%, and the accuracy from 94.1% to 105.7% for all lipids and for the low, medium and high lipid concentration samples. The inter-assay variability for all eight lipids, obtained on three different days, was less than 10% (0.1–8.8%) and the accuracy was between 94.1% and 105.7% (Table II). The recovery of triolein and tricaprylin spiked into blank gastrointestinal samples within 25% and 16%, respectively, of the nominal 500 mg spiked dose. It is important to note that these methods were able to be validated without the requirement for an internal standard (21). In contrast to the simple detection process for RI, detection by ELSD or MS is likely to require an internal standard to account for variability in detector response (22–24).
Fig. 3.

Representative calibration curves for medium (groups a and b) and long chain lipids (groups c and d) prepared in their respective mobile phases. Solid line obtained by linear regression of the data (n = 6)
Table II.
Intra- and Inter-assay Accuracy (%) and Precision (CV %) for the Assay Procedures for Quantification of Long and Medium Chain Lipids
| Lipid | Concentration (mg/mL) | Intra-assay (n = 5) | Inter-assay (n = 3) | ||
|---|---|---|---|---|---|
| Accuracy (%) | Precision (CV %) | Accuracy (%) | Precision (CV %) | ||
| OA | 0.1 | 102.7 | 5.4 | 99.5 | 0.6 |
| 1.0 | 100.1 | 0.6 | 99.4 | 0.8 | |
| 2.0 | 99.7 | 0.5 | 99.1 | 0.5 | |
| MO | 0.1 | 99.4 | 3.5 | 102.7 | 0.7 |
| 1.0 | 99.4 | 0.5 | 100.1 | 0.1 | |
| 2.0 | 99.1 | 0.5 | 99.7 | 0.3 | |
| DO | 0.1 | 94.9 | 8.3 | 94.8 | 8.8 |
| 1.0 | 100.7 | 0.9 | 100.7 | 0.8 | |
| 2.0 | 100.1 | 1.3 | 100.1 | 0.6 | |
| TO | 0.1 | 95.4 | 8.3 | 95.4 | 1.7 |
| 1.0 | 101.6 | 1.2 | 101.6 | 0.3 | |
| 2.0 | 99.8 | 1.5 | 99.8 | 0.3 | |
| CA | 0.1 | 98.2 | 0.7 | 98.2 | 0.5 |
| 1.0 | 99.9 | 0.3 | 99.9 | 0.2 | |
| 2.0 | 99.7 | 0.4 | 99.7 | 0.4 | |
| MC | 0.1 | 94.1 | 2.8 | 94.1 | 1.9 |
| 1.0 | 100.6 | 0.4 | 100.6 | 0.4 | |
| 2.0 | 99.4 | 0.4 | 99.4 | 0.3 | |
| DC | 0.1 | 103.6 | 7.4 | 103.6 | 8.5 |
| 1.0 | 97.4 | 1.2 | 97.4 | 0.2 | |
| 2.0 | 98.2 | 1.6 | 98.2 | 0.6 | |
| TC | 0.1 | 105.7 | 2.6 | 105.7 | 0.5 |
| 1.0 | 100.5 | 0.7 | 100.5 | 0.2 | |
| 2.0 | 99.4 | 1.0 | 99.4 | 0.4 | |
Quantitation of Long and Medium Chain Lipids During In Vivo Digestion
Long Chain Lipids
The recovery of triolein (TO) and diolein (DO) from the upper GIT after oral administration of TO in rats are illustrated in Fig. 4. A representative chromatogram of the separation of DO and TO is shown in Fig. 5. Close to quantitative recovery of TO was shown at 5 min with the total TO recovered within 13% of the nominal 500 mg (0.565 mmol) administered (panel A). This was an indication that the sample collection procedure and analytical method were both sound and reproducible. A gradual decline of TO was observed in the stomach over time, indicative of gastric emptying. The appearance of TO in the upper small intestines is indicative of TO that has been released from the stomach, but is yet to be digested to form di- and monoacylglycerides and fatty acids. A steady rise in the amount of TO recovered in the upper small intestines was observed, which peaked at 120 min (open triangles in Fig. 4).
Fig. 4.
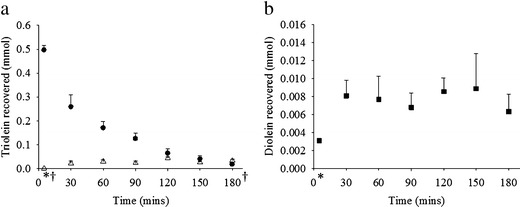
a Recovery of TO in the stomach (filled circles) and upper small intestines (open triangles) after 500 mg dose of TO in rats. b Recovery of DO in the upper small intestines (filled squares) after 500 mg dose of TO in rats (n = 4 ± SEM, *intestine n = 3, †stomach n = 3)
Fig. 5.

Representative chromatogram of the separation of long chain lipids DO and TO from a typical upper small intestine sample using HPLC–RI
The amount of DO present in the upper small intestines over time after administration of TO is shown in panel (b). The amount of DO was low but consistent and was below 13 mg (3.6% of the dose on a molar basis) over the course of the study. The DO generated was a result of TO lipolysis, but was essentially an intermediate since DO was expected to be digested further to monoolein (MO). No MO was recovered during the course of the study and low or amounts below the lower limit of quantification (LOQ) were analysed for oleic acid (OA).
The low and consistent amounts of DO recovered indicated that lipid digestion was occurring and ongoing during the sampling period. However, no MO was recovered and only small amounts of OA (<5.9% of the dose on a molar basis) were present in the upper small intestine. The absence of MO and low quantity of OA recovered were attributed to rapid absorption. The detailed digestion and absorption behaviour of these lipids, and the implications for drug delivery will be specifically addressed in forthcoming manuscripts using the methods described here.
Medium Chain Lipids
The recovery of tricaprylin (TC) and dicaprylin (DC) from the upper GIT after oral administration of TC in rats are illustrated in Fig. 6. A representative chromatogram of the separation of DC and TC is shown in Fig. 7. There was close to quantitative recovery of TC immediately after oral administration in rats. The average recovery for TC was within 15% of the nominal 500 mg (1.06 mmol) dose at 5 min (Fig. 6). Similar to the results obtained for long chain lipids, a decline was observed in the amount of TC in the stomach over time. This again illustrated gastric emptying over time. The appearance of TC in the upper small intestines remained low overall.
Fig. 6.

Recovery of tricaprylin (TC) in the stomach (filled diamonds) and upper small intestines (open hexagons) after 500 mg dose of TC in rats (n = 4 ± SEM)
Fig. 7.

Representative chromatogram of the separation of medium chain lipids DC and TC from a typical stomach sample using HPLC–RI
The recovery of DC (<3.7% of the dose on a molar basis) from the upper GIT was lower and more variable compared to DO. Approximately half of the data obtained were below the LOQ, with the majority of DC recovered in both the stomach and upper small intestines at the individual time points was less than 5 mg (1.4 mol% of dose). Similar to the long chain lipids, no monocaprylin (MC) was recovered in the upper GIT at any of the time points studied, and in the case of caprylic acid (CA), concentrations were below the LOQ for more than half of the samples. This was again attributed to rapid absorption of the monoacylglyceride and fatty acid. The maximum amount of CA detected, 5.9 mg (3.9 mol% of dose) was recovered from the upper small intestines. Together this suggests that TC is rapidly digested to form DC, MC and CA and that MC and CA are readily absorbed in the intestine.
DISCUSSION
In this study, we set out to establish an approach for analysis of lipid digestion products in the GIT that was simple, reliable and could be run in laboratories without higher end instruments such as LC–MS. The validated assays are very simple and could be employed in most laboratories with HPLC capabilities.
There are a number of approaches already reported in the literature for separating lipid digestion products. Analysis by means of gel permeation chromatography coupled to a RI detector has been successful in determining and separating mono-, di- and triacylglyceride mixtures, but typically requires very long run times (18). High performance thin layer chromatography (HPTLC) coupled with in situ spectrodensitometric analysis has also been reported (25), but is slow, labour intensive and requires specialised TLC equipment. Evaporative light-scattering detection (ELSD) for HPLC has been shown to be suitable for the separation of complex TAG mixtures and quantitative determination of mono-, di- and triacylglycerides (26,27). However, ELSD requires the use of very volatile solvents which may not be appropriate due to the potential volatility of low molecular weight lipids (28–30). Likewise, gas chromatography (GC) has been used to separate diacylglycerol and triacylglycerol molecular species (19). However, run times of up to several hours are required (31), as are high temperatures, up to 300°C (32).
HPLC with mass spectrometry detection (LC–MS) has some advantages, particularly in terms of selectivity and providing valuable information on structure. However, LC–MS has not found extensive application in lipid analysis, mainly as a consequence of high equipment costs and limited availability and also as a result of variability in molecular ion fragmentation patterns (33,34). Furthermore, carboxyl-containing analytes require derivatisation to increase their ionisation efficiency in HPLC–MS analyses (24).
Therefore, in terms of ease and simplicity, HPLC with RI detection was established for use in quantifying lipids in formulation and biological samples as a simple, non-destructive method. The combination of simple isocratic assay development, easy and straight forward use and high precision and accuracy make this the ideal method for formulation and gastrointestinal samples.
Using the approach described, the recovery of TAG from the stomach was similar for both long and medium chain lipids, showing a steady decline over time, representative of gastric emptying. In the upper small intestine, slightly more long chain than medium chain lipids were recovered. This is likely due to digestion being faster for medium chain lipids (7,35), and hence the decreased amount of TC recovered from the upper small intestines. A delay was seen in the increase in the amount of DO in the upper small intestines, which may again indicate that the digestion and absorption of long chain lipids was slower compared to the medium chain lipids, hence more consistent recovery and quantitation of transient OA and DO was achieved. Rapid absorption of digestion products (monoglycerides and fatty acids) likely led to limited quantities being present in the in vivo gastrointestinal samples; however, in ‘closed’ in vitro models, where millimolar quantities of these analytes are expected, the method would be particularly useful for correlation to titration profiles (2,7,14).
CONCLUSION
Long and medium chain fatty acids, mono-, di- and triacylglycerides were separated using different solvent components and columns within a run time of 14 min. The set of validated methods were simple and required only basic sample preparation processes and no derivatisation. Importantly, since sample preparation involved a simple evaporation and dilution procedure and an extraction or derivatisation step was not employed, an internal standard was unnecessary. This method was shown in principle to be useful and reliable in the assessment of lipid digestion in vivo.
Electronic supplementary material
Below is the link to the electronic supplementary material.
(DOCX 14 kb)
REFERENCES
- 1.Humberstone AJ, Charman WN. Lipid-based vehicles for the oral delivery of poorly water soluble drugs. Adv Drug Deliv Rev. 1997;25:103–128. doi: 10.1016/S0169-409X(96)00494-2. [DOI] [Google Scholar]
- 2.Porter CJH, Trevaskis NL, Charman WN. Lipids and lipid-based formulations: optimizing the oral delivery of lipophilic drugs. Nat Rev Drug Discov. 2007;6:231–248. doi: 10.1038/nrd2197. [DOI] [PubMed] [Google Scholar]
- 3.MacGregor KJ, Embleton JK, Lacy JE, Perry EA, Solomon LJ, Seager H, et al. Influence of lipolysis on drug absorption from the gastro-intestinal tract. Adv Drug Deliv Rev. 1997;25:33–46. doi: 10.1016/S0169-409X(96)00489-9. [DOI] [Google Scholar]
- 4.Stuchlik M, Žák S. Lipid-based vehicle for oral drug delivery. Biomed Pap. 2001;145:17–26. doi: 10.5507/bp.2001.008. [DOI] [PubMed] [Google Scholar]
- 5.Porter CJH, Charman WN. Lipid-based formulations for oral administration: opportunities for bioavailability enhancement and lipoprotein targeting of lipophilic drugs. J Recept Signal Transduct Res. 2001;21:215–257. doi: 10.1081/RRS-100107429. [DOI] [PubMed] [Google Scholar]
- 6.Hauss DJ. Oral lipid-based formulations. Adv Drug Deliv Rev. 2007;59:667–676. doi: 10.1016/j.addr.2007.05.006. [DOI] [PubMed] [Google Scholar]
- 7.Kaukonen AM, Boyd BJ, Porter CJH, Charman WN. Drug solubilization behavior during in vitro digestion of simple triglyceride lipid solution formulations. Pharm Res. 2004;21:245–253. doi: 10.1023/B:PHAM.0000016282.77887.1f. [DOI] [PubMed] [Google Scholar]
- 8.Kaukonen AM, Boyd BJ, Charman WN, Porter CJH. Drug solubilization behavior during in vitro digestion of suspension formulations of poorly water-soluble drugs in triglyceride lipids. Pharm Res. 2004;21:254–260. doi: 10.1023/B:PHAM.0000016283.87709.a9. [DOI] [PubMed] [Google Scholar]
- 9.Porter CJH, Charman WN. In vitro assessment of oral lipid based formulations. Adv Drug Deliv Rev. 2001;50:S127–S147. doi: 10.1016/S0169-409X(01)00182-X. [DOI] [PubMed] [Google Scholar]
- 10.Porter CJH, Kaukonen AM, Taillardat-Bertschinger A, Boyd BJ, O’Connor JM, Edwards GA, et al. Use of in vitro lipid digestion data to explain the in vivo performance of triglyceride-based oral lipid formulations of poorly water-soluble drugs: studies with halofantrine. J Pharm Sci. 2004;93:1110–1121. doi: 10.1002/jps.20039. [DOI] [PubMed] [Google Scholar]
- 11.Mattson FH, Volpenhein RA. The digestion and absorption of triglycerides. J Biol Chem. 1964;239:2772–2777. [PubMed] [Google Scholar]
- 12.Kossena GA, Charman WN, Boyd BJ, Dunstan DE, Porter CJH. Probing drug solubilisation patterns in the gastrointestinal tract after administration of lipid-based delivery systems: a phase diagram approach. J Pharm Sci. 2004;93:332–348. doi: 10.1002/jps.10554. [DOI] [PubMed] [Google Scholar]
- 13.Kossena GA, Charman WN, Boyd BJ, Porter CJH. Influence of the intermediate digestion phases of common formulation lipids on the absorption of a poorly water-soluble drug. J Pharm Sci. 2005;94:481–492. doi: 10.1002/jps.20260. [DOI] [PubMed] [Google Scholar]
- 14.Dahan A, Hoffman A. Use of a dynamic in vitro lipolysis model to rationalize oral formulation development for poor water soluble drugs: correlation with in vivo data and the relationship to intra-enterocyte processes in rats. Pharm Res. 2006;23:2165–2174. doi: 10.1007/s11095-006-9054-x. [DOI] [PubMed] [Google Scholar]
- 15.Christensen JO, Schultz K, Mollgaard B, Kristensen HG, Mullertz A. Solubilisation of poorly water-soluble drugs during in vitro lipolysis of medium- and long-chain triacylglycerols. Eur J Pharm Sci. 2004;23:287–296. doi: 10.1016/j.ejps.2004.08.003. [DOI] [PubMed] [Google Scholar]
- 16.Carrière F, Renou C, Ransac S, Lopez V, De Caro J, Ferrato F, et al. Inhibition of gastrointestinal lipolysis by Orlistat during digestion of test meals in healthy volunteers. Am J Physiol Gastrointest Liver Physiol. 2001;281:G16–G28. doi: 10.1152/ajpgi.2001.281.1.G16. [DOI] [PubMed] [Google Scholar]
- 17.Hernell O, Staggers JE, Carey MC. Physical–chemical behavior of dietary and biliary lipids during intestinal digestion and absorption. 2. Phase analysis and aggregation states of luminal lipids during duodenal fat digestion in healthy adult human beings. Biochemistry. 1990;29:2041–2056. doi: 10.1021/bi00460a012. [DOI] [PubMed] [Google Scholar]
- 18.Schoenfelder W. Determination of monoglycerides, diglycerides, triglycerides and glycerol in fats by means of gel permeation chromatography [C-VI 5b(02)] Eur J Lipid Sci Technol. 2003;105:45–48. doi: 10.1002/ejlt.200390006. [DOI] [Google Scholar]
- 19.Mu H, Kalo P, Xu X, Høy C-E. Chromatographic methods in the monitoring of lipase-catalyzed interesterification. Eur J Lipid Sci Technol. 2000;102:202–211. doi: 10.1002/(SICI)1438-9312(200003)102:3<202::AID-EJLT202>3.0.CO;2-6. [DOI] [Google Scholar]
- 20.Walling MW, Favus MJ, Kimberg DV. Effects of 25-hydroxyvitamin D3 on rat duodenum, jejunum, and ileum. J Biol Chem. 1974;249:1156–1161. [PubMed] [Google Scholar]
- 21.Shah VP, Midha KK, Dighe S, McGilveray IJ, Skelly JP, Yacobi A, et al. Analytical methods validation: bioavailability, bioequivalence and pharmacokinetic studies. Int J Pharm. 1992;82:1–7. doi: 10.1016/0378-5173(92)90065-A. [DOI] [PubMed] [Google Scholar]
- 22.Lutzke BS, Braughler JM. An improved method for the identification and quantitation of biological lipids by HPLC using light-scattering detection. J Lipid Res. 1990;31:2127–2130. [PubMed] [Google Scholar]
- 23.Fomuso LB, Akoh CC. Structured lipids: lipase-catalyzed interesterification of tricaproin and trilinolein. J Am Oil Chem Soc. 1998;75:405–410. doi: 10.1007/s11746-998-0059-y. [DOI] [Google Scholar]
- 24.Yang W-C, Adamec J, Regnier FE. Enhancement of the LC/MS analysis of fatty acids through derivatization and stable isotope coding. Anal Chem. 2007;79:5150–5157. doi: 10.1021/ac070311t. [DOI] [PubMed] [Google Scholar]
- 25.Sek L, Porter CJH, Charman WN. Characterisation and quantification of medium chain and long chain triglycerides and their in vitro digestion products, by HPTLC coupled with in situ densitometric analysis. J Pharm Biomed Anal. 2001;25:651–661. doi: 10.1016/S0731-7085(00)00528-8. [DOI] [PubMed] [Google Scholar]
- 26.Liu J, Lee T, Bobik E, Guzman-Harty M, Hastilow C. Quantitative determination of monoglycerides and diglycerides by high-performance liquid chromatography and evaporative light-scattering detection. J Am Oil Chem Soc. 1993;70:343–347. doi: 10.1007/BF02552704. [DOI] [Google Scholar]
- 27.Palmer AJ, Palmer FJ. Rapid analysis of triacylglycerols using high-performance liquid chromatography with light scattering detection. J Chromatogr. 1989;465:369–377. doi: 10.1016/S0021-9673(01)92674-3. [DOI] [PubMed] [Google Scholar]
- 28.Lee K-T, Jones KC, Foglia TA. Separation of structured lipids by high performance liquid chromatography. Chromatographia. 2002;55:197–201. doi: 10.1007/BF02492142. [DOI] [Google Scholar]
- 29.Foglia TA, Jones KC. Quantitation of neutral lipid mixtures using high performance liquid chromatography with light scattering detection. J Liq Chromatogr Relat Technol. 1997;20:1829–1838. doi: 10.1080/10826079708005545. [DOI] [Google Scholar]
- 30.Tarvainen M, Suomela J-P, Kuksis A, Kallio H. Liquid chromatography–light scattering detector–mass spectrometric analysis of digested oxidized rapeseed oil. Lipids. 2010;45:1061–1079. doi: 10.1007/s11745-010-3474-4. [DOI] [PubMed] [Google Scholar]
- 31.Slover HT, Lanza E. Quantitative analysis of food fatty acids by capillary gas chromatography. J Am Oil Chem Soc. 1979;56:933–943. doi: 10.1007/BF02674138. [DOI] [Google Scholar]
- 32.Černoch M, Hájek M, Skopal F. Ethanolysis of rapeseed oil—distribution of ethyl esters, glycerides and glycerol between ester and glycerol phases. Bioresour Technol. 2010;101:2071–2075. doi: 10.1016/j.biortech.2009.11.035. [DOI] [PubMed] [Google Scholar]
- 33.Tarvainen M, Suomela J-P, Kallio H. Ultra high performance liquid chromatography–mass spectrometric analysis of oxidized free fatty acids and acylglycerols. Eur J Lipid Sci Technol. 2011;113:409–422. doi: 10.1002/ejlt.201000454. [DOI] [Google Scholar]
- 34.Ruiz-Gutiérrez V, Barron LJR. Methods for the analysis of triacylglycerols. J Chromatogr B. 1995;671:133–168. doi: 10.1016/0378-4347(95)00093-X. [DOI] [PubMed] [Google Scholar]
- 35.Jandacek RJ, Whiteside JA, Holcombe BN, Volpenhein RA, Taulbee JD. The rapid hydrolysis and efficient absorption of triglycerides with octanoic acid in the 1 and 3 positions and long-chain fatty acid in the 2 position. Am J Clin Nutr. 1987;45:940–945. doi: 10.1093/ajcn/45.5.940. [DOI] [PubMed] [Google Scholar]
Associated Data
This section collects any data citations, data availability statements, or supplementary materials included in this article.
Supplementary Materials
(DOCX 14 kb)