

Abstract
Continuous pharmaceutical manufacturing processes are of increased industrial interest and require uni- and multivariate Process Analytical Technology (PAT) data from different unit operations to be aligned and explored within the Quality by Design (QbD) context. Real-time pharmaceutical process verification is accomplished by monitoring univariate (temperature, pressure, etc.) and multivariate (spectra, images, etc.) process parameters and quality attributes, to provide an accurate state estimation of the process, required for advanced control strategies. This paper describes the development and use of such tools for a continuous hot melt extrusion (HME) process, monitored with generic sensors and a near-infrared (NIR) spectrometer in real-time, using SIPAT (Siemens platform to collect, display, and extract process information) and additional components developed as needed. The IT architecture of such a monitoring procedure based on uni- and multivariate sensor systems and their integration in SIPAT is shown. SIPAT aligned spectra from the extrudate (in the die section) with univariate measurements (screw speed, barrel temperatures, material pressure, etc.). A multivariate supervisory quality control strategy was developed for the process to monitor the hot melt extrusion process on the basis of principal component analysis (PCA) of the NIR spectra. Monitoring the first principal component and the time-aligned reference feed rate enables the determination of the residence time in real-time.
Key words: continuous monitoring, near-infrared spectroscopy, principal component analysis, process analytical technology, SIPAT
INTRODUCTION
In the new pharmaceutical development paradigm based on QbD, process understanding requires the identification and explanation of all critical sources of variability and should enable an accurate and reliable prediction of product quality [1–3]. Ideally, it should be based on mechanistic understanding of formulations and process factors, which in turn comprises (a) the identification of key parameters and effects, (b) a real-time and continuous measurement of selected key parameters, and (c) a control strategy based on the selected uni- and multivariate real-time measurements [4]. Furthermore, as many other industries have demonstrated, mechanistic models are an important key to success.
The Process Analytical Technology toolbox provides the required link between monitoring and quality control. Monitoring is the collection and aggregation of all kind of information in real-time with in-line analyzers. Quality control, which implies the detection of quality relevant deviations, usually requires the extraction of information from the monitored data, using statistical tools combined with mechanistic models. The analysis is thus based on the process knowledge obtained from previous runs. In this study, unless otherwise stated, control refers to quality control and not to classical process control. Moreover, supervisory control means monitoring the process, detecting deviations from a stable process state and acting upon possible deviations. The integration and interaction between several different analyzers, actuators and statistical models associated to an individual unit operation is referred to a supervisory control and data acquisition (SCADA) system.
At present, many sensors are available for establishing simple physicochemical product properties, such as pH, O2 content, and other parameters. For more complex analytical objectives, multivariate data analysis (MVDA) combined with spectroscopic techniques, including near infrared (NIR) and Raman, allows qualitative and quantitative non-invasive process monitoring [4,5]. Applying multivariate statistical process control (MSPC) can be used to reduce process data streams to a convenient control chart in real-time. Clearly, this calls for an IT infrastructure (i.e., SIPAT) that can aggregate real-time process data from multiple unit operations, raw material data, PAT data, and equipment status [6].
In this study, the development and integrated use of SIPAT for monitoring and supervisory control of a continuous hot melt extrusion (HME) process is presented. In particular, the required IT architecture for real-time process monitoring based on uni- and multivariate sensor systems and their integration in SIPAT is shown. Different aspects related to process monitoring, data management of diverse types of data and development of the MSPC strategy are discussed.
HME as a Continuous Pharmaceutical Manufacturing Process
In the last years the interest in continuous manufacturing has drastically increased, albeit for a wide variety of reasons, including the smaller scale of operations, eliminating scale-up related problems, or the fact that by using a small container-based plant, drugs can be easily manufactured at different locations, which may be a significant issue for selling drugs in certain economies (e.g., China). From a chemical engineering point of view, one major advantage of continuous manufacturing is the possibility to enable real-time quality control of the products manufactured.
Among the pharmaceutical manufacturing operations, hot melt extrusion has been receiving significant attention due to its straightforward integration in a continuous manufacturing environment [7–9]. Furthermore, several innovative solid dosage forms may be produced, including solid suspensions or solid solutions for poorly soluble APIs [9–11]. In the latter case, the API is molecularly dissolved in a polymer matrix. The matrix can act as a thermal binder, drug stabilizer, drug solubilizer and/or drug release controlling excipient. However, it is imperative that the matrix suppresses recrystallization. Therefore, an appropriate carrier compound is mainly selected based on the drug-polymer interaction and miscibility, the polymer stability and the function of the final dosage form [12]. Compared with the crystalline form, the result is an enhanced dissolution rate and improved drug solubility. Moreover, extruded solid solutions have better thermodynamic stability than those prepared by alternative processes such as spray drying, solvent evaporation and other hot melt methods [13]. Other advantages of HME have extensively been discussed in the literature [12–14].
From a process technological point of view, the HME process is a continuous manufacturing process that combines multiple batch unit operations in one single process. Different process steps, such as mixing, melting, homogenization, and shaping, can be performed, offering the opportunities for automation of the manufacturing plant to limit material loss, increase the throughput, decrease energy input, and yield a product with high quality. Active areas of research include formulation design, process modeling, the design of screw assemblies and extruder dies, mixing in the extruder, long-term operational stability, controlled powder and liquid feeding, as well as the shaping of pellets from a hot strand [8].
As mentioned above, the HME process can effectively be integrated into a continuous manufacturing environment (see Fig. 1). For example, a pre-processed matrix material and an API are fed into the extruder. An example of a downstream process is hot-strand cutting. Right after exiting the die, the hot, still molten strand may be cut with a rapidly rotating cutting knife into pellets of uniform size, shape and density. This process configuration is advantageous since no subsequent spheronization and/or cooling steps and further melting of the product are required, which reduces the equipment costs and the energy required. Other process alternatives exist, such as calendaring or cooling the strand, followed by cutting of the cold strand. Subsequent downstream processes may include a tablet press, followed by coating to produce tablets or filling of the pellets into capsules [9,14,15].
Fig. 1.
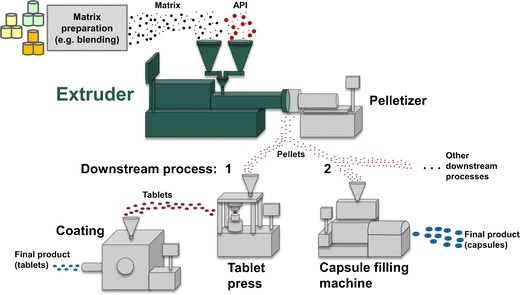
Schematic illustration of a continuous plant, including the extruder and various downstream processes
SIPAT as a PAT Software Solution
Supervisory control of the process requires the interaction of several analyzers, actuators and statistical models. In response to the growing interest in such supervisory control systems for pharmaceutical processes, Siemens developed a PAT software solution, SIMATIC SIPAT. Its modularity allows the user to monitor Critical Quality Attributes (CQAs) or process parameters influencing the CQAs and to control and optimize the manufacturing process.
SIPAT collects data in real-time from different monitoring sources and performs an aggregation function to guarantee time alignment. In addition, SIPAT brings in-line, at-line, on-line and off-line data together and provides real-time predictions of the product and process quality [16,17]. Observations, including measurements, manipulated variables (MVs) and PAT data (spectra, images, etc.) are available in real-time in SIPAT. However, SIPAT uses external calculation tools to transform the large amount of process data into information which can further be used to characterize the process. External calculation engines applied in this study are MATLAB R2008b (Mathworks Inc., Natick, Massachussets, USA) and SIMCA-Q 12.0.1 (Umetrics MKS Inc., Umeå, Sweden). The real-time prediction software SIMCA-Q facilitates an easy integration of models developed in SIMCA-P+ (Umetrics MKS Inc.), which can be used to build MVDA models. MATLAB is a programming environment for algorithm development, data analysis and numerical computation and thereby embedding MATLAB functions in the SIPAT system extends the capability of SIPAT to perform complex calculations (e.g., multivariate calculus). Moreover, SIPAT offers common communication interfaces (e.g., OPC technology), making it possible to use sensors from different manufacturers and allows the developer to import PAT tools (e.g., spectrometer) by providing customized communication interfaces.
In this work, SIPAT version 3.1.1 (Siemens Inc, Brussels, Belgium) was applied to an HME process. Here we present the network architecture of the current SIPAT configuration, including the HME process and the NIR spectrometer. Real-time monitoring of CQAs is achieved by the integration of and interaction between the HME process (generic sensors, actuators), the spectrometer, SIPAT, SIMCA-Q, and/or MATLAB. Furthermore, the export of SIPAT data (observations, results of calculations, etc.) as a standard format allows the usage of the data in an external software.
MATERIALS AND METHODS
Materials
As a test system, a new carrier material calcium stearate (CaSt; stearic acid 44% and palmitic acid 54%, EP, Werba-Chem GmbH, Vienna, Austria; volume mean particle size 16.62 μm) was used as a matrix carrier [14], and the API was paracetamol (G.L. Pharma GmbH, Lannach, Austria; volume mean particle size 139.2 μm).
Extrusion Process and Process Analytical Tools
An intermeshing co-rotating twin screw extruder (ZSK 18, Coperion GmbH, Stuttgart, Germany) with a screw diameter of 18 mm (D0/Di = 1.55) was used. The closely intermeshing co-rotating twin screw extruder has two symmetrical screws with identical geometry that rotate at the same speed. The screws have the same screw diameter, which must be smaller than the barrel diameter in order to establish a specified small clearance in the order of 100 μm between the external wall and the screw tip. Depending on the section of the extruder, particular screw elements (conveying, kneading or right-handed elements) must be chosen in order to perform basic functions. The barrels and the screws are of a modular design and the screws must be assembled depending on the formulation. The configuration of the co-rotating screws was selected to fulfill the following basic function, which can be described by several zones along the processing unit of the extruder. First, in the intake zone (conveying elements) the material is moved along the screws, compressing solids. Second, in the plastification zone (kneading elements) softening and partial melting of the material takes place before the soft material melt is mixed. Finally, the melt is conveyed towards the die area, where constant pressure forces the material through the die [8,14,18]. The screw design is shown in Fig. 2.
Fig. 2.
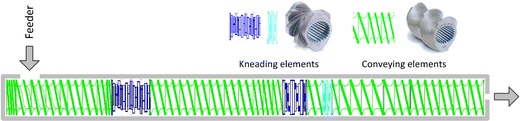
Screw configuration showing the arrangement of conveying and kneading elements
A twin-screw gravimetric feeder (KT20, K-Tron, Niederlenz, Switzerland) was used to control the feed rate of the powders. For split-feeding experiments, a second feeder of the same type was employed.
HME Process Parameters
The process parameters were (a) formulation (concentrations), (b) extruder configuration (screw configuration, die geometry, etc.), (c) barrel set-temperature profile, (d) throughput, and (e) screw speed. The screw speed, feed rates and barrel temperatures of barrel sections 2 to 10 can be manipulated. These parameters affect the process characteristics, and thus, impact the quality of the final product. The following input parameters were specified by the operator, i.e., the set points of the process:
Screw speed rss,
Feed rate rf1 and rf2,
Barrel temperatures rti with i = 2,…,10 and
8–0 adapter temperature rta.
The 8–0 adapter (i.e., connection to the die) replaces the last barrel of the extruder and represents the connection of the extrusion process to the downstream process, the pelletizer. The number “8” describes the geometry of the double-screw channel, and “0” the geometry of the die. Figure 3 schematically illustrates the extruder, emphasizing the input (red) and output (green) parameters and the location of the sensors, which is significant for process analyzing.
Fig. 3.

Schematic illustration of the extruder and the input parameters, i.e., controlled parameters (screw speed, barrel temperatures, and feed rate) are highlighted in red and the output parameters (screw speed, feed rate, torque, barrel temperatures, material pressure, material temperature, and the spectrum) are shown in green
The set points are listed in Table I. For the split feeding experiment, both feeders were filled with a premix. Feeder 1 contained 80% CaSt and 20% paracetamol, and feeder 2 contained a premix with 50% CaSt and 50% paracetamol. By adjusting the feed rates of the two feeders, different paracetamol concentrations were obtained. In all experiments, the total throughput (feeder 1+2) was 0.6 kg/h.
Table I.
Summary of the Set Points for the Experiments
| Chemical composition | Process parameters | ||||||||||||||
|---|---|---|---|---|---|---|---|---|---|---|---|---|---|---|---|
| CaSt | Paracetamol | Feeder 1 feed rate | Feeder 2 feed rate | Screw speed | Barrel temperatures | 8–0 adapter | |||||||||
| 1 | 2 | 3 | 4 | 5 | 6 | 7 | 8 | 9 | 10 | ||||||
| – | – | rf1 | rf2 | rss | – | rt2 | rt3 | rt4 | rt5 | rt6 | rt7 | rt8 | rt9 | rt10 | rta |
| (%) | (%) | (kg/h) | (kg/h) | (rpm) | (°C) | (°C) | (°C) | (°C) | (°C) | (°C) | (°C) | (°C) | (°C) | (°C) | (°C) |
| 80 | 20 | 0.6 | 0.0 | 150 | 20 | 90 | 110 | 110 | 100 | 100 | 100 | 100 | 100 | 100 | 125 |
| 70 | 30 | 0.4 | 0.2 | 150 | 20 | 90 | 110 | 110 | 100 | 100 | 100 | 100 | 100 | 100 | 125 |
| 60 | 40 | 0.2 | 0.4 | 150 | 20 | 90 | 110 | 110 | 100 | 100 | 100 | 100 | 100 | 100 | 125 |
| 50 | 50 | 0.0 | 0.6 | 150 | 20 | 90 | 110 | 110 | 100 | 100 | 100 | 100 | 100 | 100 | 125 |
Important parameters that should be measured (output parameters) include torque, pressure profile, melt-temperature profile, residence time distribution, dispersion quality, etc. Unfortunately, only a few parameters can be measured directly. For example, it is not possible to measure the melt temperature accurately as temperature probes cannot penetrate the melt channel. Thus, the temperatures measured (e.g., ytm below) are a mixture of melt and wall temperatures. Similar considerations apply with respect to the chemical information (i.e., dispersion quality, mixing), which is not directly available. However, integration of a NIR spectrometer in the extruder allows measurement of the concentration at the die. Note, that the measurements are performed in a region close to the wall (in an area with low velocity) as the penetration depth of the NIR signal is in the range of only a few hundred microns (depending on formulation). Nevertheless, the information is highly useful for monitoring the overall process.
Specifically we measured (output parameters):
Spectrum yS: The NIR spectrometer was used to obtain information regarding the quality of the product. The data of the spectra are multi-valued data.
- Temperature sensors:
- Temperature of the barrels yti with i = 1,2,…,10.
- Temperature of the 8–0 adapter yta.
- Material temperature ytm. One sensor measured the temperature of the material in the die section (cf. Fig. 3).
- Powder feed rate
- Feed rate yf1 and yf2. The powder flow at the feeder was measured through a loss-in-weight system.
- Pressure
- Material pressure ypm. The pressure of the material was measured in the die section.
- Machine parameters
- Screw speed yss in revolutions per minute.
- Torque ymd. The rpm and the torque of the main drive were measured.
NIR Spectroscopy as an Integrated PAT Tool
In pharmaceutical manufacturing NIR spectroscopy has long become an important tool for raw material testing, product quality control and process monitoring. Compared with other analytical techniques, NIR has several major advantages: (a) no or minimal sample preparation is needed, (b) predicting chemical and physical sample parameters from one single spectrum after calibration is possible, (c) measurements using fiber optic probes can be performed, and (d) a high measurement rate can be sustained [3,19,20]. Nevertheless, several challenges remain, including reliability, model robustness, penetration depth, and ease of use.
In our work, a diode array-based near-infrared spectrometer, SentroPAT FO (Sentronic GmbH, Dresden, Germany), with a fiber-optic Dynisco NIR probe was used. The Dynisco probe is a special probe for 1/2'' UNF thread, as used for extruders. The spectrometer covers the wavelength range of 1,100 to 2,200 nm with a resolution of 2 nm. NIR spectra were collected in transflectance mode. One hundred twenty spectra were averaged and an integration time of 0.014 s per spectrum was used. NIR absorption bands can be formed as combinations from mid-IR fundamental frequencies or as NIR overtone absorption. The characteristics of NIR absorption bands restrict the sensitivity in the classical spectroscopic sense as they are typically broad, overlapping and 10 to 100 times weaker than their corresponding fundamental mid-IR absorption bands. Thus, the development of analytical methods based on these properties of the NIR spectra requires data filtering and multivariate data analysis techniques to relate spectral information to sample properties [3,20,21].
Network Architecture
In order to monitor and control a process, uni- and multivariate sensors and actuators have to be embedded in SIPAT. Thus, a certain network architecture based on the software design of SIPAT and the hardware (i.e., the HME process in this case) is required, as illustrated in Fig. 4. In the context of SIPAT, one distinguishes between a base station, collector stations, clients, and the central database. A collector station is responsible for acquiring data for one certain sensor system. This implies that every spectrometer, as well as univariate sensors (e.g., temperatures, feed rates, etc.), represent a collector station. A base station combines data from several collector stations into a SIPAT method reflecting all data from one specific unit operation, e.g., extrusion, blending, tableting, etc. [16,17,22]. The central database is mandatory for the SIPAT system. All the system configuration information, as well as all historical and real-time data, are stored in this database. The client PCs are essential for configuration purposes, but are primarily used to monitor the process in real-time and to analyze historical data.
Fig. 4.

Network architecture of the hot melt extrusion process. The SIPAT components are highlighted
The focus of this study is on a single unit operation, i.e., the HME process, and consequently, only one base station with two collector stations is required. Thus, the main components are (a) a spectrometer PC as a collector station, (b) an industrial PC as a collector station for all other extrusion data, (c) a Coperion PC with the operator monitor (independent of the SIPAT system), (d) a HME process, (e) a server PC, including a central database as well as a base station, and (f) an arbitrary number of clients. The communication between SIPAT components is based on Ethernet.
Principles of SIPAT Components
The HME system has two collector stations: (a) the spectrometer was integrated into SIPAT via a SIPAT analyzer driver. Sentronic provides a software layer that integrates the SentroPAT FO spectrometer into SIPAT. The configuration of the spectrometer (e.g., definition of the integration time, the number of spectra that were averaged, etc.) has to be predefined by a software from Sentronic and is loaded from the SIPAT collector interface.
(b) The second collector for all other data is based on OPC technology. OPC technology is used to distribute the extrusion process data from different univariate sensors to the OPC clients, especially to SIPAT acting as an OPC client. Object Linking and Embedding (OLE) specifies a standard for communicating real-time process data between the control devices and the sensors from different manufacturers. The OPC server uses the OPC Data Access (OPC DA) specifications that define communication protocols for real-time communications between data acquisition devices and Human Machine Interfaces (HMIs) or databases. As such, OPC DA deals only with real-time data and not with historical data [22]. The OPC server and the SIPAT collector station are installed on an Industrial PC. Furthermore, the Coperion PC and the operator monitor are used to display SIMATIC WinCC. Windows Control Center (WinCC) is a supervisory control and data acquisition system as well as a HMI. As a consequence, the operator can monitor the univariate data of the process by WinCC and SIPAT.
SIPAT aligns all measured input variables from the various collector stations. While the spectrometer delivered the measurements within 2 to 3 s, the extruder provided the data faster. The sampling rate should be a trade-off between (a) noise reduction, (b) relevance to the dynamics, and (c) restrictions from a computational performance perspective. Consequently, the sampling period was chosen to be 5 s.
SIPAT as Control Unit
In addition to monitoring the process, SIPAT may be used to control the process, both in a process-control and quality-control context. Therefore, SIPAT can adjust set points, as illustrated in Fig. 5. SIPAT is integrated into the system based on OPC technology. This configuration enables two (mutually exclusive) operating modes: (a) the user working directly on the HME process monitors via WinCC the process parameters and may manipulate set points and (b) the SIPAT user (remotely) monitors and possibly manipulates the process from any SIPAT Client PC. Only the latter mode allows the user to access spectral information and to detect deviations, leading to control action, i.e., adjusting the set points. Furthermore, this configuration opens up the opportunity to easily integrate an automatic process control strategy, i.e., a closed-loop controller, such as a feedback or model predictive controller (MPC) in SIPAT. However, the control of the product quality is currently carried out manually using the WinCC or the SIPAT interface.
Fig. 5.
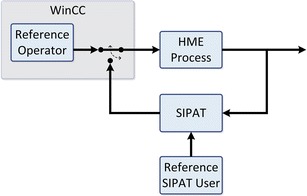
The feedback connection via SIPAT allows the SIPAT user to manipulate input parameters
System Functionalities and Data Flow Diagrams
The HME process is a multi-input multi-output (MIMO) system. Thus, the extrusion process can be viewed as a “13 input x 19 output” process. The input parameters are the screw speed, both feed rates, 9 barrel temperatures and the temperature of the 8–0 adapter. The measured material temperature, the material pressure, the torque, both feed rates, 10 barrel temperatures, the temperature of the 8–0 adapter and the projection of the measured spectrum onto two variables are counted as output parameters. However, the spectrum is a high-dimensional set of parameters and thus, the number of output parameters depends on the processing method (e.g., PCA, PLS regression, etc.) applied to the spectra. In theory, also three or more principal components could be used. Data analysis can be applied to identify and eliminate the parameters with little or no correlation to the product quality characteristics of interest [23]. Therefore, the following procedure is a straightforward way to gather time-aligned data (set points and output parameters) which can directly be used to analyze and identify critical process parameters.
Figure 6 shows the basic data flow diagram including MATLAB, SIPAT, the process, and SIMCA-Q. In general, the process followed a certain profile of the reference feed rate defined in MATLAB. Moreover, the spectrum acquired with the NIR spectrometer was processed by SIMCA-Q. The entire data were recorded and stored in the central database.
Fig. 6.

Manipulation of the reference feed rate and observation of the spectrum that was analyzed in real-time using SIMCA-Q. The input and output data were analyzed off-line, i.e., in MATLAB, where the input sequences and the data from SIMCA-Q were time-aligned
Figure 7 depicts a more detailed data flow diagram which illustrates the interactions between SIPAT, the NIR spectrometer, the Industrial PC, SIMCA-Q, the client PC(s), and the process itself. The spectrometer PC delivered multi-value measurements (spectra) and the Industrial PC provided SIPAT with scalar measurements (e.g., screw speed, barrel temperatures, and feed rate) via OPC. An arbitrary PC was configured as a MATLAB SIPAT PC to execute MATLAB scripts. A predefined input sequence (e.g., reference feed rate) was generated off-line in MATLAB and could easily be adapted for another input parameter or expanded for multiple input parameters. After acquiring a new set point of the input feed rate, SIPAT distributed the scalar via OPC technology to the extruder. The extruder forwarded the value to the feeder that modified the feed rate. In order to investigate the influence of input parameters on the product quality, the observed spectrum had to be interpreted, i.e., in real time using SIMCA-Q by projecting the data onto a reduced dimensional space. After the experiment, the observed data were analyzed off-line, i.e., in MATLAB where the input sequences and data from SIMCA-Q were time-aligned available.
Fig. 7.
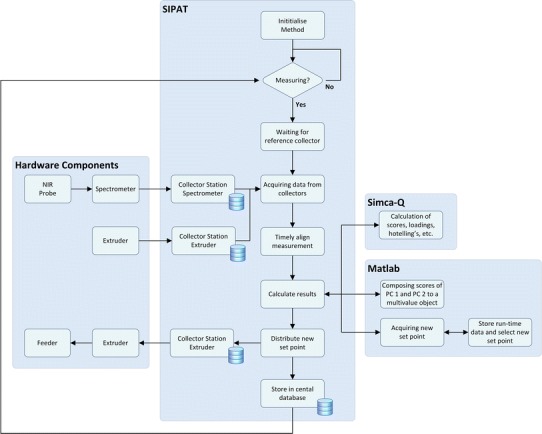
The hardware components (spectrometer, extruder, and feeder), SIPAT, Umetrics, and MATLAB interact to distribute predefined samples and collect measurements time-aligned. After the experiment, the entire data (input data, measurements and calculated data) is accessible time-aligned
Process Analysis in a Reduced Dimensional Space
Using MSPC, an operator can monitor the performance of an entire plant looking at only a few multivariate control charts [24]. For example, data representation in a much lower-dimensional space was utilized in other processes [25,26]. Here, the spectrometer delivered a spectrum in the wave length range of 1,100 to 2,200 nm and with a resolution of nm. Thus, the output data had 551 elements (m = 551) for N data points, the data matrix X can be written as
| 2.1 |
with the measured intensity yI100 at a wave length of 1,100 nm, for example. Apparently, one spectrum contains highly correlated variables, and therefore a specific number of independent variables should deliver the significant information. Principal component analysis (PCA) applied to the observed data may be used to extract the essential information. This method is based on the calculation of eigenvectors of the covariance matrix of the observed spectra (cf. with data matrix X). For adequate modeling of the covariance structure of X the number of principal components should be appropriate. In the following a principal components are sufficient to represent the spectra in a reduced dimensional space without losing essential information. Consequently, the data matrix can be represented as
| 2.2 |
with the score matrix T, the loading matrix P and the random error E. The score matrix
| 2.3 |
with the set of vectors
| 2.4 |
generated by an orthogonal subspace, which is usually of a much smaller dimension than the data matrix X (a<<m). The loading matrix
| 2.5 |
with
| 2.6 |
provides information regarding the patterns in the scores and allows interpretation of groups of variables related to specific features in the spectrum. The scores may be used to extract information about the relationships between objects (e.g., trends, groupings, outliers) and how the process moved in the subspace. In this study, we focused on the interpretation of the score plots of the principal components (e.g., scores t1versus t2) [23,27–29].
RESULTS AND DISCUSSION
The input feed rates rf1 (feeder 1) and rf2 (feeder 2) were chosen as the manipulated variables that directly influence the CQA, i.e., the API concentration of the extrudate. High frequency perturbations of the feed rates are dampened by the back-mixing ability of the extruder, whereas low frequency disturbances influence the final product quality. Thus, pharmaceutical powder-feeding dynamics are a very important factor for content uniformity of the melt.
Monitoring of Spectra
Depending on the premix in the feeders, a specified API concentration of the extrudate at the die was set. Figure 8 illustrates the NIR spectra collected while varying the feed rates. The colored spectra depict stable process conditions; whereas, the gray highlighted spectra denote transitions caused by manipulating the reference feed rates. SIPAT can visualize and process the spectra in real-time. In order to make a precise and explicit statement about the API concentration of the extrudate, it is mandatory to process the spectra. As discussed in a previous section, the spectral data are processed and analyzed applying PCA.
Fig. 8.

NIR spectra collected while changing the reference feed rates of feeder 1 and 2. The total throughput was constant at 0.6 kg/h
Process Monitoring Based on PCA using SIPAT
Monitoring the process in the reduced PC space is a straightforward way of implementing real-time process analysis. The observations and processed data (using SIMCA-Q) were visualized in SIPAT.
An appropriate pre-processing concept (e.g., standard normal variate, detrending, Savitzky–Golay filter, etc.) can eliminate the influence of physical parameters (i.e., opacity and melt temperature) on the concentration measurement [3]. Variations of the temperature and the opacity of the melt lead to multiplicative effects and baseline shifts in the observed spectra. However, this was not done in the current study. Thus, physical information is preserved and opacity and the temperature of the melt can be extracted from the spectra. This is even more important in continuous manufacturing, as the extruder is connected to the pelletizer. The pelletizer requires an intermediate product with consistent physical parameters (e.g., material temperature) in order to process the material properly. Since small variations of the melt temperature might influence the size and shape of the final product (i.e., the pellets), it is important to detect deviations from the stable state. In summary, the unprocessed spectra were used for further processing and analysis of the data.
Figure 9(a) illustrates the score plot of the principal components t1 and t2. Adjusting the feed rates of the feeders resulted in different API concentrations in the extrudate which show up in the score plot as clusters of observations. Applying PCA to the data could thus be seen as classification of the main events affecting the process. The four clusters represent 20% (red), 30% (blue), 40% (magenta), and 50% (cyan) API content in the extrudate in the die section (gray dots correspond to observations made during transitions between stable process conditions).
Fig. 9.

a Different API concentrations (20%, 30%, 40%, and 50%) result in the clustering of samples in the score plot (t1 versus t2). b The trajectory from the stable state 1 (20% API concentration) to the stable state 2 (30% API concentration) was monitored in real-time via SIPAT. The mean settling time from one process condition to the other stable state was approximately 100 s
As opacity of the melt is directly related to the API concentration, and since opacity saturates at approximately 40% API, higher API concentrations (>40%) cannot be distinguished with only one PC obtained from unprocessed spectra and a second principal component is required. The necessity of the second principal component for the separation of spectra associated with higher API concentrations can also be seen in Fig. 9(a), i.e., t1 scores for 40% and 50% are very close.
Two principal components additionally allow a better specification of a stable state with respect to the API concentration and process parameters such as the melt temperature. A closer inspection of the trajectory between stable states in the subspace allows real-time monitoring of the process states. This can be carried out by different graphical methods, such as a score plot or the illustration of the scores of each principal component over time. The former method is shown in Fig. 9(b), where the trajectory from state 1 (20% API concentration) to state 2 (30% API concentration) is shown. The advantage of this illustration is that the operator can directly detect variations of both principal components. However, the disadvantage is that data points cannot be related to the process time. This drawback can be overcome by displaying the scores of each principal component in dependence on the process time, as depicted in Fig. 9(b).
Figure 10 illustrates the score values t1 and the reference feed rate of feeder 1 rf1 as a function of time. While the first principal component scores change because of the API concentration (from high to low, in steps of 10%) the transport delay (residence time) becomes also evident (see Fig. 10a, b). The time to reach steady-state (settling time) can also be determined by comparing the reference feed rate and score values of the first principal component. The delay time for this particular process configuration (formulation, screw configuration, die geometry, etc.) was approximately 55 s, and the settling time of a step change was approximately 100 s. These parameters were easily identified in real-time via SIPAT based on Fig. 10.
Fig. 10.
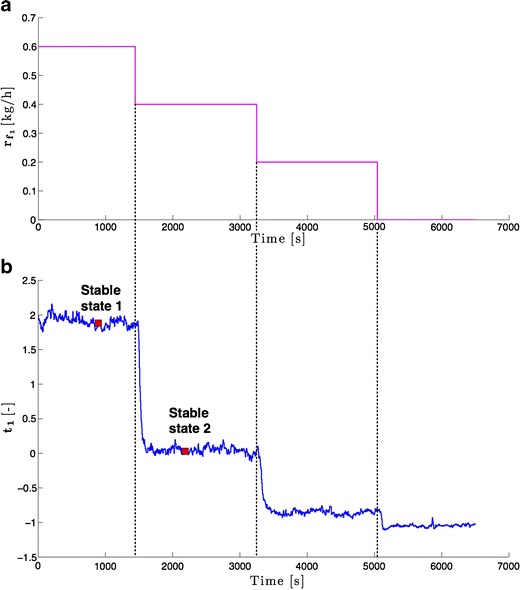
The reference feed rate of feeder 1 a and the score values of the PC 1 b can be used to obtain the residence time in real-time in SIPAT
CONCLUSION
Continuous manufacturing requires monitoring (and eventually control) of critical process parameters for each unit operation. However, in most cases numerous process variables are recorded, and in case of spectral process analyzers, hundreds of variables per measurement have to be considered. Thus, monitoring the process in a reduced dimensional space is beneficial. This can be achieved by applying PCA to the observed spectra.
In this study the monitoring and supervisory control of a continuous hot melt extrusion (HME) process with generic sensors and a near-infrared (NIR) spectrometer in real-time is described, using SIPAT (Siemens platform to collect, display, and extract process information) and additional components. SIPAT aligns spectra from the product material in the die section with univariate measurements (screw speed, barrel temperatures, material pressure, etc.). Based on this a multivariate supervisory quality control strategy was developed for the process.
However, the MVDA models that are developed in this process can be applied to only one formulation. In a typical campaign-driven manufacturing environment (which even continuous manufacturing of the future will be) formulations and/or products may change weekly or monthly. Automatic model development can be performed via the procedure described (Fig. 6). Additionally, real-time analysis of acquired spectra or PAT data can be used as a basis for multivariate statistical process control (MSPC) strategies and for optimizing the process to a desired product quality. The concept of model predictive control (MPC) can be applied to control the manufacturing process, meaning that control can be established based on the current measurements, a process model and the already existing feedback connection via platforms such as SIPAT.
Further work will be directed at expanding the experience and the range of the process applications to other continuous primary and secondary pharmaceutical unit operations and at other more challenging PAT monitoring tools, feed-forward control strategies, and multivariate supervisory control visualization.
References
- 1.FDA . Guidance for Industry. PAT - a framework for innovative pharmaceutical development, manufacturing, and quality assurance. Quality Assurance. Rockville: US Department of Health; 2004. [Google Scholar]
- 2.ICH. ICH Q8(R2), Pharmaceutical Development, Part I: Pharmaceutical development, and Part II: Annex to pharmaceutical development. 2009.
- 3.Simpson, MB (2010) Near-infrared spectroscopy for process analytical technology: theory, technology and implementation. Bakeev, K (ed) Process analytical technology: spectroscopic tools and implementation strategies for the chemical and pharmaceutical industries (second ed.). Wiley: NY, p. 107–55.
- 4.Koller DM, Posch A, Hörl G, Voura C, Radl S, Urbanetz N, et al. Continuous quantitative monitoring of powder mixing dynamics by near-infrared spectroscopys. Powder Technol. 2011;205(1–3):87–96. doi: 10.1016/j.powtec.2010.08.070. [DOI] [Google Scholar]
- 5.Koller DM, Hannesschläger G, Leitner M, Khinast JG. Non-destructive analysis of tablet coatings with optical coherence tomography. Eur J Pharm Sci. 2011;44(1–2):142–148. doi: 10.1016/j.ejps.2011.06.017. [DOI] [PubMed] [Google Scholar]
- 6.Schenck L, Troup GM, Lowinger M, Li L, McKelvey C. Achieving a hot melt extrusion design space for the production of solid solutions. In: am Ende DJ, editor. Chemical Engineering in the Pharmaceutical Industry: R&D to Manufacturing. first ed. John Wiley & Sons; 2011. p. 819–35.
- 7.Hirsch J. Online Monitoring Of Continuous Hot Melt Extrusion. Pharmaceutical Technology Europe. 2010. http://www.pharmtech.com/pharmtech/Analytics/Online-Monitoring-Of-Continuous-Hot-Melt-Extrusion/ArticleStandard/Article/detail/687919. Accessed 3 March 2013.
- 8.Breitenbach J. Melt extrusion: from process to drug delivery technology. Eur J Pharm Biopharm. 2002;54(2):107–117. doi: 10.1016/S0939-6411(02)00061-9. [DOI] [PubMed] [Google Scholar]
- 9.Crowley MM, Zhang F, Repka MA, Thumma S, Upadhye SB, Battu SK, et al. Pharmaceutical applications of hot-melt extrusion: part I. Drug Dev Ind Pharm. 2007;33(9):909–926. doi: 10.1080/03639040701498759. [DOI] [PubMed] [Google Scholar]
- 10.Repka MA, Battu SK, Upadhye SB, Thumma S, Crowley MM, Zhang F, et al. Pharmaceutical applications of hot-melt extrusion: Part II. Drug Dev Ind Pharm. 2007;33(10):1043–1057. doi: 10.1080/03639040701525627. [DOI] [PubMed] [Google Scholar]
- 11.Crowley MM, Schroeder B, Fredersdorf A, Obara S, Talarico M, Kucera S, et al. Physicochemical properties and mechanism of drug release from ethyl cellulose matrix tablets prepared by direct compression and hot-melt extrusion. Int J Pharm. 2004;269(2):509–522. doi: 10.1016/j.ijpharm.2003.09.037. [DOI] [PubMed] [Google Scholar]
- 12.Partel PS, Raval JP, Patel HV. Review on the pharmaceutical applications of hot melt extruder. Asian J Pharm Clin Res. 2010;3(2):80–83. [Google Scholar]
- 13.Williams M, Tian Y, Jones DS, Andrews GP. Hot-melt extrusion technology: Optimizing drug delivery. Eur Ind Pharm. 2010;7:7–10. [Google Scholar]
- 14.Roblegg E, Jäger E, Hodzic A, Koscher G, Mohr S, Zimmer A, et al. Development of sustained-release lipophilic calcium stearate pellets via hot melt extrusion. Eur J Pharm Biopharm. 2011;79(3):635–645. doi: 10.1016/j.ejpb.2011.07.004. [DOI] [PubMed] [Google Scholar]
- 15.Radl S, Tritthart T, Khinast JG. A novel design for hot-melt extrusion pelletizers. Chem Eng Sci. 2010;65(6):1976–1988. doi: 10.1016/j.ces.2009.11.034. [DOI] [Google Scholar]
- 16.SIMATIC SIPAT. The software heart of PAT; White paper. Siemens AG. Siemens AG.
- 17.Frenne F De. User Manual; Simatic SIPAT Version 3.1.1. History. Siemens AG; 2011.
- 18.Kohlgrüber K. Co-Rotating Twin-Screw Extruders: Fundamentals, Technology, and Applications. Hanser Gardner Publications, Inc.; 2008
- 19.Kessler RW. Prozessanalytik: Strategien und Fallbeispiele aus der industriellen Praxis. Wiley-VCH; 2006.
- 20.Reich G. Near-infrared spectroscopy and imaging: basic principles and pharmaceutical applications. Adv Drug Deliv Rev. 2005;57(8):1109–1143. doi: 10.1016/j.addr.2005.01.020. [DOI] [PubMed] [Google Scholar]
- 21.De Beer T, Burggraeve A, Fonteyne M, Saerens L, Remon JP, Vervaet C. Near infrared and Raman spectroscopy for the in-process monitoring of pharmaceutical production processes. Int J Pharm. 2011;417(1–2):32–47. doi: 10.1016/j.ijpharm.2010.12.012. [DOI] [PubMed] [Google Scholar]
- 22.Tandt P De. Exception Handling; SIMATIC SIPAT Version 3.1.1. Siemens AG; 2011.
- 23.Haley TA, Mulvaney SJ. On-line system identification and control design of an extrusion coking process: Part I. System Indentification. Food Control. 2000;11(2):103–120. doi: 10.1016/S0956-7135(99)00068-7. [DOI] [Google Scholar]
- 24.Kourti T. Application of latent variable methods to process control and multivariate statistical process control in industry. Int J Adaptive Control Signal Proc. 2005;19(4):213–246. doi: 10.1002/acs.859. [DOI] [Google Scholar]
- 25.Nomikos P, MacGregor JF. Monitoring batch processes using multiway principal component analysis. AICHE J. 1994;40(8):1361–1375. doi: 10.1002/aic.690400809. [DOI] [Google Scholar]
- 26.Flores-Cerrillo J, MacGregor JF. Control of batch product quality by trajectory manipulation using latent variable models. J Process Control. 2004;14(5):539–553. doi: 10.1016/j.jprocont.2003.09.008. [DOI] [Google Scholar]
- 27.MacGregor JF. Data-based Latent Variable Methods for Process Analysis; Monitoring and Control. Comput Aided Chem Eng. 2004;18:87–98. doi: 10.1016/S1570-7946(04)80085-3. [DOI] [Google Scholar]
- 28.Liu JJ, MacGregor JF. Froth-based modeling and control of flotation processes. Miner Eng. 2008;21(9):642–651. doi: 10.1016/j.mineng.2007.12.011. [DOI] [Google Scholar]
- 29.MacGregor JF, Yu H, García Muñoz S, Flores-Cerrillo J. Data-based latent variable methods for process analysis, monitoring and control. Comput Chem Eng. 2005;29(6):1217–1223. doi: 10.1016/j.compchemeng.2005.02.007. [DOI] [Google Scholar]