

Abstract
A series of blends of polydimethylsiloxane (PDMS) and indomethacin (IMC), containing 20–80 wt.% IMC were obtained and characterized by differential scanning calorimetry, Fourier transform–infrared spectroscopy, and powder X-ray diffraction in order to observe the mutual influence of the two components. The main thermal transitions of PDMS remained un-changed. Both the solvent (tetrahydrofuran, THF) and the PDMS influenced the crystalline form of IMC. The blends were subsequently re-dissolved in THF, with or without cross-linking reagents added and precipitated into diluted aqueous solutions of siloxane-based surfactants. The resulted nanoparticles were analyzed by dynamic light scattering and scanning electron microscopy. Most of the particles had diameters between 200 and 300 nm. The surfactants, the IMC content and the cross-linking influenced the particles size and polydispersity, as well as the nanoparticle yield. The maximum drug release from selected aqueous formulations was 30%.
Key words: indomethacin, nanoparticles, polydimethylsiloxane
INTRODUCTION
Polysiloxanes have many biomedical uses, especially in implantology, transdermic applications and drug delivery (1–3). They are well-known for their biocompatibility (especially referring to high molecular weight homologs) and at the same time, they are among the most tested materials concerning safety (2,4,5). Apart the biological inertness, polysiloxanes are characterized by hydrophobicity, permeability to diffusion of different substances, including gases, water vapors and drugs, as well as by specific visco-elastic properties (2). The controlled release of active drugs with polydimethylsiloxane (PDMS) goes back to the 1960s (6). At the present, there are numerous commercially available products in which silicones are used as actives or excipients. For example, silicones act as antifoams in gastro-enterology, being very effective in anti-acid formulations (6). The drug release from silicone-containing formulations is controlled by its diffusion through the silicone network (6,7).
In our previous work, we tested the possibility of using PDMS as a core polymer in nanoparticles obtained by precipitation in the presence of different stabilizers, having a siloxane-organic structure (8–10). We have shown that cross-linking of PDMS may occur in the nanoparticles (9,10), and that improved stability of the particles is obtained after this step. Taking into account the properties of polysiloxanes, in particular of PDMS, they can be considered an interesting alternative as polymer matrix for nanoparticles encapsulating drugs or other active principles, for oral or topical formulations.
The anti-inflammatory non-steroidal drugs (AINS) are used in rheumatoid and osteoarthritis and in local inflammation (11). The oral therapy with AINS is very efficient, but the clinical use is often limited due to potential side effects, like irritations and ulcerations of the gastro-intestinal mucous membrane (12). These well-known side effects of AINS oral administration accelerated the development of alternative pharmaceutical formulations, such as creams, gels, and topic foams, which allow the local adsorption to the inflammation site, without adverse systemic reactions (13). Nevertheless, effective drug encapsulation for oral or parenteral use is very important for limiting side effects and maintaining efficiency. Indomethacin (IMC) is a hydrophobic, model AINS drug in many investigations.
Different applications have been proposed for drug-loaded nanoparticles, like targeted drug delivery, controlled release, increasing bioavailability of poor water-soluble drugs (14,15). The nanoparticles used for this purpose, roughly having dimensions between 10 and 1,000 nm, may be nanocapsules or nanospheres. Several characteristics of the particles were recognized as key parameters for magnified efficacy of nanoparticles for therapeutic applications: particle size, particle shape, surface characteristics and release of therapeutics (16).
By combining IMC and PDMS, improved results might be obtained in topical applications (due to the substantivity of PDMS) or oral administration (due to the low density and antifoam properties of PDMS). These potential benefits prompted a basic investigation on the mutual influence of the drug and the matrix, in order to better understand processes like blending, encapsulation or release. In this study, the approach was to mix PDMS and IMC in different proportions in a common organic solvent. The obtained blends were investigated by DSC, FT-IR, and powder X-ray diffraction and their properties are considered the model for nanoparticles obtained thereof. The nanoparticles were prepared by re-dissolving the blends in THF and precipitation in water in the presence of siloxane-based surfactants, previously reported (8,17), and were characterized by dynamic light scattering (DLS) and scanning electron microscopy (SEM). Selected aqueous formulations were investigated for drug release mechanism.
MATERIALS AND METHODS
Materials
PDMS, HO-terminated (Mn = 30,000) (Rhodia), indomethacin (IMC) (S.C. Antibiotice S.A. Iasi Romania), tetraethoxysilane (TEOS), dibutyltin dilaurate (DBTDL), and THF (Fluka) were high-purity commercial products and were used as such.
The surfactants (S1 and S2, Scheme 1) have been reported previously, and their critical micelle concentration (CMC) and equilibrium surface tension (γ) have been determined by tensiometry. Pentamethylsebacomethyldisiloxane potassium salt (S1) has been prepared according to (8); CMC = 0.087 g/l, γ = 39.6 mN/m. Tromethamol-modified disiloxane (S2) has been synthesized according to (17); CMC = 0.066 g/l, γ = 29.14 mN/m.
Scheme 1.
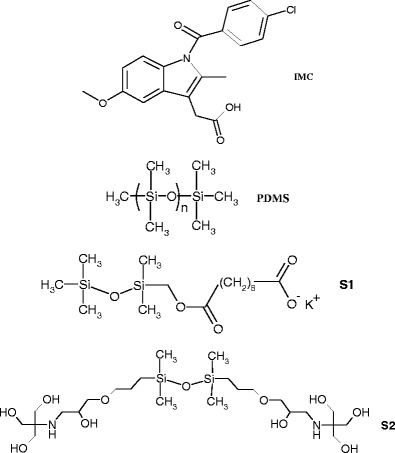
Chemical structure of Indomethacin: 2-{1-[(4-chlorophenyl)carbonyl]-5-methoxy-2-methyl-1H-indol-3-yl}acetic acid; PDMS and surfactants used
Methods
The infrared spectra were registered on a Bruker Vertex 70 FT-IR instrument, in transmission mode, in the 300–4,000 cm−1 range (resolution 2 cm−1, 32 scans), at ambient temperature.
Differential scanning calorimetry (DSC) investigations were done on a Pyris Diamond DSC (Perkin Elmer USA) instrument. The samples were cooled from room temperature to −150°C then heated with a heating rate of 10°C/min.
SEM observations were done with an Environmental Scanning Electron Microscope type Quanta 200, operating at 30 kV with secondary electrons. The microscope Energy Dispersive X-Ray system (EDX) was used for qualitative and quantitative elemental analysis.
Particles size (average diameter) and distribution (polydispersity index) were determined by DLS on a Malvern Zetasizer NS (Malvern Instruments, UK), which uses non-invasive backscatter detection (173°) and laser wavelength of 633 nm. The concentrated dispersions of nanoparticles were measured without further dilution.
UV–Vis measurements were made on an Analytic Yena SPECORD 200 spectrophotometer.
Powder XRD spectra were registered on an Oxford-Diffraction XCALIBUR E CCD diffractometer equipped with graphite-monochromated Mo-Kα radiation. The as acquired spectra were then converted to Cu-Kα wavelength, for convenient comparison with available literature data.
Preparation of the Blends
The PDMS and IMC were separately dissolved in THF. The components were mixed in different proportions, in order to vary the IMC content according to Table I. After stirring for a few minutes at room temperature, the solvent was removed under reduced pressure and the remaining materials were stored in closed vials.
Table I.
The Composition of The Blends
| Blend code | 1 | 2 | 3 | 4 | 5 |
|---|---|---|---|---|---|
| IMC % (wt.) | 20 | 40 | 50 | 60 | 80 |
Preparation of Nanoparticles
In a typical example, the PDMS/IMC blend (40 mg) was dissolved in 4 mL of THF. In certain experiments (see Table II), a cross-linking agent (TEOS, 50% wt. reported to PDMS), and a droplet of condensation catalyst (DBTDL) were added to the THF solution. The organic phase was injected into 8 mL of an aqueous solution of surfactant (1 g/L in the case of S1 and 0.8 g/L in the case of S2), under gentle stirring. After 15 min, the THF and a small amount of the water (1–2 ml) were removed at rotary evaporator (40°C, and 40 mmHg). When precipitation was observed, the solution was filtered through blue ribbon filter paper and this filtrate was considered further as nanoparticle formulation. The nanoparticle yield (NY) was estimated by weighing the non-encaspulated material, with the formula:
| 1 |
where m0 is the initial mass of the blend; mp is the mass of precipitate.
Table II.
Preparation of PDMS/IMC Nanoparticles: Experimental Details and DLS Results
| NP code | Blend code | Cross-linking reagents | Surfactant | Nanoparticle yield, %a | Drug load, %b | Z ave (nm) | PDI |
|---|---|---|---|---|---|---|---|
| A | 1 | – | S1 | 100 | 19.9 ± 0.1 | 252 | 0.413 |
| B | 1 | TEOS, DBTDL | S1 | 93 | 17.5 ± 0.3 | 214 | 0.432 |
| C | 3 | TEOS | S1 | 88 | 45.2 ± 0.3 | 246 | 0.422 |
| D | 4 | TEOS, DBTDL | S1 | 81 | 55.6 ± 0.2 | 165 | 0.240 |
| E | 1 | – | S2 | 100 | 20 ± 0.1 | 298 | 0,443 |
| F | 2 | – | S2 | 89 | 39.7 ± 0.2 | 485 | 0.534 |
| G | 2 | TEOS, DBTDL | S2 | 51 | 36.3 ± 0.3 | 452 | 0.256 |
| H | 3 | – | S2 | 64 | 48.5 ± 0.2 | 488 | 0.470 |
aCalculated as [(m 0 − m p)/m 0] × 100
bCalculated as [m d/(m 0 − m p)] × 100
where: m 0 initial mass of the blend; m p mass of precipitate; m d mass of encapsulated drug
In order to verify the composition of the precipitate, IMC was recovered by extracting with ethanol (PDMS is not soluble). Both gravimetric and spectrophotometric methods (318 nm, in ethanol) methods were used for quantitative evaluation. Slightly higher content in IMC (within 2–5%) was found in the precipitate.
Aliquots (0.1 ml) were withdrawn from the nanoparticle dispersions, which were diluted with ethanol (4 ml) and were assayed spectrophotometrically (318 nm, Analytic Yena SPECORD 200 spectrophotometer). The IMC content in each sample (md) was calculated from the spectral data, and the drug load (DL) was determined as follows (Eq. 2).
| 2 |
Drug Release
Drug release experiments were done using a dialysis membrane cartridge (SnakeSkin tubing, 3500 MW cutoff), which contained 7 ml of water dispersion of nanoparticles. The release medium was 100 ml phosphate buffer (pH 7.4). The system was closed and thermostated at 37°C. At certain time intervals, 4 ml aliquots were withdrawn from the release medium and replaced with the same volume of phosphate buffer. The samples were analyzed by UV–Vis, following the absorption of IMC at 318 nm.
Two mathematical models were used to analyze the drug release: Higuchi (Eq. 3) (18) and Korsmeyer–Peppas (Eq. 4) (19).
| 3 |
| 4 |
where Mt is the amount of drug release at time t, M∞ is the initial amount of drug in the sample, K is the rate constant and n is the release exponent, which characterize the drug release mechanism (20).
After the release experiment, the remaining material was extracted with ethanol repeatedly in order to recover the remaining IMC. The weight balance was verified and gave satisfactory results (around 95%).
RESULTS
Investigation of PDMS–IMC Blends
A series of 5 physical mixtures of PDMS and IMC were obtained in THF, followed by solvent removal (Table I). The resulted blends were analyzed by DSC, in order to investigate the modifications of the main transition temperatures of both components. The thermal behavior of PDMS is followed in the negative temperature range, while in the positive range the IMC transitions are observed.
In Fig. 1, the DSC scans of all the blends in the negative temperature range are presented. It can be observed that, irrespective of the drug load, the PDMS glass transition (Tg) was registered at the same value, i.e. −128°C. The cold crystallization of PDMS was registered around −98°C. The melting temperature was −43.3°C and remained constant for all the samples.
Fig. 1.

DSC investigation in the negative temperature range: first heating scan for neat PDMS and all the blends with IMC
In the positive temperature range, the DSC scan revealed the thermal behavior of indomethacin in the blends (Fig. 2). Compared to the sharp melting endotherm of the pure drug registered at 160°C, characteristic for the γ form, rather important differences were observed in the blends. The melting point shifted to 150°C in most samples, and even 142°C in sample 5, while sample 2 exhibited a polymorphic behavior. Since the blends were obtained from THF solution, a sample of neat IMC was analyzed after dissolving in THF and removing the solvent. An important modification was observed after this treatment: the melting temperature shifted to 154°C, which is characteristic for the α form (21).
Fig. 2.

DSC curves of the PDMS/IMC blends in the positive temperature range. IMC* represents IMC recrystallized from THF
In sample 1, with 20% IMC, neither of the characteristic melting peaks was observed, but only a faint endotherm at about 105°C. In all the DSC curves of the PDMS–IMC blends 2–5, a broad and complex endothermal peak appears, at about 85°C. Also, in all cases, except for sample 1, an exothermal peak was registered at around 110°C.
The FT-IR spectra in the range 1,600–1,800 cm−1 are presented in Fig. 3 for the neat IMC, the indomethacin recrystallized from THF (IMC*) and the blends 1–5. Rather important differences were registered in this spectral range, which characterizes the absorption bands of the carboxylic groups in IMC involved in different types of H-bonding (22).
Fig. 3.

FT-IR spectra (1600–1800 cm−1) of native IMC, IMC* recrystallized from THF and the blends with PDMS
The powder X-ray diffraction spectra are presented in Fig. 4 for IMC, IMC*, and the PDMS blends. The spectra were registered after more than 1 year from preparation of the blends. In order to verify the stability of IMC in time, one of the blends was freshly prepared and analyzed. The comparison between the old and freshly prepared blend 3 is shown in the insert.
Fig. 4.

PXRD spectra of native IMC, IMC* recrystallized from THF (measured after approx. 6 months) and the PDMS–IMC blends measured after more than a year from sample preparation. The insert shows a comparison between old and fresh sample 3
Nanoparticles from PDMS–IMC Blends
The blends containing 20–60% IMC were used to prepare nanoparticles, in aqueous formulations based on siloxane-containing surfactants that we have previously tested in polymer nanoparticle stabilization (Scheme 1).
In the nanoprecipitation process, a certain amount of precipitate resulted in most cases, besides the dispersion of particles (Table II). The best result in terms of nanoparticle yield was obtained with blend 1 having 20% IMC, with both surfactants. Blend 2 also gave a good result, with nanoparticle yield of about 90%.
The composition of the precipitates was verified and found very close to the initial blend composition. The DL of the nanoparticles was assayed from spectrophotometric data (318 nm in ethanol) and is also given in Table II.
In Fig. 5, representative SEM images are shown. Sub-micron particles are observed, which tend to agglomerate in dry state.
Fig. 5.

SEM representative images of the nanoparticles obtained with PDMS/IMC blends: nanoparticles H and G, at different magnification
The particles average diameter (Zave) and polydispersity (PDI) were measured by DLS. The results are summarized in Table II and an example is given in Fig. 6. As can be observed, the particles size was around 200 nm in the case of samples prepared with surfactant S1, and approximately twice larger in the case of surfactant S2. However, nanoparticles of around 300 nm were also obtained with S2 for the blend with low IMC content (NP_E). From the number distribution it was obvious that the particles with diameters of 200–300 nm were the major population in most cases.
Fig. 6.

DLS curve of formulation NP_D
Drug Release
NP_E and NP_F, with 20 and 40% IMC respectively were tested for drug release in phosphate buffer. As can be observed in Fig. 7, similar release profile was obtained. The maximum release was around 30% in NP_E and 20% in NP_F reported to the initial drug amount encapsulated in NP (i.e. 8.2 mg for NP_E and 15.1 mg for NP_F). In Fig. 7b, the cumulative amounts of drug release are shown. It is worth mentioning that the release profile did not change for NP_E after 96 h, while observation stopped for NP_F after 24 h due to partial flocculation.
Fig. 7.

The kinetics of drug release from nanoparticles in phosphate buffer: a % cumulative drug released; b cumulative amount of drug (the initial load was 8.2 mg for NP_E and 15.1 mg for NP_F, respectively in 40 mg of PDMS–IMC)
Both Higuchi (Eq. 1) (18) and Korsmeyer–Peppas (Eq. 2) (19) models were applied for the first portion of the release curves, before the plateau was reached, which means the first 7 h for NP_E and the first 6 h for NP_F. In Table III, the results of the fitting are presented.
Table III.
The Drug Release Kinetics
| Sample | Higuchi | Korsmeyer–Peppas | ||
|---|---|---|---|---|
| K H | R 2 | n | R 2 | |
| NP_E | 11.93 | 0.9343 | 0.5443 | 0.9572 |
| NP_F | 10.973 | 0.9772 | 0.9785 | 0.9595 |
DISCUSSION
It is well known that PDMS is incompatible with most organic materials (23), thus no or poor interaction with the drug within the particles was expected. This aspect was verified in DSC in the negative temperature range, which showed the PDMS glass transition (Tg) at the same value, i.e. −128°C in all samples (Fig. 1). This proves the phase separation between the two components. The cold crystallization is characteristic for PDMS (in this case detected at −99°C in pure PDMS). In samples 1–5, the PDMS crystallization temperature was practically the same as in pure PDMS (variations of 1–2°C).
The melting temperature is an important characteristic of any material, which is directly linked with its purity. The fact that a constant value for the melting temperature of the PDMS matrix was registered irrespective of the drug load comes as an additional indication of the phase separation, due to the incompatibility between the two components.
The thermal behavior of IMC was followed by DSC in the positive temperature range (Fig. 2). For sample 1, with 20% IMC, neither of the characteristic melting endotherms for α or γ form was observed, but only a faint one at about 105°C. Another unusual aspect in the DSC curves of the PDMS–IMC blends is the presence of broad and complex endothermal peaks, at lower temperature (about 85°C). This is not representative for any of the pure components and at first sight it might be due to a polymer–drug complex. In the attempt to assign this behavior, the FT-IR spectra in the range 1,600–1,800 cm−1 were analyzed (Fig. 3).
Based on FT-IR assignments for the carboxylic bands in IMC as reported in (22), the main absorption bands are at 1,734 cm−1 (non-hydrogen bonded acid νC═O), 1,717 cm−1 (asymmetric acid νC═O of a cyclic dimmer), 1,695 cm−1 (benzoyl νC═O) and 1,678 cm−1 (C═O stretch in hydrogen bonding patterns other than cyclic dimmers, this band accompanied by another one at 1,649 cm−1). For the starting IMC, the absorption bands (1,717, 1692 cm−1) are in agreement with those reported for γ crystallization form (22) as confirmed by DSC and PXRD. The FT-IR spectrum of IMC resulted from THF solution, after solvent removal (curve IMC*) exhibits the bands at 1,734 and 1,678 cm−1, as well as that at 1649 cm−1, indicating that most carboxylic groups are not involved in cyclic dimmers. According to (22), this case belongs to α IMC, which was also confirmed by the DSC analysis (Fig. 2) and PXRD data (Fig. 4).
At first sight, the FT-IR spectra of the blends (Fig. 3) are rather similar to IMC* and not IMC. In the case of samples 1–3, the band at 1,734 cm−1 appears as a shoulder, while that at 1,678 is very strong. This indicates that most of the carboxylic groups are involved in H-bonding, forming chains of molecules. At least in theory, the IMC molecules may also associate with the PDMS chain ends, as suggested for IMC-silica gel mixtures (24). In the case of sample 4, the band at 1,735 cm−1 is more pronounced, as well as that at 1,715 cm−1, assigned to the asymmetric acid νC═O of a cyclic dimmer, while the band at 1,678 is seriously diminished. It appears that in this case, part of IMC molecules associate with each other in dimmers rather than in chains. Interestingly, sample 5 with 80% IMC is very similar with samples 1–3, with only a shoulder at 1,735 cm−1.
Judging the FT-IR results in correlation with DSC, one may assign the low temperature endotherm discussed above to an H-bond complex of IMC with PDMS chain ends. This hypothesis holds in all cases, except for sample 4, which exhibits a pronounced peak at 87°C while faint evidence for H-bond other than dimmers was observed in FT-IR. We have also to take into account that the number of OH groups as chain ends is very small compared with the number of the IMC molecules. The most plausible explanation seems to be that PDMS acts as a plasticizer (similar to a solvent) for the IMC molecules, and part of these form a “mixed” phase, which melts at much lower temperature than neat IMC. This phase, which can be regarded as drug dissolved in the polymer matrix, would be also the explanation for the thermal behavior of sample 1. In that case, due to the low drug load, all the IMC molecules are influenced by PDMS and thus the melting of pure IMC is replaced by a melting process at 105°C. Similar DSC results have been reported (25) for methanol or t-butanol IMC solvates after cryogenic grinding.
The exothermal peak that appears in all cases, except for sample 1, at around 110°C, was reported in other studies (26). This might be assigned to the crystallization of the IMC separating from the “mixed” phase after melting.
The PXRD data (Fig. 4) show different features of IMC and IMC*, assigned to γ and α form of indomethacin, respectively (25). Taking into account that IMC* was prepared 6 months before the analysis, this result shows that the α form was stable within this time.
Sample 1 exhibits very low crystallinity, as expected, due to the low IMC content. In sample 2, the peaks at 8.2° 2θ and 14.5° 2θ correspond to α form of indomethacin (IMC*), while other peaks can be assigned to the γ form. In this case, the presence of both polymorphs was indicated by the double melting peak in DSC.
The blends with higher drug load show the main diffraction peaks of the crystalline drug, although the amorphous halo of PDMS is also present. When comparing the spectra with those of IMC and IMC*, most peaks seem to retain the gamma pattern, although slightly shifted. A few peaks might be assigned to the alpha form, like for example: a peak at 18.6° 2θ in IMC* (which does not appear in IMC) can be observed in sample 4 at 18.9° 2θ. In blend 5, the peak at 8.3° 2θ from α indomethacin is also present as a shoulder.
Based on DSC and FT-IR results, α form would offer the best explanation for the behavior of the blends. Considering that PXRD data were collected on samples prepared long time ago (more than a year), the hypothesis of a metastable α form seems plausible.
In order to verify this hypothesis, the blend 3 (which did not exhibit any clear evidence for α polymorph) was freshly prepared and the PXRD spectrum was registered the next day. As can be observed in the insert of Fig. 4, there are few but significant differences between the old and the new sample. The peaks at 18.7 and 24.5° 2θ are from IMC* (the α form). This experiment, together with the fact that IMC* was measured after approx. 6 months, proves that the α form is stable within months timeframe (probably less than a year).
So, the freshly prepared blends contain the α form of the drug, and this could be preserved for a rather long period (roughly between 6 and 12 months). The presence of α phase of indomethacin (which in this case is due to the solvent used) is considered to ensure better biological absorption rate (27).
Based on these data, some brief conclusions can be drawn: (a) IMC crystalline form modifies after dissolution in THF (from γ to α), the α form being stable for at least 6 months; (b) blends with pronounced phase separation were obtained, since the transition temperatures of PDMS were not modified; (c) IMC in the blends is totally (sample with 20% IMC) or partly (samples with ≥40% IMC) dissolved in the polymer matrix, forming a “mixed” phase, which melts at 105°C in sample 1 and around 85°C in the other samples; (d) the samples with high drug loading also contain separated IMC, with melting temperature lower than the α phase, due to the plasticizing effect of PDMS; (e) the PXRD spectra of the blends after more than a year show diffraction peaks of both α and γ forms, as well as the amorphous halo of PDMS.
Knowing the incompatibility of PDMS with organic molecules, the siloxane nature of both the polymer matrix and the hydrophobic part of the surfactant may offer a better compatibilization, thus a better result in terms of particles size and stability. On the other hand, the encapsulation of a crystalline drug into a soft polymer matrix leads to increased dimensional and shape stability, as we observed in the case of polycaprolactone (8).
The PDMS–IMC blends were dissolved in THF and precipitated in diluted aqueous solutions of surfactants. In order to observe the influence of matrix cross-linking, in certain experiments, TEOS (cross-linking agent) and DBTDL (condensation catalyst) were also added to the THF solution prior to precipitation. In this case, according to our previous study (9,10), the PDMS cross-linking reaction occurs within the formed particles.
As can be observed in Table II, the efficiency of the nanoprecipitation process (expressed as nanoparticle yield, NY) decreased with increasing IMC content in the polymer–drug blend. The amount of crystalline drug which is not dissolved in the polymer matrix might be the reason for reduced NY (28). The addition of cross-linking reagents resulted in more pronounced bulk precipitation and thus diminished nanoprecipitation yield. The DL in nanoparticles was found slightly lower than the initial composition, while corresponding higher amount of IMC was found in the bulk precipitate (in the cross-linked particles, the initial content of IMC was calculated taking into account the added reagents). It is worth mentioning that nanoprecipitation was not successful for pure IMC and blend 5 in these experimental conditions. So probably a small amount of drug separates from the blends with high IMC content during the nanoprecipitation process, and precipitates in water without the support of a polymer matrix.
The nanoparticles were observed by SEM and representative images are presented in Fig. 5. The SEM images did not show non-encapsulated drug crystals. The EDX analysis was used to estimate the composition of the particles in NP_G and a separate experiment was conducted on the bulk precipitate from this sample (where IMC crystals could be observed-image not shown). The elements of interest here are Cl from IMC and Si from PDMS and surfactant. The Si content was slightly higher than theoretical even in the bulk precipitate (atomic ratio Si/Cl = 9.66 compared to 8.49 theoretical). The EDX results on the surface of the nanoparticles showed Cl content significantly lower than theoretical, i.e. atomic ratio Si/Cl of 22.7. This result shows that IMC is not located on the surface of the particles, but most probably inside them.
In most cases, high polydispersity index was obtained, which may indicate a tendency of agglomeration. Even though the nanoparticle yield was lower for nanoparticles with cross-linked matrix, the corresponding DLS results showed the smallest PDI values. This narrower distribution indicates that agglomeration is diminished for the particles with better mechanical properties. On the other hand, the DLS measurements were done on filtered samples, thus the very large particles have been removed together with the bulk precipitate.
In order to have an estimation of drug release behavior of these blends in aqueous environment, two of the nanoparticle formulations were investigated for drug release kinetics in phosphate buffer. NP_E and NP_F, with 20% and 40% IMC respectively were chosen, since these blends gave the highest nanoparticle yield, while the Zave values are quite different, as well as the morphology of the starting blends.
Similar release profile was obtained for both samples (Fig. 7). The amount of drug released from a PDMS-based aqueous formulation could thus be tailored by the initial load, taking into account that most of the drug is released in the first 6 or 7 h. The low value of cumulative release is most probably due to the hydrophobicity of the PDMS matrix, which at a certain point precludes the aqueous release medium from being in contact with the drug.
Both the Higuchi (Eq. 1) (18) and Korsmeyer–Peppas (Eq. 2) (19) models can be applied when Mt/M∞ ≤ 60%, as is the case here. According to Higuchi’s model, drug release was described as square root of time (referring to a diffusion process which obeys Fick’s law) (29). In the tested samples, this model gave the best fit for NP_F, whereas NP_E seems to be better described by the Korsmeyer–Peppas equation, with a release exponent n = 0.54. This value indicates that the release mechanism also involves processes other than diffusion. The Korsmeyer–Peppas model was conceived for release from porous hydrophilic polymers (19) and was largely applied for nanoparticle formulations.
Taking into account the afore-announced hypothesis, 20% IMC in PDMS forms a mixed phase, or in other words, this amount of drug (at least) is dissolved in the matrix polymer, while all the samples with ≥40% IMC contain un-dissolved drug. The success of nanoparticle formation might have been influenced by the morphology of the blends, while the release mechanism is most probably a direct consequence. Since for NP_F the drug release is a diffusion process according to Higuchi’s model, the most important amount of drug released has to be the un-dissolved drug, which can diffuse more easily. The “dissolved” IMC is released slower, that is why the cumulative amount of drug released after the same interval from NP_E is lower (i.e., 2.5 mg vs. 3 mg in NP_F) (Fig. 7b).
Judging the encapsulation process, the best results were obtained for samples with 20% IMC (as is the case of NP_E), all the others showing some degree of macroscopic precipitation or flocullation during storage. The observed difference between the two tested samples concerning the release mechanism might be also connected to the stability of the nanoparticles during the release experiment. Indeed, while NP_E remained in a dispersed state during the entire observation time, in sample NP_F flocculation was observed at the end of the experiment. This is probably a consequence of the larger NP dimensions.
It is worth mentioning that PDMS is not commonly used in nanoparticle drug formulations and usually polymers with certain hydrophilicity are preferred. However, due to the known permeability of silicones to various actives, the diffusion driven release is exploited in many applications, from personal care, skin topical applications or wound dressings to implants (3,6). According to literature data (30), more interesting results could be expected for transdermal applications or implantable devices and drug release enhancers can improve the results significantly (7). It was established that hydrophobic polymers are able to release drugs very slowly, thus being efficient in cancer treatment, for example (31). The lack of physical or chemical interactions between the matrix and the drug as well as the propensity for phase separation, are important aspects that have to be taken into account in drug delivery applications involving PDMS.
CONCLUSION
A hydrophobic polymer (PDMS) was used to encapsulate a model AINS drug (IMC). Blends with various compositions were prepared and investigated by FT-IR, DSC, and PXRD. The crystallinity of the drug was modified due to THF used (α polymorph) and preserved after mixing with amorphous PDMS. A plasticizing effect of PDMS was observed, with no chemical or physical bonds between the components. Siloxane-based stabilizers were used to prepare nanoparticles with these blends. Two of the aqueous formulations were tested for drug release in phosphate buffer. Only 20–30% of the drug was released, probably due to the hydrophobicity of PDMS.
ACKNOWLEDGMENTS
This work was partly supported by a grant of the Romanian National Authority for Scientific Research, CNCS–UEFISCDI, project number PN-II-ID-PCCE-2011-2-0028. The author thanks Dr. V. Cozan and Prof. S. Shova for helpful discussions.
REFERENCES
- 1.Habal MB. The biologic basis for the clinical application of the silicones. A correlate to their biocompatibility. Arch Surg. 1984;119(7):843–848. doi: 10.1001/archsurg.1984.01390190081019. [DOI] [PubMed] [Google Scholar]
- 2.Thomas X. Silicone adhesives in healthcare applications. http://www.dowcorning.com/content/publishedlit/52-1057-01.pdf. Accessed 10 Jan 2013.
- 3.Andriot M, Chao SH, Colas A, Cray S, de Buyl F, DeGroot JV, Dupont A, Easton T, Garaud JL, Gerlach E, Gubbels F, Jungk M, Leadley S, Lecomte JP, Lenoble B, Meeks R, Mountney A, Shearer G, Stassen S, Stevens C, Thomas X, Wolf AT. Silicones in industrial applications. In: De Jaeger R, Gleria M, editors. Inorganic Polymers. Nova; 2007. p. 61–161.
- 4.European Centre for Ecotoxicology and Toxicology of Chemicals. Joint Assessment of Commodity Chemicals JACC 055: Linear Polydimethylsiloxanes CAS No. 63148-62-9 (Second Edition). Brussels. 2011.
- 5.Noll W. Chemistry and technology of silicone. New York: Academic; 1968. [Google Scholar]
- 6.Colas A. Silicones in pharmaceutical applications. http://www.dowcorning.com/content/publishedlit/51-993a-01.pdf. Accessed 13 Dec 2012.
- 7.Di Colo G. Controlled drug release from implantable matrices based on hydrophobic polymers. Biomaterials. 1992;13:850–856. doi: 10.1016/0142-9612(92)90178-Q. [DOI] [PubMed] [Google Scholar]
- 8.Racles C, Hamaide T, Ioanid A. Siloxane surfactants in polymer nanoparticles formulation. Appl Organomet Chem. 2006;20:235–245. doi: 10.1002/aoc.1051. [DOI] [Google Scholar]
- 9.Racles C, Cazacu M, Hitruc G, Hamaide T. On the feasibility of chemical reactions in the presence of siloxane-based surfactants. Colloid Polym Sci. 2009;287:461–470. doi: 10.1007/s00396-008-1991-y. [DOI] [Google Scholar]
- 10.Racles C, Alexandru M, Cazacu M, Ioanid A, Hamaide T. Obtention des elastomeres silicones en nanoreacteurs siloxane-organiques. Rev Roum Chim. 2009;54:583–588. [Google Scholar]
- 11.Hadgraft J, Plessis J, Goosen C. The selection of NSAIDs for dermal delivery. Int J Pharm. 2000;207:31–37. doi: 10.1016/S0378-5173(00)00517-2. [DOI] [PubMed] [Google Scholar]
- 12.Cordero J, Camacho M, Obach R, Domenench J, Vila L. In vitro based index of topical anti-inflammatory activity to compare a series of NSAIDs. Eur J Pharm Biopharm. 2001;51:135–142. doi: 10.1016/S0939-6411(00)00149-1. [DOI] [PubMed] [Google Scholar]
- 13.Rhee Y, Choi J, Park E, Chi S. Transdermal delivery of ketoprofen using microemulsions. Int J Pharm. 2001;228:161–170. doi: 10.1016/S0378-5173(01)00827-4. [DOI] [PubMed] [Google Scholar]
- 14.Kawashima Y. Nanoparticulate systems for improved drug delivery. Adv Drug Del Rev. 2001;47:1–2. doi: 10.1016/S0169-409X(00)00117-4. [DOI] [PubMed] [Google Scholar]
- 15.Panyam J, Labhasetwar V. Biodegradable nanoparticle from drug and gene delivery to cells and tissue. Adv Drug Del Rev. 2003;55:329–347. doi: 10.1016/S0169-409X(02)00228-4. [DOI] [PubMed] [Google Scholar]
- 16.Petros RA, DeSimone JM. Strategies in the design of nanoparticles for therapeutic applications. Nature Reviews: Drug Discovery. 2010;9:615–627. doi: 10.1038/nrd2591. [DOI] [PubMed] [Google Scholar]
- 17.Racles C. Siloxane-based surfactants containing tromethamol units. Soft Materials. 2010;8:1–11. doi: 10.1080/1539445X.2010.495627. [DOI] [Google Scholar]
- 18.Higuchi T. Mechanism of sustained-action medication. Theoretical analysis of rate of release of solid drugs dispersed in solid matrices. J Pharm Sci. 1963;52:1145–1149. doi: 10.1002/jps.2600521210. [DOI] [PubMed] [Google Scholar]
- 19.Korsmeyer RW, Gurny R, Doelker E, Buri P, Peppas NA. Mechanisms of solute release from porous hydrophilic polymers. Int J Pharm. 1983;15:25–35. doi: 10.1016/0378-5173(83)90064-9. [DOI] [PubMed] [Google Scholar]
- 20.Ritger PL, Peppas NA. A simple equation for description of solute release I. Fickian and non-Fickian release from non-swellable devices in the form of slabs, spheres, cylinders or discs. J Control Release. 1987;5:23–26. doi: 10.1016/0168-3659(87)90034-4. [DOI] [PubMed] [Google Scholar]
- 21.Martena V, Censi R, Hoti E, Malaj L, Di Martino P. Indomethacin nanocrystals prepared by different laboratory scale methods: effect on crystalline form and dissolution behavior. J Nanopart Res. 2012;14:1275. doi: 10.1007/s11051-012-1275-9. [DOI] [Google Scholar]
- 22.Taylor LS, Zografi G. Spectroscopic characterization of interactions between PVP and indomethacin in amorphous molecular dispersions. Pharm Res. 1997;14:1691–1698. doi: 10.1023/A:1012167410376. [DOI] [PubMed] [Google Scholar]
- 23.Yilgor I, McGrath JE. Polysiloxane containing copolymers: a survey of recent developments. Adv Polym Sci. 1988;86:1–87. doi: 10.1007/BFb0025274. [DOI] [Google Scholar]
- 24.Pan X, Julian T, Augsburger L. Quantitative measurement of indomethacin crystallinity in indomethacin-silica gel binary system using differential scanning calorimetry and X-ray powder diffractometry. AAPS PharmSciTech. 2006;7(1):11. doi: 10.1208/pt070111. [DOI] [PMC free article] [PubMed] [Google Scholar]
- 25.Crowley KJ, Zografi G. Cryogenic grinding of indomethacin polymorphs and solvates: assessment of amorphous phase formation and amorphous phase physical stability. J Pharm Sci. 2002;91:492–507. doi: 10.1002/jps.10028. [DOI] [PubMed] [Google Scholar]
- 26.Greco K, Bogner R. Crystallization of amorphous indomethacin during dissolution: effect of processing and annealing. Mol Pharm. 2010;7:1406–1418. doi: 10.1021/mp1000197. [DOI] [PubMed] [Google Scholar]
- 27.Qi C, Xia X, Zhang W, Xie C, Cai S. Indomethacin/Cu/LDPE porous composite for medicated copper intrauterine devices with controlled release performances. Compos Sci Technol. 2012;72:428–434. doi: 10.1016/j.compscitech.2011.12.004. [DOI] [Google Scholar]
- 28.Bodmeier R, Chen H. Indomethacin polymeric nanosuspensions prepared by microfluidization. J Contr Release. 1990;12:223–233. doi: 10.1016/0168-3659(90)90103-Z. [DOI] [Google Scholar]
- 29.Raval A, Parikha J, Engineer C. Dexamethasone eluting biodegradable polymeric matrix coated stent for intravascular drug delivery. Chem Eng Res Des. 2010;88:1479–1484. doi: 10.1016/j.cherd.2010.03.007. [DOI] [Google Scholar]
- 30.Dash AK, Suryanarayanan R. An implantable dosage form for the treatment of bone infections. Pharm Res. 1992;9:993–1002. doi: 10.1023/A:1015842108772. [DOI] [PubMed] [Google Scholar]
- 31.Yohe ST, Colson YL, Grinstaff MW. Superhydrophobic materials for tunable drug release: using displacement of air to control delivery rates. J Am Chem Soc. 2012;134:2016–2019. doi: 10.1021/ja211148a. [DOI] [PMC free article] [PubMed] [Google Scholar]