

Abstract
Background
Evidence regarding all-cause and cause-specific mortality in inflammatory bowel disease (IBD) is conflicting, and debate exists over appropriate study design to examine these important outcomes. We conducted a comprehensive meta-analysis of all-cause and cause-specific mortality in both Crohn’s disease (CD) and ulcerative colitis (UC), and additionally examined various effects of study design on this outcome.
Methods
A systematic search of PubMed and EMBASE was conducted to identify studies examining mortality rates relative to the general population. Pooled summary standardized mortality ratios (SMR) were calculated using random effect models.
Results
Overall, 35 original articles fulfilled the inclusion and exclusion criteria, reporting all-cause mortality SMRs varying from 0.44 to 7.14 for UC and 0.71 to 3.20 for CD. The all-cause mortality summary SMR for inception cohort and population cohort UC studies was 1.19 (95% confidence interval, 1.06–1.35). The all-cause mortality summary SMR for inception cohort and population cohort CD studies was 1.38 (95% confidence interval, 1.23–1.55). Mortality from colorectal cancer, pulmonary disease, and nonalcoholic liver disease was increased, whereas mortality from cardiovascular disease was decreased.
Conclusions
Patients with UC and CD have higher rates of death from all causes, colorectal-cancer, pulmonary disease, and nonalcoholic liver disease.
Keywords: inflammatory bowel disease, ulcerative colitis, Crohn’s disease, mortality, meta-analysis
Inflammatory bowel disease (IBD), encompassing Crohn’s disease (CD) and ulcerative colitis (UC), is a chronic intestinal inflammatory disease. Because of the chronic and sometimes severe nature of this disease, there is an obvious need to elucidate both all-cause and cause-specific mortality, as this has important implications for patients and more globally for issues such as public health planning.
Meta-analysis is a statistical methodology for combining similar studies to obtain a more precise effect estimate. Previous meta-analyses examining mortality in IBD have come to inconsistent conclusions, perhaps because of different inclusion criteria (Table 1).1-4
TABLE 1.
Previous Meta-analyses of IBD Mortality
| IBD Type | Included Studies (Publication Year) | Outcomes | SMR (95% CI) | |
|---|---|---|---|---|
| Canavan et al1 | CD | All study types (1980–2004) | All-cause mortality | 1.52 (1.3–1.7) |
| Dorn et al2 | CD | All study types (1981–2006) | Cardiovascular mortality | 1.0 (0.8–1.1) |
| UC | 0.9 (0.8–1.0) | |||
| Jess et al3 | UC | Inception cohort studies (1982–2005) | All-cause mortality | 1.1 (0.9–1.2) |
| CRC mortality | 1.9 (1.0–3.8) | |||
| Cardiovascular mortality | 0.9 (0.7–1.1) | |||
| Respiratory disease mortality | 1.6 (1.3–2.0) | |||
| Non-alcoholic liver disease mortality | 4.0 (2.5–6.5) | |||
| Duricova et al4 | CD | Population-based studies | All-cause mortality | 1.39 (1.3–1.5) |
| All-cause cancer mortality | 1.50 (1.2–1.9) | |||
| Pulmonary cancer mortality | 2.72 (1.4–5.5) | |||
| Malignant melanoma mortality | 10.0 (1.2–36.1) | |||
| CRC mortality | 1.3 (0.5–3.3) | |||
| Pulmonary mortality | 1.4 (0.7–2.2) |
Specifically, some meta-analyses have included only population-based studies, others only inception cohorts, and none of the recent meta-analyses have included referral center–based studies. Furthermore, many focused only on all-cause mortality, neglecting specific causes of death, which are critical information if one is to plan interventions to reduce IBD-related mortality.
Therefore, we undertook a meta-analysis of all-cause mortality and cause-specific mortality related to colorectal cancer (CRC), nonalcoholic liver disease, pulmonary disease, and cardiovascular disease in both UC and CD. Additionally, we sought to determine how results of population-based studies, inception cohorts, and single-center or multicenter studies vary.
MATERIALS AND METHODS
Search Strategy
To identify published studies on this topic, a systematic search of PubMed was performed on November 12, 2011. The search used the key words and MESH headings inflammatory bowel disease or ulcerative colitis or Crohn’s disease combined with colorectal cancer or colon cancer or rectal cancer or pulmonary disease or cardiovascular disease or hepatic disease or mortality or death or survival. A comprehensive search of reference lists in previous meta-analyses and original studies retrieved by this method was performed to identify additional reports. This approach identified 15,577 articles published between 1941 and 2011. Application of the limitations “English language journal papers” and “human studies” yielded 11,234 articles for analysis (Figure 1). A search of EMBASE using the same key words and MESH headings was performed, and no additional appropriate articles were identified.
FIGURE 1.
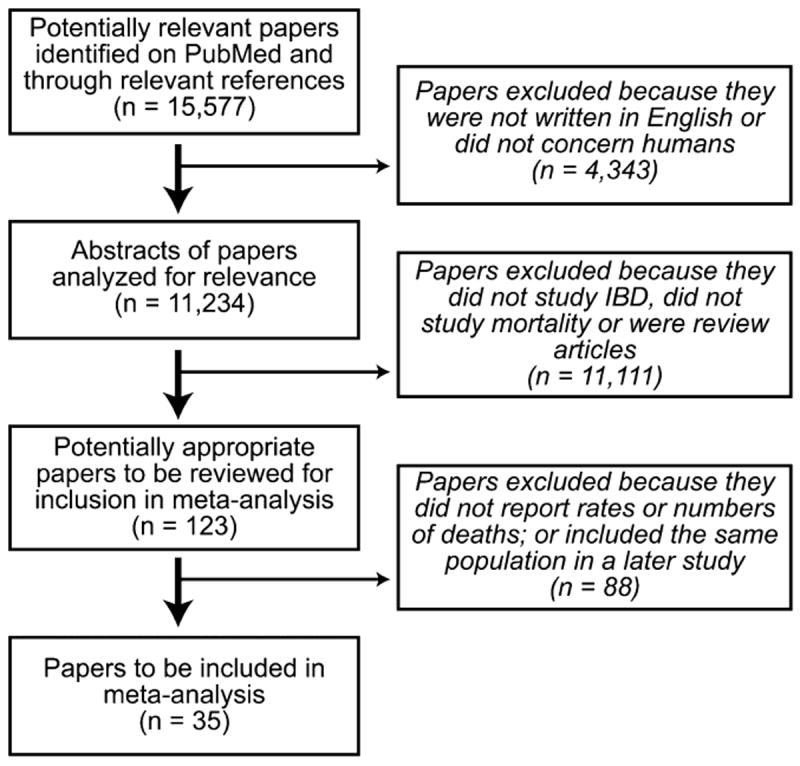
Identification of studies for meta-analysis.
Inclusion and Exclusion Criteria
Only full-length peer-reviewed English language or English-translated articles reporting observational study results were included to allow full evaluation of the study methods and results (such as study inclusion criteria, follow-up time, specific details of how cause-specific mortality was determined, methods of ascertainment of data, and calculation of outcome measures). All-cause and/or cause-specific mortality had to be reported as standardized mortality ratio (SMR), relative risk (RR), incidence rate ratio, hazard ratio, or odds ratio with or without 95% confidence intervals (95% CIs). When 2 or more publications were reported on the same patient population, only the most recent study results were included. Application of these criteria resulted in 35 original articles for analysis (Figure 1).
Data Collection
Included articles were reviewed in detail by 2 reviewers (M.B. and either L.K. or J.D.L.; discrepancies were decided by concensus and if necessary by the third reviewer J.D.L.) to determine the number of patients, gender distribution, number of UC and CD patients, calendar year of publication, decade of the middle year of patient observation, mortality rates and/or observed and expected numbers of deaths, 95% CIs, region of IBD population, type of study population, and study design. In 2 studies, a lower 95% CI of 0.0 was reported.5,6 To allow this to be included in the summary calculations, we approximated the lower bound to 0.025 (i.e., the midpoint between 0 and 0.049).
Studies were categorized into the following groups based on the source of the study population: single-center or multicenter study if all patients observed came from the same center or group of physicians; population-based study if the IBD population was identified within a defined geographic area; or inception cohort if it was explicitly stated that patients received their initial IBD diagnosis during their time within the cohort, or if the study explicitly stated that it was a population-based inception cohort.
Statistical Analysis
The outcome of interest was the relative mortality rate as compared with the general population and respective 95% CIs. In the event that 95% CIs were not calculated but observed and expected values were given, 95% CIs were calculated using the Rothman–Greenland method. Because all but one study reported results in terms of the SMR, we used this as our summary measure of RR. Pooled SMRs with 95% CI for all-cause and cause-specific mortality were calculated using the metan command of STATA, which uses the DerSimonian and Laird method, a random-effects model that incorporates both between-study and within-study variation.
Statistical heterogeneity was assessed in 2 ways. First, the I2 index and χ2 test were used to investigate differences among studies with respect to SMRs. Additionally, subgroup analyses were performed to assess potential sources of heterogeneity separately as a result of the following available patient-level and study-level factors: region of study, study type, and decade of the middle year of patient observation. Meta-regression analysis was also performed for heterogeneity of the all-cause SMR because of cohort size and middle year of patient observation. Cumulative meta-analysis was performed to examine all-cause mortality. Funnel plots of the log SMR versus its standard error were performed to assess for publication bias for analyses with 5 or more studies. Begg’s rank correlation method and Egger’s regression were used to test the correlation between effect and sample size.
Ethical Considerations
The study protocol was reviewed by the Institutional Review Board at the University of Pennsylvania and met the criteria for exempt status.
RESULTS
Study Characteristics
A total of 35 studies were included, of which 10 were inception cohorts, 13 were population-based cohort studies, 8 were single-center studies, and 4 were multicenter studies (Table 2). These studies included all studies used in previous meta-analyses excluding 1 abstract used in a meta-analysis by Jess et al3 and 1 study used in the meta-analysis by Canavan et al1 for which data were not available.40
TABLE 2.
Studies Included in Meta-analysis
| Study | Location | Median Follow-up (mo) | Study Source | Population Size | Mortality Studied |
|---|---|---|---|---|---|
| Romberg-Camps et al6 | Netherlands | 67.2-93.6 | Inception cohort | UC: 630 | All cause |
| CD: 476 | CV | ||||
| Pulmonary | |||||
| Solberg et al7 | Norway | Not reported | Inception cohort | UC: 519 | All cause |
| CD: 237 | |||||
| Jess et al8 | Denmark | Not reported | Inception cohort | UC: 1575 | All cause |
| CD: 641 | |||||
| Hoie et al9 | EC-IBD | 35 | Inception cohort | UC: 775 | All cause |
| CV | |||||
| Pulmonary | |||||
| Jess et al10 | North America | 168 | Inception cohort | UC: 378 | All cause |
| CD: 314 | CV | ||||
| Pulmonary | |||||
| Wolters et al11 | EC-IBD | 372 | Inception cohort | CD: 371 | All cause |
| CV | |||||
| Pulmonary | |||||
| Winther et al12 | Denmark | 228 | Inception cohort | UC: 1160 | All cause |
| CRC | |||||
| CV | |||||
| Pulmonary | |||||
| Liver | |||||
| Jess et al13 | Denmark | 204 | Inception cohort | CD: 374 | All causea |
| CV | |||||
| Pulmonary | |||||
| Farrokhyar et al14 | United Kingdom | 99.6 | Inception cohort | UC: 365 | All cause |
| CD: 196 | |||||
| Persson et al15 | Sweden | Not reported | Inception cohort | UC: 1547 | All cause |
| CRC | |||||
| CD: 1251 | CV | ||||
| Pulmonary | |||||
| Liver | |||||
| Card et al16 | United Kingdom | Not reported | Population- based | UC: 8301 | All cause |
| CD: 5960 | |||||
| Masala et al17 | Italy | 177.6 | Population cohort | UC: 689 | All cause |
| CD: 231 | CRC | ||||
| CV | |||||
| Ishibashi et al18 | Japan | 192 (UC) 188.4 (CD) | Population cohort | UC: 174 | All cause |
| CD 66 | CRC | ||||
| Saro Gismera et al19 | Spain | Not reported | Population cohort | UC: 261 | All cause |
| CD: 259 | |||||
| Palli et al20 | Italy | 121.2 | Population cohort | UC: 689 | All causeb |
| CRC | |||||
| CD: 231 | CV | ||||
| Pulmonary | |||||
| Stewenius et al21 | Sweden | Not reported | Population cohort | UC: 462 | All cause |
| Pulmonary | |||||
| Probert et al22 | United Kingdom | Not reported | Population cohort | UC: 1014 | All cause |
| Ekbom et al23 | Sweden | Not reported | Population cohort | UC: 3121 | All cause |
| CRC | |||||
| CV | |||||
| CD: 1655 | Pulmonary | ||||
| Hepatology | |||||
| Probert et al24 | United Kingdom | Not reported | Population cohort | CD: 610 | All cause |
| Gilat et al25 | Israel | 93.6 | Population cohort | UC: 504 | All cause |
| Iversen et al26 | Denmark | Not reported | Population cohort | UC: 231 | All cause |
| Hutfless et al27 | North America | 81.6 | Population-based | UC: 5238 | All cause |
| CRC | |||||
| CD: 3241 | CV | ||||
| Pulmonary | |||||
| Hepatic | |||||
| Canavan et al28 | United Kingdom | 288 | Population-based | CD: 394 | All cause |
| Uno et al29 | Japan | Not reported | Multicenter | CD: 544 | All cause |
| CRC | |||||
| Viscido et al5 | Italy | 73.2 | Multicenter | UC: 2066 | All cause |
| CRC | |||||
| CV | |||||
| Pulmonary | |||||
| Liver | |||||
| Gyde et al30 | United Kingdom | 189.6 | Multicenter | UC: 676 | All cause |
| CV | |||||
| Pulmonary | |||||
| Eason et al31 | New Zealand | 72 | Multicenter | UC: 456 | All cause |
| CD: 137 | CRC | ||||
| CV | |||||
| Park et al32 | Korea | 62.5 | Single center | UC: 304 | All cause |
| Delaunoit et al33 | North America | Not reported | Single center | UC: 249 | CRC |
| CD: 49 | |||||
| Katoh et al34 | Japan | Not reported | Single center | UC: 117 | All cause |
| Davoli et al35 | Italy | 60 | Single center | UC: 508 | All cause |
| CV | |||||
| Cottone et al36 | Southern Europe | 93.6 | Single center | CD: 531 | All cause |
| CRC | |||||
| Weterman et al37 | Netherlands | Not reported | Single center | CD: 671 | All cause |
| Prior et al38 | United Kingdom | Not reported | Single center | CD: 513 | All cause |
| CV | |||||
| Pulmonary | |||||
| Ritchie et al39 | United Kingdom | Not reported | Single center | UC: 269 | All cause |
Given more recent all-cause mortality rates for this population,8 only pulmonary and cardiovascular mortality was used in the current study.
Given more recent all-cause, CRC and CV mortality rates for this population,17 only pulmonary mortality was used in the current study.
CV, cardiovascular; EC-IBD, European Collaborative Study Group of Inflammatory Bowel Disease.
Overall, there were 32,269 patients with CD and 18,952 patients with UC. The year of publication ranged from 1968 to 2010. The median duration of follow-up (when provided) was 83.4 months for UC and 204 months for CD.
All-Cause Mortality
The reported SMRs for all-cause mortality in patients with UC ranged from 0.44 (95% CI, 0.12–1.12) to 7.14 (95% CI, 1.47–20.70).19,32 The all-cause mortality summary SMR for UC was 1.16 (95% CI, 1.04–1.29) (Table 3). When combining inception cohort and population-based studies, the all-cause mortality summary SMR for UC was 1.19 (95% CI, 1.06–1.35).
TABLE 3.
Standardized Mortality Ratios
| Summary SMR | L95% | U95% | I2 | Het P | No. of Studies | |
|---|---|---|---|---|---|---|
| Overall: UC | 1.16 | 1.04 | 1.29 | 84% | 0.00 | 25 |
| Overall: CD | 1.46 | 1.30 | 1.63 | 71% | 0.00 | 19 |
| CRC: UC | 2.82 | 1.68 | 4.74 | 80% | 0.00 | 7 |
| CRC: CD | 3.12 | 0.97 | 10.10 | 73% | 0.00 | 6 |
| Cardiovascular disease: UC | 0.90 | 0.80 | 1.02 | 39% | 0.09 | 11 |
| Cardiovascular disease: CD | 1.00 | 0.88 | 1.13 | 0.0% | 0.73 | 9 |
| Pulmonary disease: UC | 1.41 | 1.12 | 1.77 | 39% | 0.10 | 10 |
| Pulmonary disease: CD | 1.60 | 1.24 | 2.05 | 0.0% | 0.43 | 8 |
| Nonalcoholic liver disease: UC | 2.26 | 1.14 | 4.49 | 55% | 0.06 | 5 |
| Nonalcoholic liver disease: CD | 2.82 | 1.52 | 5.21 | 0.0% | 0.63 | 3 |
The reported SMRs for all-cause mortality in patients with CD ranged from 0.71 (95% CI, 0.51–1.01) to 3.20 (95% CI, 0.38–11.50).19,24 The all-cause mortality summary SMR for CD was 1.46 (95% CI, 1.30–1.63) (Table 3). When combining inception cohort and population-based studies, the all-cause mortality summary SMR for CD was 1.38 (95%, CI 1.23–1.55).
There was significant heterogeneity in the all-cause summary SMR across the levels of patient-level and study-level factors for both UC and CD (Table 4). Twelve studies reported on gender-specific overall mortality for UC and CD, with a possible trend toward higher relative mortality in females (Table 4). However, there remained significant among-study heterogeneity when examining men and women separately.
TABLE 4.
All-Cause SMRs
| Pooled ES | L95% | U95% | I2 | Het P | No. of Studies | |
|---|---|---|---|---|---|---|
| UC | ||||||
| Men | 1.10 | 0.94 | 1.28 | 56% | 0.01 | 12 |
| Women | 1.29 | 1.01 | 1.64 | 76% | 0.00 | 12 |
| CD | ||||||
| Men | 1.32 | 1.11 | 1.57 | 55% | 0.01 | 12 |
| Women | 1.63 | 1.38 | 1.93 | 57% | 0.01 | 12 |
| UC: all cause | ||||||
| North America | 0.92 | 0.74 | 1.14 | 55% | 0.14 | 2 |
| United | 1.21 | 0.96 | 1.54 | 86% | 0.00 | 5 |
| Kingdom | ||||||
| North Europe | 1.23 | 1.10 | 1.40 | 79% | 0.00 | 8 |
| South Europe | 1.01 | 0.69 | 1.49 | 80% | 0.00 | 4 |
| Other countries | 1.14 | 0.65 | 2.01 | 76% | 0.00 | 5 |
| EC-IBD | 1.09 | 0.86 | 1.38 | — | — | 1 |
| CD: all cause | ||||||
| North America | 1.36 | 1.19 | 1.54 | 0% | 0.35 | 2 |
| United | 1.30 | 0.99 | 1.72 | 90% | 0.00 | 5 |
| Kingdom | ||||||
| North Europe | 1.54 | 1.29 | 1.84 | 73% | 0.01 | 5 |
| South Europe | 1.62 | 1.23 | 2.14 | 0% | 0.62 | 3 |
| Other countries | 1.29 | 0.72 | 2.33 | 0% | 0.89 | 3 |
| EC-IBD | 1.85 | 1.30 | 2.55 | — | — | 1 |
| UC: all cause | ||||||
| Inception | 1.08 | 0.97 | 1.21 | 67% | 0.00 | 8 |
| Population | 1.32 | 1.07 | 1.63 | 90% | 0.00 | 10 |
| Single center | 1.03 | 0.77 | 1.38 | 22% | 0.28 | 4 |
| Multicenter | 1.16 | 0.73 | 1.83 | 90% | 0.00 | 3 |
| All studies | 1.16 | 1.04 | 1.29 | 84% | 0.00 | 25 |
| CD: all cause | ||||||
| Inception | 1.34 | 1.15 | 1.56 | 49% | 0.08 | 6 |
| Population | 1.39 | 1.18 | 1.64 | 77% | 0.00 | 8 |
| Single center | 2.06 | 1.78 | 2.38 | 0% | 0.68 | 3 |
| Multicenter | 1.25 | 0.67 | 2.32 | 0% | 0.67 | 2 |
| All studies | 1.46 | 1.30 | 1.63 | 71% | 0.00 | 19 |
| UC: all cause | ||||||
| Decade 2000s | 0.44 | 0.12 | 1.12 | — | — | 1 |
| Decade 1990s | 1.04 | 0.83 | 1.31 | 90% | 0.00 | 6 |
| Decade 1980s | 1.05 | 0.99 | 1.12 | 0% | 0.77 | 7 |
| Decade 1970s | 1.21 | 1.01 | 1.45 | 74% | 0.00 | 8 |
| Decade 1960s | 2.26 | 1.79 | 2.86 | 0% | 0.42 | 2 |
| Decade 1950s | 1.70 | 1.48 | 2.06 | — | — | 1 |
| CD: all cause | ||||||
| Decade 2000s | NS | NS | NS | NS | NS | 0 |
| Decade 1990s | 1.54 | 1.32 | 1.79 | 54% | 0.07 | 5 |
| Decade 1980s | 1.14 | 0.84 | 1.55 | 62% | 0.02 | 6 |
| Decade 1970s | 1.42 | 1.27 | 1.59 | 35% | 0.18 | 6 |
| Decade 1960s | 2.09 | 1.79 | 2.43 | 0% | 0.49 | 2 |
| Decade 1950s | — | — | — | — | — | 0 |
NS, no studies.
Numbers of studies reporting from respective regions of the world: North America (3); United Kingdom (8); Northern Europe (9); Southern Europe (6); Other Regions (6); European Collaborative Study Group of Inflammatory Bowel Disease (EC-IBD) (2). Decade refers to decade of the middle year of patient observation in study.
Meta-regression was performed to explore evidence that between-study heterogeneity could be because of the cohort size or decade of the middle year of patient observation, 2 variables universally available in all studies. For all-cause mortality in UC and CD, the SMR was not associated with cohort size (P = 0.71 and P = 0.43, respectively) or decade of middle year of patient observation (P = 0.06 and P = 0.28, respectively).
Subgroup analyses were performed stratified by geographic region (Table 4). Despite the reduced number of studies, there remained significant heterogeneity in most of the regional subgroup analyses for all-cause mortality.
Study Type
Figure 2 shows the similarity of the population-based studies and inception cohort studies examining all-cause mortality in UC. Inception cohort, single-center, and multicenter studies all showed nonsignificant SMRs of similar elevated magnitude (summary SMRs, 1.08 [95% CI, 0.97–1.21], 1.03 [95% CI, 0.77–1.38], and 1.16 [95% CI, 0.73–1.83], respectively). A significantly elevated SMR was observed for population-based studies (summary SMR, 1.32; 95% CI, 1.07–1.63) (Table 4). However, this estimate fell within the range of mortality estimates for other study types, and there remained significant heterogeneity within the subgroup of population-based studies (Table 4 and Figure 2). Therefore, heterogeneity of the all-cause mortality summary estimate could not be accounted for by study type for UC.
FIGURE 2.
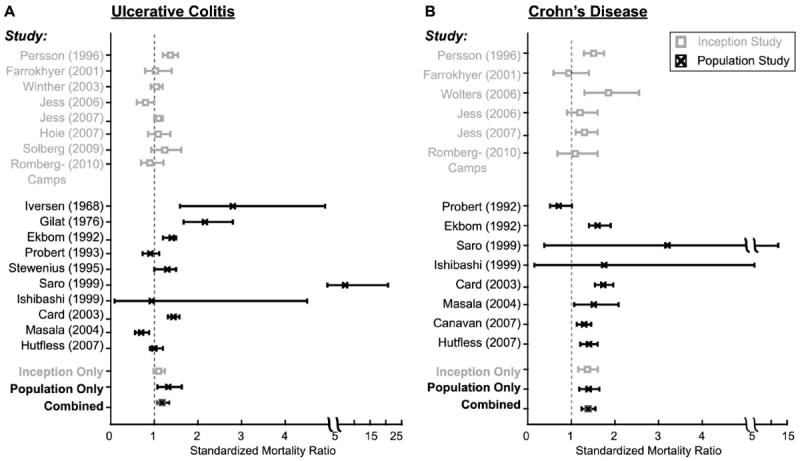
SMRs for UC (A) and CD (B). The SMR from individual trials is denoted with inception cohort studies in gray and population cohort studies in black. Horizontal bars represent 95% CIs. The final 3 values represent the overall all-cause SMR for inception cohort studies, population cohort studies, or inception and population cohort studies combined.
For all-cause mortality in CD, higher SMRs were reported in single-center studies than for inception or population-based studies (summary SMRs, 2.06 [95% CI, 1.78–2.38], 1.34 [95% CI, 1.15–1.56], and 1.39 [95% CI, 1.18–1.64], respectively). Multicenter studies had a nonsignificant all-cause summary SMR of 1.25 (95% CI, 0.67–2.32). These data suggest that heterogeneity among CD studies was partly explained by inclusion of single-center studies. However, significant heterogeneity remained in the inception and population-based studies (P = 0.08 and P ≤ 0.01, respectively).
Cumulative meta-analysis was performed to examine how the summary mortality estimate for all-cause mortality in UC and CD changed with successive published inception and inception plus population-based cohort studies (Figure 3). For UC, the dates of inception cohort studies ranged from 1996 to 2010, and from 1968 to 2009 for population-based cohort studies. The summary mortality estimate for both study cohort types was attenuated over time (Figure 3). In the inception cohort–only studies, the summary mortality estimate became nonsignificant over time (SMR, 1.08; 95% CI, 0.97–1.21). The addition of population cohort studies yielded a very similar summary estimate that remained slightly elevated over time (SMR, 1.17; 95% CI, 1.04–1.32). Additional cumulative meta-analysis was performed removing the studies from 1968 and 1976, and the resulting dates of studies ranged from 1992 to 2010. The summary all-cause mortality estimates remained very similar to that of inception cohort–only studies (SMR, 1.10; 95% CI, 0.99–1.23).
FIGURE 3.
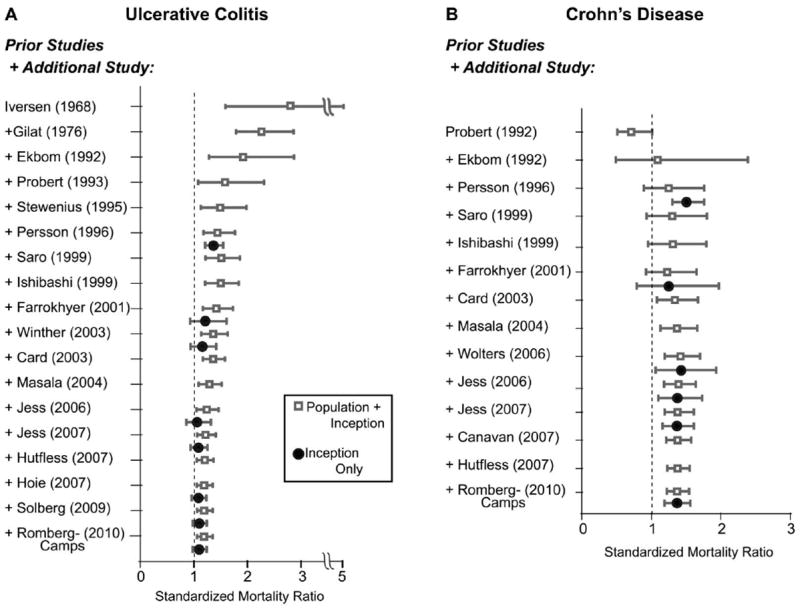
Cumulative meta-analysis of all-cause mortality. The cumulative SMR is shown for UC (A) and CD (B). Each entry represents the cumulative SMR for the study listed combined with all previous studies above the entry. The cumulative SMR from inception cohort studies only are in black closed circles, whereas the results from population-plus-inception cohort studies are given by gray open squares. Horizontal bars represent 95% CIs.
For CD, inception cohort–only studies ranged from 1996 to 2010; with the addition of population cohort studies, the dates of the studies ranged from 1992 to 2010 (Figure 3). The summary mortality estimate for all-cause mortality remained fairly constant over time for both inception cohort studies alone and inception plus population cohort studies (SMR, 1.34; 95% CI, 1.15–1.56 and SMR, 1.37; 95% CI, 1.22–1.53, respectively).
Analysis of Cause-Specific Mortality
Significantly elevated SMRs for CRC, pulmonary disease, and nonalcoholic liver disease were observed in UC, and significantly elevated SMRs for pulmonary disease and nonalcoholic liver disease were observed in CD (Table 3). However, for patients with UC and CD, the SMR for cardiovascular disease–related mortality was not significant; and for patients with CD, the SMR for CRC mortality was not significant, although there seemed to be a trend towards significance. Significant heterogeneity was observed for CRC-related mortality in UC and CD. There was borderline heterogeneity for hepatic disease–related and cardiovascular disease–related mortality in UC (Table 3). Because of the small number of studies, all study types were included in cause-specific mortality analysis (Table 3), and only qualitative comparisons were made across geographic region or study type for cause-specific mortality (Table 5). Differences in definitions of cause-specific mortality are summarized in Table 6.
TABLE 5.
Cause-Specific Standardized Mortality Estimates
| Summary SMR | L95% | U95% | I2 | Heterogeneity P | No. of Studies | |
|---|---|---|---|---|---|---|
| UC | ||||||
| CRC: men | 1.80 | 1.04 | 3.12 | 0.0% | 0.36 | 2 |
| CRC: women | 0.73 | 0.26 | 2.04 | 0.0% | 0.59 | 2 |
| Cardiovascular disease: men | 0.93 | 0.69 | 1.24 | 41% | 0.13 | 6 |
| Cardiovascular disease: women | 0.93 | 0.69 | 1.25 | 21% | 0.28 | 6 |
| Pulmonary disease: men | 1.13 | 0.59 | 2.17 | 46% | 0.12 | 5 |
| Pulmonary disease: women | 1.55 | 1.07 | 2.26 | 0.0% | 0.87 | 4 |
| Nonalcoholic liver disease: men | NS | |||||
| Nonalcoholic liver disease: women | 1.67 | 0.04 | 9.28 | — | — | 1 |
| CD | ||||||
| CRC: men | 3.50 | 1.64 | 7.45 | — | — | 1 |
| CRC: women | NS | NS | NS | NS | NS | NS |
| Cardiovascular disease: men | 0.87 | 0.61 | 1.25 | 0.0% | 0.82 | 5 |
| Cardiovascular disease: women | 1.22 | 0.70 | 2.11 | 53% | 0.08 | 5 |
| Pulmonary disease: men | 1.54 | 0.91 | 2.63 | 0.0% | 0.62 | 5 |
| Pulmonary disease: women | 2.054 | 1.408 | 2.997 | 0.0% | 0.56 | 5 |
| Nonalcoholic liver disease: men | NS | NS | NS | NS | NS | NS |
| Nonalcoholic liver disease: women | 3.60 | 1.00 | 9.20 | — | — | 1 |
| UC: CRC | ||||||
| North America | 1.60 | 0.90 | 2.80 | — | — | 1 |
| United Kingdom | NS | NS | NS | NS | NS | NS |
| North Europe | 2.60 | 1.27 | 5.29 | 79.4% | 0.01 | 3 |
| South Europe | 2.31 | 0.87 | 6.09 | 54.7% | 0.14 | 2 |
| Other countries | 9.93 | 4.67 | 17.3 | — | — | 1 |
| EC-IBD | NS | NS | NS | NS | NS | NS |
| UC: Cardiovascular disease | ||||||
| North America | 0.76 | 0.52 | 1.13 | 65.9% | 0.09 | 2 |
| United Kingdom | 0.70 | 0.45 | 1.10 | — | — | 1 |
| North Europe | 1.01 | 0.90 | 1.15 | 16.9% | 0.31 | 4 |
| South Europe | 0.72 | 0.56 | 0.93 | 0.0% | 0.79 | 3 |
| Other countries | NS | NS | NS | NS | NS | NS |
| EC-IBD | 1.07 | 0.71 | 1.54 | — | — | 1 |
| UC: Pulmonary disease | ||||||
| North America | 1.15 | 0.84 | 1.59 | 0.0% | 0.56 | 2 |
| United Kingdom | 0.80 | 0.36 | 1.60 | — | — | 1 |
| North Europe | 1.64 | 1.34 | 2.00 | 0.0% | 0.57 | 5 |
| South Europe | 0.18 | 0.00 | 1.10 | — | — | 1 |
| Other countries | NS | NS | NS | NS | NS | NS |
| EC-IBD | 2.01 | 1.00 | 3.60 | — | — | 1 |
| UC: Nonalcoholic liver disease | ||||||
| North America | 1.20 | 0.40 | 2.60 | — | — | 1 |
| United Kingdom | NS | NS | NS | NS | NS | NS |
| North Europe | 3.50 | 2.05 | 5.98 | 22.4% | 0.28 | 3 |
| South Europe | 0.50 | 0.03 | 3.00 | — | — | 1 |
| Other countries | NS | NS | NS | NS | NS | NS |
| EC-IBD | NS | NS | NS | NS | NS | NS |
| CD: CRC | ||||||
| North America | 1.90 | 0.90 | 3.70 | — | — | 1 |
| United Kingdom | NS | NS | NS | NS | NS | NS |
| North Europe | 1.08 | 0.24 | 4.81 | 34.4% | 0.22 | 2 |
| South Europe | 3.86 | 0.86 | 17.20 | 0.0% | 0.45 | 2 |
| Other countries | 64.4 | 7.72 | 232.50 | — | — | 1 |
| EC-IBD | NS | NS | NS | NS | NS | NS |
| CD: Cardiovascular disease | ||||||
| North America | 0.96 | 0.77 | 1.19 | 0.0% | 0.41 | 2 |
| United Kingdom | 0.80 | 0.50 | 1.38 | — | — | 1 |
| North Europe | 1.03 | 0.88 | 1.21 | 0.0% | 0.78 | 4 |
| South Europe | 0.65 | 0.24 | 1.41 | — | — | 1 |
| Other countries | NS | NS | NS | NS | NS | NS |
| EC-IBD | 1.49 | 0.74 | 2.66 | — | — | 1 |
| CD: Pulmonary disease | ||||||
| North America | 1.89 | 1.35 | 2.64 | 0.0% | 0.94 | 2 |
| United Kingdom | 0.90 | 0.42 | 2.06 | — | — | 1 |
| North Europe | 1.28 | 0.81 | 2.03 | 0.0% | 0.50 | 4 |
| South Europe | NS | NS | NS | NS | NS | NS |
| Other countries | NS | NS | NS | NS | NS | NS |
| EC-IBD | 2.66 | 0.72 | 6.80 | — | — | 1 |
| CD: Nonalcoholic liver disease | ||||||
| North America | 2.60 | 1.00 | 5.30 | — | — | 1 |
| United Kingdom | NS | NS | NS | NS | NS | NS |
| North Europe | 3.10 | 1.24 | 7.73 | 0.0% | 0.36 | 2 |
| South Europe | NS | NS | NS | NS | NS | NS |
| Other countries | NS | NS | NS | NS | NS | NS |
| EC-IBD†† | NS | NS | NS | NS | NS | NS |
| UC: CRC | ||||||
| Inception | 2.85 | 1.59 | 4.69 | — | — | 1 |
| Population | 2.60 | 1.21 | 5.61 | 86.4% | 0.00 | 5 |
| Single center | NS | NS | NS | NS | NS | NS |
| Multicenter | 3.46 | 1.58 | 6.57 | — | — | 1 |
| UC: Cardiovascular disease | ||||||
| Inception | 1.00 | 0.82 | 1.23 | 49.4% | 0.10 | 5 |
| Population | 0.90 | 0.79 | 1.04 | 29.6% | 0.24 | 4 |
| Single center | 0.65 | 0.26 | 1.34 | — | — | 1 |
| Multicenter | 0.76 | 0.56 | 1.02 | 0.0% | 0.66 | 2 |
| UC: Pulmonary disease | ||||||
| Inception | 1.60 | 1.22 | 2.10 | 11.4% | 0.34 | 5 |
| Population | 1.49 | 1.24 | 1.80 | 0.0% | 0.41 | 4 |
| Single center | NS | NS | NS | NS | NS | NS |
| Multicenter | 0.49 | 0.13 | 1.94 | 51.7% | 0.15 | 2 |
| UC: Nonalcoholic liver disease | ||||||
| Inception | 4.80 | 2.07 | 9.45 | — | — | 1 |
| Population | 1.91 | 0.79 | 4.60 | 57.4% | 0.10 | 3 |
| Single center | NS | NS | NS | NS | NS | NS |
| Multicenter | 0.50 | 0.03 | 3.00 | — | — | 1 |
| CD: CRC | ||||||
| Inception | 0.30 | 0.01 | 1.67 | — | — | 1 |
| Population | 1.82 | 1.03 | 3.22 | 0.0% | 0.97 | 3 |
| Single center | 5.40 | 0.60 | 19.00 | — | — | 1 |
| Multicenter | 64.40 | 7.72 | 232.50 | — | — | 1 |
| CD: Cardiovascular disease | ||||||
| Inception | 0.97 | 0.79 | 1.19 | 0.0% | 0.60 | 5 |
| Population | 1.04 | 0.88 | 1.22 | 0.0% | 0.49 | 3 |
| Single center | 0.80 | 0.50 | 1.38 | — | — | 1 |
| Multicenter | NS | NS | NS | NS | NS | NS |
| CD: Pulmonary disease | ||||||
| Inception | 1.67 | 1.11 | 2.49 | 0.0% | 0.75 | 5 |
| Population | 1.33 | 0.52 | 3.39 | 65.0% | 0.09 | 2 |
| Single center | 0.90 | 0.42 | 2.06 | — | — | 1 |
| Multicenter | NS | NS | NS | NS | NS | NS |
| CD: Nonalcoholic liver disease | ||||||
| Inception | 0.91 | 0.02 | 5.10 | — | — | 1 |
| Population | 2.99 | 1.59 | 5.62 | 0.0% | 0.62 | 2 |
| Single center | NS | NS | NS | NS | NS | NS |
| Multicenter | NS | NS | NS | NS | NS | NS |
| UC: CRC | ||||||
| Decade 2000s | NS | NS | NS | NS | NS | NS |
| Decade 1990s | 1.53 | 0.92 | 2.53 | 0.0% | 0.71 | 2 |
| Decade 1980s | 3.30 | 0.94 | 11.67 | 87.5% | 0.00 | 3 |
| Decade 1970s | 3.76 | 2.50 | 5.66 | 46.7% | 0.17 | 2 |
| Decade 1960s | NS | NS | NS | NS | NS | NS |
| Decade 1950s | NS | NS | NS | NS | NS | NS |
| UC: Cardiovascular disease | ||||||
| Decade 2000s | NS | NS | NS | NS | NS | NS |
| Decade 1990s | 0.92 | 0.74 | 1.13 | 34.5% | 0.21 | 4 |
| Decade 1980s | 0.94 | 0.73 | 1.20 | 18.2% | 0.29 | 3 |
| Decade 1970s | 0.89 | 0.69 | 1.16 | 74.1% | 0.02 | 3 |
| Decade 1960s | NS | NS | NS | NS | NS | NS |
| Decade 1950s | 0.70 | 0.45 | 1.10 | — | — | 1 |
| UC: Pulmonary disease | ||||||
| Decade 2000s | NS | NS | NS | NS | NS | NS |
| Decade 1990s | 1.33 | 0.84 | 2.11 | 36.1% | 0.21 | 3 |
| Decade 1980s | 0.67 | 0.08 | 5.69 | 80.5% | 0.02 | 2 |
| Decade 1970s | 1.60 | 1.25 | 2.03 | 0.0% | 0.41 | 4 |
| Decade 1960s | NS | NS | NS | NS | NS | NS |
| Decade 1950s | 0.80 | 0.36 | 1.60 | — | — | 1 |
| UC: Nonalcoholic liver disease | ||||||
| Decade 2000s | NS | NS | NS | NS | NS | NS |
| Decade 1990s | 1.20 | 0.40 | 2.60 | — | — | 1 |
| Decade 1980s | 0.70 | 0.15 | 3.20 | 0.0% | 0.72 | 2 |
| Decade 1970s | 3.82 | 2.46 | 5.93 | 0.0% | 0.47 | 2 |
| Decade 1960s | NS | NS | NS | NS | NS | NS |
| Decade 1950s | NS | NS | NS | NS | NS | NS |
| CD: CRC | ||||||
| Decade 2000s | NS | NS | NS | NS | NS | NS |
| Decade 1990s | 1.87 | 0.94 | 3.72 | 0.0% | 0.85 | 2 |
| Decade 1980s | 18.73 | 1.65 | 212.59 | 75.1% | 0.05 | 2 |
| Decade 1970s | 1.08 | 0.24 | 4.81 | 34.4% | 0.22 | 2 |
| Decade 1960s | NS | NS | NS | NS | NS | NS |
| Decade 1950s | NS | NS | NS | NS | NS | NS |
| CD: Cardiovascular disease | ||||||
| Decade 2000s | NS | NS | NS | NS | NS | NS |
| Decade 1990s | 1.03 | 0.84 | 1.28 | 0.0% | 0.47 | 4 |
| Decade 1980s | 0.90 | 0.50 | 1.50 | — | — | 1 |
| Decade 1970s | 1.01 | 0.85 | 1.19 | 0.0% | 0.42 | 3 |
| Decade 1960s | 0.80 | 0.50 | 1.38 | — | — | 1 |
| Decade 1950s | NS | NS | NS | NS | NS | NS |
| CD: Pulmonary disease | ||||||
| Decade 2000s | NS | NS | NS | NS | NS | NS |
| Decade 1990s | 1.91 | 1.35 | 2.69 | 0.0% | 0.50 | 3 |
| Decade 1980s | 1.38 | 0.59 | 2.71 | — | — | 1 |
| Decade 1970s | 1.45 | 0.88 | 2.41 | 8.1% | 0.34 | 3 |
| Decade 1960s | 0.90 | 0.42 | 2.06 | — | — | 1 |
| Decade 1950s | NS | NS | NS | NS | NS | NS |
| CD: Nonalcoholic liver disease | ||||||
| Decade 2000s | NS | NS | NS | NS | NS | NS |
| Decade 1990s | 2.60 | 1.00 | 5.30 | — | — | 1 |
| Decade 1980s | NS | NS | NS | NS | NS | NS |
| Decade 1970s | 3.10 | 1.24 | 7.73 | 0.0% | 0.36 | 2 |
| Decade 1960s | NS | NS | NS | NS | NS | NS |
| Decade 1950s | NS | NS | NS | NS | NS | NS |
Decade refers to decade of the middle year of patient observation in study.
EC-IBD, European Collaborative Study Group of Inflammatory Bowel Disease; NS, no studies.
TABLE 6.
Included Diagnoses (ICD Codes) for Cause-Specific Mortality
| Study | CRC | Cardiovascular Disease | Pulmonary Disease | Nonalcoholic Liver Disease |
|---|---|---|---|---|
| Romberg-Camps et al6 | NA | ICD-10: 099–118 | ICD-10: 122–134 | NA |
| Solberg et al7 | NA | NA | NA | NA |
| Hutfless et al27 | ICD-9 : 153–154 | ICD-9: 390–459 | ICD-9: 466–519 | ICD-9: 571 |
| ICD-10: C18–C20 | ICD-10: I00–I99 | ICD-10: J02–J98 | ICD-10: K70–K76 | |
| Canavan et al28 | NA | NA | NA | NA |
| Park et al32 | NA | NA | NA | NA |
| Jess et al8 | NA | NA | NA | NA |
| Hoie et al9 | NA | ICD-10: 099–118 | ICD-10: 122–134 | NA |
| Delaunoit et al33 | NR | NA | NA | NA |
| Jess et al10 | NA | ICD-9: 390–459 | ICD-9: 460–519 | NA |
| Wolters et al11 | NA | NR | NR | NA |
| Masala et al17 | ICD-9 : 153–154 | ICD-9: 390–459 | NA | NA |
| Card et al16 | NA | NA | NA | NA |
| Winther et al12 | ICD-10: C18–C20.9 | ICD-10: I00–I52.9 | ICD-10: J00–J99 | ICD-10: K71–K77.9 |
| Uno et al29 | NR | NA | NA | NA |
| Jess et al13 | NA | ICD-10: I00–I25, I27, I30–I52 | ICD-10: J00–J99 | NA |
| Viscido et al5 | ICD-9 : 153–154 | ICD-9: 390–459 | ICD-9: 460–519 | ICD-9: I 55 |
| Farrokhyar et al14 | NA | NA | NA | NA |
| Katoh et al34 | NA | NA | NA | NA |
| Ishibashi et al18 | ICD-9 : 153–154 | NA | NA | NA |
| Saro Gismera et al19 | NA | NA | NA | NA |
| Palli et al20 | ICD-9 : 153–154 | ICD-9: 390–459 | ICD-9: 460–519 | NA |
| Davoli et al35 | NA | ICD-9: 390–459 | NA | NA |
| Persson et al15 | ICD-9 : 153–154 | ICD-9: 390–458 | ICD-9: 460–519 | ICD-9: 570–573 (excluding 571.0) |
| Cottone et al36 | NR | NA | NA | NA |
| Stewenius et al21 | NA | NA | NR | NA |
| Probert et al22 | NA | NA | NA | NA |
| Ekbom et al23 | ICD-7: 153–154 | ICD-7: 400–468 | ICD-7: 470–527 | ICD-7: 580–583 (excluding 5811) |
| ICD-8: 153–154 | ICD-8: 390–458 | ICD-8: 480–519 | ICD-8: 570–573 (excluding 5170) | |
| Probert et al24 | NA | NA | NR | NA |
| Weterman et al37 | NA | NA | NR | NA |
| Gyde et al30 | NA | ICD-7: 400–468 | ICD-7: 470–527 | NA |
| Eason et al31 | NR | NR | NA | NA |
| Prior et al38 | NA | ICD-7: 400–468 | ICD-7: 470–527 | NA |
| Ritchie et al39 | NA | NA | NA | NA |
| Gilat et al25 | NA | NA | NA | NA |
| Iversen et al26 | NA | NA | NA | NA |
ICD, International Classification of Diseases; NA, not applicable; NR, not reported.
Publication Bias
There was no evidence of publication bias for all-cause mortality or cause-specific mortality for UC or CD (P > 0.09 for all tests).
DISCUSSION
The present meta-analysis shows a small increase in all-cause mortality for both UC and CD. Cause-specific analysis reveals significantly increased mortality from CRC, pulmonary disease, and nonalcoholic liver disease for UC; and from pulmonary and nonalcoholic liver disease for CD. Cardiovascular disease–related mortality was not elevated for either UC or CD, which is congruent with previous meta-analysis.2 We examined geographic region, study period, and study design as the potential sources of heterogeneity, but none entirely explained the observed heterogeneity among all-cause mortality.
This is the first meta-analysis to conclude that patients with UC have an increased mortality rate relative to the general population. We observed this in the overall analysis of all-cause mortality, in population-based studies, in population plus inception cohort studies, but not in inception cohort–alone studies. A previous meta-analysis of inception cohort studies by Jess et al3 also did not observe a significantly increased mortality rate relative to the general population. Of note, our meta-analysis included 4 new inception cohort studies not included by Jess et al.6-8,14 However, we also categorized 5 studies in the meta-analysis by Jess et al as population-based but not inception cohorts because it was not specifically stated that patients received their initial IBD diagnosis during their time within the cohort or the study did not explicitly state it was an inception cohort study.12,17,21-23,31 Additionally, we excluded abstracts from our analysis, although there was 1 abstract included in the meta-analysis by Jess et al. These conservative efforts in study inclusion and classification may have contributed to the slightly different results. However, importantly, the summary SMRs for inception and population-based studies were similar in magnitude (UC inception 1.08; population, 1.32; CD inception, 1.34, population based, 1.39) and as expected, combining inception cohorts and population-based studies yielded similar results (UC, 1.17; 95% CI, 1.04–1.32; CD, 1.37; 95% CI, 1.22–1.53).
Inception cohorts by definition include all follow-up time in the early stages of disease but may not be able to follow patients for a sufficiently long period in the later years of disease to fully assess long-term risk of mortality, in particular cancer-related mortality and mortality related to long-term complications of IBD. In contrast, noninception population-based cohorts include some patients in the early stages of disease and others with late stage disease. Thus, inception cohorts are better suited to capture early mortality as their observation time occurs at the onset of disease, although population-based studies are better suited to capture late mortality given their observation time occurs at any stage of disease. It has been suggested that all-cause mortality from UC peaks within the first year of diagnosis.41-44 If this were the case, inception cohort studies would be expected to observe higher all-cause mortality rates than population-based studies. Unfortunately, in our study, we were unable to assess whether the RR of mortality varied by years after IBD diagnosis.
We used cumulative meta-analysis and meta-regression to examine trend in relative mortality rates over time. We hypothesized that over time, the overall mortality rates for patients with IBD would move toward 1.0. For UC, this was evident examining the earliest studies with continued improvement over the range of the cumulative meta-analysis, and from our analysis excluding the 2 earliest studies where the summary SMR is not significantly elevated. This may be because of improved surgical options for UC over time. However, for CD, overall mortality has not shown a significant change over time. Given that there were no studies meeting our inclusion criteria documenting mortality rates in the 2000s, it remains possible that there has been a decrease in mortality as a result of improved medical therapy in recent years. Given the shift in treatment patterns including more frequent use of thiopurines, methotrexate, and anti–tumor necrosis factor-α therapies, this is an important question for future research.45,46
This current study suggests multiple potential sources of elevated mortality including CRC, pulmonary disease, and hepatic disease, some of which may be preventable deaths (Table 3). Previous meta-analyses and reviews of these studies have found elevated pulmonary-related mortality in IBD, with observed causes including chronic obstructive pulmonary disease (COPD) and pneumonia (UC).3,4,47 Our current meta-analysis evaluated a greater number of studies and found similarly elevated pulmonary-related relative mortality for both UC and CD. It is plausible that similar causes drove our all-cause mortality findings as well, raising potential avenues for intervention including increasing the use of smoking cessation counseling, and adherence with pneumonia and influenza vaccines.
Similar to Jess et al, we observed an elevated RR of death for nonalcoholic liver disease mortality in UC.3 It has long been recognized that patients with UC are at an increased risk of primary sclerosing cholangitis and its complications.48 We also found that patients with CD had a slightly higher RR of dying from liver disease. This finding raises the question of whether primary sclerosing cholangitis is more aggressive in CD, underrecognized in CD,49 or if another form of liver disease is driving this increased mortality, such as fatty liver disease. These findings suggest the potential utility of monitoring patients with IBD for liver disease, although this has never been proven in clinical trials.
Death from CRC-related mortality has long been described in IBD, although the 2 most recent meta-analyses showed a nonsignificant or marginally significantly increased CRC-related mortality in CD and UC, respectively.3,4 Our current meta-analysis found an elevated risk of relative mortality for CRC in UC and a trend toward an elevated risk of CD. Our inclusion of single and multicenter studies could have contributed to this. In our stratified analysis for UC, all study types yielded elevated RRs of mortality for CRC, although multicenter studies did contribute the highest risk (see Table 5). In contrast, for CD, there was an elevated RR of mortality for the population-based studies and the 2 referral-based studies but not for the inception-based study (see Table 5). It is possible, as discussed above, that inception cohorts were not able to follow patients for a sufficiently long period to capture long-term mortality such as CRC.
It is plausible that the RR of CRC mortality is decreasing over time, as access to care and screening for CRC has increased.50 Although we were underpowered to make strong correlations, there seemed to be a trend toward decreased relative mortality over decade time in UC but not in CD (see Table 5). This could reflect greater awareness of the need for CRC surveillance in UC, although recent evidence argues against this.51 Alternatively, there could be more frequent use of chemopreventive agents, such as mesalamine in UC than in CD, albeit these chemopreventive effects have not been definitively proven.52 Finally, reduction in CRC-related relative mortality among patients with IBD would need to exceed that observed in the general population for this to be evident as a RR reduction. Increased CRC screening in the general population could obscure improvements in CRC-related mortality among patients with IBD when using RR estimates as the summary measure.
There are several limitations in this study. In some cases, cause of death was ascertained from death certificates and therefore subject to potential misclassification bias. As described above, there is the potential for misclassification of inception versus population cohort studies. SMRs were only age and sex adjusted; therefore, other characteristics of the study populations may have contributed to heterogeneity. For example, we were unable to assess whether current or former smoking contributed to excess mortality. Disease severity was not assessed in the included studies, and therefore, we were unable to assess heterogeneity in the overall mortality by disease severity. Finally, we could not determine whether the attributable risk of death because of IBD differs by age. These all remain important questions.
In summary, to date, this is the largest and most comprehensive meta-analysis evaluating all-cause and cause-specific mortality in IBD. This is the first meta-analysis to observe an elevated overall relative mortality in patients with UC. We found little evidence of significant differences in all-cause relative mortality summary estimates for population-based versus inception-based studies for either UC or CD. We also confirmed the previously reported increased all-cause relative mortality for patients with CD. Additionally, we have found statistically increased colorectal cancer-related, pulmonary-related, and nonalcoholic liver disease–related relative mortality for UC and a statistically increased pulmonary-related and nonalcoholic liver disease–related relative mortality for CD. Cardiovascular disease–related relative mortality was not elevated for either UC or CD. Further work evaluating specific etiologies of these cause-specific mortalities is likely to be illuminating.
Footnotes
Author Contributions: Study concept and design, paper reviewer, analysis and interpretation of data, statistical analysis, drafting of manuscript, critical revision of manuscript, statistical analysis: Meenakshi Bewtra. Paper reviewer, interpretation of data; critical revision of manuscript: Lisa Kaiser. Statistical analysis, drafting of manuscript; critical revision of manuscript: Tom TenHave. Study concept and design, paper reviewer, analysis and interpretation of data, drafting of manuscript, critical revision of manuscript: James D. Lewis.
The authors have no conflicts of interest to disclose.
References
- 1.Canavan C, Abrams KR, Mayberry JF. Meta-analysis: mortality in Crohn’s disease. Aliment Pharmacol Ther. 2007;25:861–870. doi: 10.1111/j.1365-2036.2007.03276.x. [DOI] [PubMed] [Google Scholar]
- 2.Dorn SD, Sandler RS. Inflammatory bowel disease is not a risk factor for cardiovascular disease mortality: results from a systematic review and meta-analysis. Am J Gastroenterol. 2007;102:662–667. doi: 10.1111/j.1572-0241.2006.01018.x. [DOI] [PubMed] [Google Scholar]
- 3.Jess T, Gamborg M, Munkholm P, et al. Overall and cause-specific mortality in ulcerative colitis: meta-analysis of population-based inception cohort studies. Am J Gastroenterol. 2007;102:609–617. doi: 10.1111/j.1572-0241.2006.01000.x. [DOI] [PubMed] [Google Scholar]
- 4.Duricova D, Pedersen N, Elkjaer M, et al. Overall and cause-specific mortality in Crohn’s disease: a meta-analysis of population-based studies. Inflamm Bowel Dis. 2010;16:347–353. doi: 10.1002/ibd.21007. [DOI] [PubMed] [Google Scholar]
- 5.Viscido A, Bagnardi V, Sturniolo GC, et al. Survival and causes of death in Italian patients with ulcerative colitis. A GISC nationwide study. Dig Liver Dis. 2001;33:686–692. doi: 10.1016/s1590-8658(01)80046-3. [DOI] [PubMed] [Google Scholar]
- 6.Romberg-Camps M, Kuiper E, Schouten L, et al. Mortality in inflammatory bowel disease in the Netherlands 1991-2002: results of a population-based study: the IBD South-Limburg cohort. Inflamm Bowel Dis. 2010;16:1397–1410. doi: 10.1002/ibd.21189. [DOI] [PubMed] [Google Scholar]
- 7.Solberg IC, Lygren I, Jahnsen J, et al. Clinical course during the first 10 years of ulcerative colitis: results from a population-based inception cohort (IBSEN Study) Scand J Gastroenterol. 2009;44:431–440. doi: 10.1080/00365520802600961. [DOI] [PubMed] [Google Scholar]
- 8.Jess T, Riis L, Vind I, et al. Changes in clinical characteristics, course, and prognosis of inflammatory bowel disease during the last 5 decades: a population-based study from Copenhagen, Denmark. Inflamm Bowel Dis. 2007;13:481–489. doi: 10.1002/ibd.20036. [DOI] [PubMed] [Google Scholar]
- 9.Hoie O, Schouten LJ, Wolters FL, et al. Ulcerative colitis: no rise in mortality in a European-wide population based cohort 10 years after diagnosis. Gut. 2007;56:497–503. doi: 10.1136/gut.2006.101519. [DOI] [PMC free article] [PubMed] [Google Scholar]
- 10.Jess T, Loftus EV, Jr, Harmsen WS, et al. Survival and cause specific mortality in patients with inflammatory bowel disease: a long term outcome study in Olmsted County, Minnesota, 1940-2004. Gut. 2006;55:1248–1254. doi: 10.1136/gut.2005.079350. [DOI] [PMC free article] [PubMed] [Google Scholar]
- 11.Wolters FL, Russel MG, Sijbrandij J, et al. Disease outcome of inflammatory bowel disease patients: general outline of a Europe-wide population-based 10-year clinical follow-up study. Scand J Gastroenterol Suppl. 2006;(243):46–54. doi: 10.1080/00365520600664250. [DOI] [PubMed] [Google Scholar]
- 12.Winther KV, Jess T, Langholz E, et al. Survival and cause-specific mortality in ulcerative colitis: follow-up of a population-based cohort in Copenhagen County. Gastroenterology. 2003;125:1576–1582. doi: 10.1053/j.gastro.2003.09.036. [DOI] [PubMed] [Google Scholar]
- 13.Jess T, Winther KV, Munkholm P, et al. Mortality and causes of death in Crohn’s disease: follow-up of a population-based cohort in Copenhagen County, Denmark. Gastroenterology. 2002;122:1808–1814. doi: 10.1053/gast.2002.33632. [DOI] [PubMed] [Google Scholar]
- 14.Farrokhyar F, Swarbrick ET, Grace RH, et al. Low mortality in ulcerative colitis and Crohn’s disease in three regional centers in England. Am J Gastroenterol. 2001;96:501–507. doi: 10.1111/j.1572-0241.2001.03466.x. [DOI] [PubMed] [Google Scholar]
- 15.Persson PG, Bernell O, Leijonmarck CE, et al. Survival and cause-specific mortality in inflammatory bowel disease: a population-based cohort study. Gastroenterology. 1996;110:1339–1345. doi: 10.1053/gast.1996.v110.pm8613037. [DOI] [PubMed] [Google Scholar]
- 16.Card T, Hubbard R, Logan RF. Mortality in inflammatory bowel disease: a population-based cohort study. Gastroenterology. 2003;125:1583–1590. doi: 10.1053/j.gastro.2003.09.029. [DOI] [PubMed] [Google Scholar]
- 17.Masala G, Bagnoli S, Ceroti M, et al. Divergent patterns of total and cancer mortality in ulcerative colitis and Crohn’s disease patients: the Florence IBD study 1978-2001. Gut. 2004;53:1309–1313. doi: 10.1136/gut.2003.031476. [DOI] [PMC free article] [PubMed] [Google Scholar]
- 18.Ishibashi N, Hirota Y, Ikeda M, et al. Ulcerative colitis and colorectal cancer: a follow-up study in Fukuoka, Japan. Int J Epidemiol. 1999;28:609–613. doi: 10.1093/ije/28.4.609. [DOI] [PubMed] [Google Scholar]
- 19.Saro Gismera C, Lacort Fernandez M, Arguelles Fernandez G, et al. Mortality and causes of death in patients with chronic inflammatory bowel disease in Gijon, Asturias (Spain) Rev Esp Enferm Dig. 1999;91:199–208. [PubMed] [Google Scholar]
- 20.Palli D, Trallori G, Saieva C, et al. General and cancer specific mortality of a population based cohort of patients with inflammatory bowel disease: the Florence Study. Gut. 1998;42:175–179. doi: 10.1136/gut.42.2.175. [DOI] [PMC free article] [PubMed] [Google Scholar]
- 21.Stewenius J, Adnerhill I, Anderson H, et al. Incidence of colorectal cancer and all cause mortality in non-selected patients with ulcerative colitis and indeterminate colitis in Malmo, Sweden. Int J Colorectal Dis. 1995;10:117–122. doi: 10.1007/BF00341210. [DOI] [PubMed] [Google Scholar]
- 22.Probert CS, Jayanthi V, Wicks AC, et al. Mortality in patients with ulcerative colitis in Leicestershire, 1972-1989. An epidemiological study. Dig Dis Sci. 1993;38:538–541. doi: 10.1007/BF01316511. [DOI] [PubMed] [Google Scholar]
- 23.Ekbom A, Helmick CG, Zack M, et al. Survival and causes of death in patients with inflammatory bowel disease: a population-based study. Gastroenterology. 1992;103:954–960. doi: 10.1016/0016-5085(92)90029-x. [DOI] [PubMed] [Google Scholar]
- 24.Probert CS, Jayanthi V, Wicks AC, et al. Mortality from Crohn’s disease in Leicestershire, 1972-1989: an epidemiological community based study. Gut. 1992;33:1226–1228. doi: 10.1136/gut.33.9.1226. [DOI] [PMC free article] [PubMed] [Google Scholar]
- 25.Gilat T, Lilos P, Zemishlany Z, et al. Ulcerative colitis in the Jewish population of Tel-Aviv Yafo. III. Clinical course. Gastroenterology. 1976;70:14–19. [PubMed] [Google Scholar]
- 26.Iversen E, Bonnevie O, Anthonisen P, et al. An epidemiological model of ulcerative colitis. Scand J Gastroenterol. 1968;3:593–610. [PubMed] [Google Scholar]
- 27.Hutfless SM, Weng X, Liu L, et al. Mortality by medication use among patients with inflammatory bowel disease, 1996-2003. Gastroenterology. 2007;133:1779–1786. doi: 10.1053/j.gastro.2007.09.022. [DOI] [PubMed] [Google Scholar]
- 28.Canavan C, Abrams KR, Hawthorne B, et al. Long-term prognosis in Crohn’s disease: An epidemiological study of patients diagnosed more than 20 years ago in Cardiff. Aliment Pharmacol Ther. 2007;25:59–65. doi: 10.1111/j.1365-2036.2006.03132.x. [DOI] [PubMed] [Google Scholar]
- 29.Uno H, Yao T, Matsui T, et al. Mortality and cause of death in Japanese patients with Crohn’s disease. Dis Colon Rectum. 2003;46:S15–S21. doi: 10.1097/01.DCR.0000087485.03284.D3. [DOI] [PubMed] [Google Scholar]
- 30.Gyde S, Prior P, Dew MJ, et al. Mortality in ulcerative colitis. Gastroenterology. 1982;83:36–43. [PubMed] [Google Scholar]
- 31.Eason RJ, Lee SP, Tasman-Jones C. Inflammatory bowel disease in Auckland, New Zealand. Aust N Z J Med. 1982;12:125–131. doi: 10.1111/j.1445-5994.1982.tb02443.x. [DOI] [PubMed] [Google Scholar]
- 32.Park SH, Kim YM, Yang SK, et al. Clinical features and natural history of ulcerative colitis in Korea. Inflamm Bowel Dis. 2007;13:278–283. doi: 10.1002/ibd.20015. [DOI] [PubMed] [Google Scholar]
- 33.Delaunoit T, Limburg PJ, Goldberg RM, et al. Colorectal cancer prognosis among patients with inflammatory bowel disease. Clin Gastroenterol Hepatol. 2006;4:335–342. doi: 10.1016/j.cgh.2005.12.035. [DOI] [PubMed] [Google Scholar]
- 34.Katoh H, Iwane S, Munakata A, et al. Long-term prognosis of patients with ulcerative colitis in Japan. J Epidemiol. 2000;10:48–54. doi: 10.2188/jea.10.48. [DOI] [PubMed] [Google Scholar]
- 35.Davoli M, Prantera C, Berto E, et al. Mortality among patients with ulcerative colitis: Rome 1970-1989. Eur J Epidemiol. 1997;13:189–194. doi: 10.1023/a:1007388626476. [DOI] [PubMed] [Google Scholar]
- 36.Cottone M, Magliocco A, Rosselli M, et al. Mortality in patients with Crohn’s disease. Scand J Gastroenterol. 1996;31:372–375. doi: 10.3109/00365529609006413. [DOI] [PubMed] [Google Scholar]
- 37.Weterman IT, Biemond I, Pena AS. Mortality and causes of death in Crohn’s disease. Review of 50 years’ experience in Leiden University Hospital. Gut. 1990;31:1387–1390. doi: 10.1136/gut.31.12.1387. [DOI] [PMC free article] [PubMed] [Google Scholar]
- 38.Prior P, Gyde S, Cooke WT, et al. Mortality in Crohn’s disease. Gastroenterology. 1981;80:307–312. [PubMed] [Google Scholar]
- 39.Ritchie JK, Powell-Tuck J, Lennard-Jones JE. Clinical outcome of the first ten years of ulcerative colitis and proctitis. Lancet. 1978;1:1140–1143. doi: 10.1016/s0140-6736(78)90312-4. [DOI] [PubMed] [Google Scholar]
- 40.Mayberry JF, Dew MJ, Morris JS, et al. An audit of Crohn’s disease in a defined population. J R Coll Physicians Lond. 1983;17:196–198. [PMC free article] [PubMed] [Google Scholar]
- 41.Brostrom O, Monsen U, Nordenwall B, et al. Prognosis and mortality of ulcerative colitis in Stockholm County, 1955-1979. Scand J Gastroenterol. 1987;22:907–913. doi: 10.3109/00365528708991934. [DOI] [PubMed] [Google Scholar]
- 42.Sinclair TS, Brunt PW, Mowat NA. Nonspecific proctocolitis in north-eastern Scotland: a community study. Gastroenterology. 1983;85:1–11. [PubMed] [Google Scholar]
- 43.Hendriksen C, Kreiner S, Binder V. Long term prognosis in ulcerative colitis—based on results from a regional patient group from the county of Copenhagen. Gut. 1985;26:158–163. doi: 10.1136/gut.26.2.158. [DOI] [PMC free article] [PubMed] [Google Scholar]
- 44.Cosnes J, Gower-Rousseau C, Seksik P, et al. Epidemiology and natural history of inflammatory bowel diseases. Gastroenterology. 2011;140:1785–1794. doi: 10.1053/j.gastro.2011.01.055. [DOI] [PubMed] [Google Scholar]
- 45.Sokol H, Seksik P, Carrat F, et al. Usefulness of co-treatment with immunomodulators in patients with inflammatory bowel disease treated with scheduled infliximab maintenance therapy. Gut. 2010;59:1363–1368. doi: 10.1136/gut.2010.212712. [DOI] [PubMed] [Google Scholar]
- 46.Herrinton LJ, Liu L, Fireman B, et al. Time trends in therapies and outcomes for adult inflammatory bowel disease, Northern California, 1998-2005. Gastroenterology. 2009;137:502–511. doi: 10.1053/j.gastro.2009.04.063. [DOI] [PubMed] [Google Scholar]
- 47.Peyrin-Biroulet L, Loftus EV, Jr, Colombel JF, et al. Long-term complications, extraintestinal manifestations, and mortality in adult Crohn’s disease in population-based cohorts. Inflamm Bowel Dis. 2011;17:471–478. doi: 10.1002/ibd.21417. [DOI] [PubMed] [Google Scholar]
- 48.Navaneethan U, Shen B. Hepatopancreatobiliary manifestations and complications associated with inflammatory bowel disease. Inflamm Bowel Dis. 2010;16:1598–1619. doi: 10.1002/ibd.21219. [DOI] [PubMed] [Google Scholar]
- 49.Bruining DH, Siddiki HA, Fletcher JG, et al. Prevalence of penetrating disease and extraintestinal manifestations of Crohn’s disease detected with CT enterography. Inflamm Bowel Dis. 2008;14:1701–1706. doi: 10.1002/ibd.20529. [DOI] [PubMed] [Google Scholar]
- 50.Soderlund S, Brandt L, Lapidus A, et al. Decreasing time-trends of colorectal cancer in a large cohort of patients with inflammatory bowel disease. Gastroenterology. 2009;136:1561–1567. doi: 10.1053/j.gastro.2009.01.064. quiz 1818–1819. [DOI] [PubMed] [Google Scholar]
- 51.Velayos FS, Liu L, Lewis JD, et al. Prevalence of colorectal cancer surveillance for ulcerative colitis in an integrated health care delivery system. Gastroenterology. 2010;139:1511–1518. doi: 10.1053/j.gastro.2010.07.039. [DOI] [PubMed] [Google Scholar]
- 52.Rubenstein JH, Waljee AK, Jeter JM, et al. Cost effectiveness of ulcerative colitis surveillance in the setting of 5-aminosalicylates. Am J Gastroenterol. 2009;104:2222–2232. doi: 10.1038/ajg.2009.264. [DOI] [PMC free article] [PubMed] [Google Scholar]