Abstract
Single DNA molecules confined to nanoscale fluidic channels extend along the channel axis in order to minimize their conformational free energy. When such molecules are forced into a nanoscale fluidic channel under the application of an external electric field, monomers near the middle of the DNA molecule may enter first, resulting in a folded configuration with less entropy than an unfolded molecule. The increased free energy of a folded molecule results in two effects: an increase in extension factor per unit length for each segment of the molecule, and a spatially localized force that causes the molecule to spontaneously unfold. The ratio of this unfolding force to hydrodynamic friction per DNA contour length is measured in nanochannels with two different diameters.
Introduction
Nanofluidic channels have shown promise for the analysis of genomic length DNA molecules. Assays for fragment length analysis1–3, real time enzymatic restriction mapping4, and localization of hybridized probes5,6 have all been demonstrated. The growing interest in long single molecule DNA sequencing techniques provides good motivation for understanding the means to control and manipulate single molecules in fluidic systems7,8. Detailed studies of the conformation and dynamics of single molecules in nanochannels have corroborated models for self excluding polymers in confined environments. In previous experiments, thermally induced fluctuations of extension length9, expansion after a high degree of compression10, and contraction after a high degree of stretching11 have all been observed in qualitative agreement with the theory. Self extraction of molecules partially inserted into nanostructures has also been observed, allowing for direct measurement of a confinement induced force11–13. Such studies of entropic forces resulting from confined geometries have biological importance for understanding the packaging of DNA into viral capsids14 and bacterial chromosome segration15, for example.
Recently, molecular dynamic (MD) simulations have been applied to study confined polymers that overlap16. While it is experimentally difficult to position two DNA molecules in a nanochannel so that they partially overlap, it is relatively straightforward to insert a single molecule into a nanochannel such that the front end is folded over on itself.
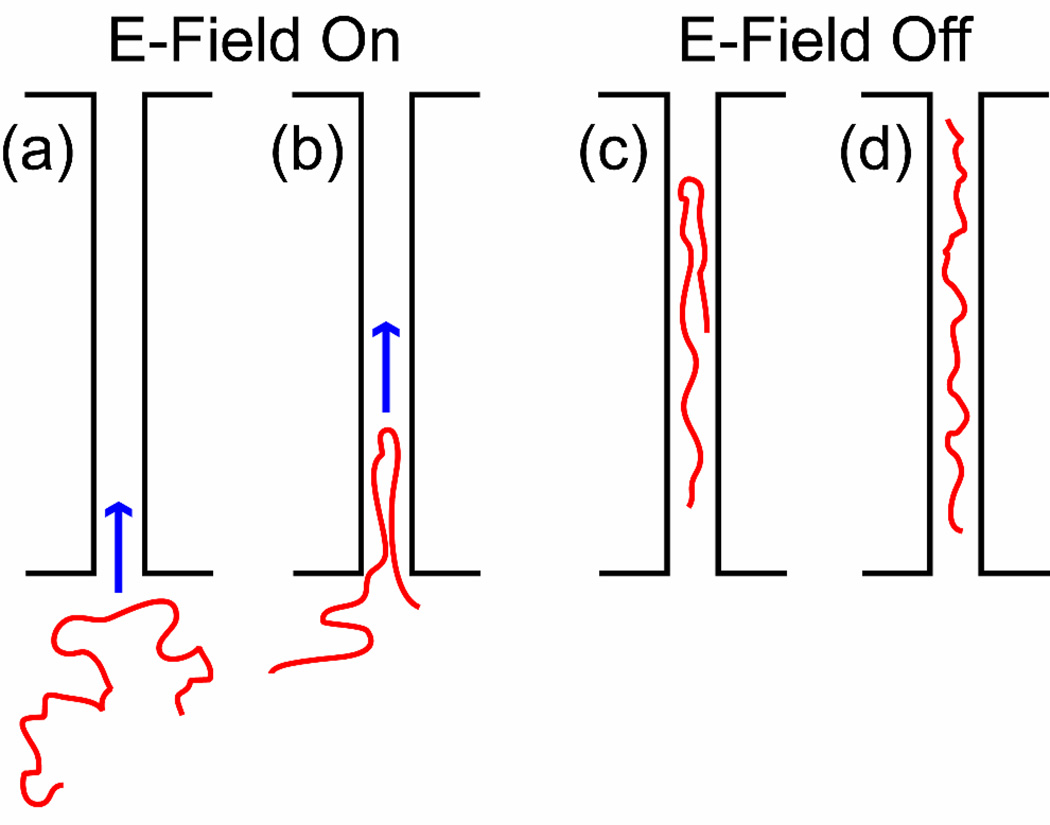
We have inserted and observed folded DNA molecules in nanochannels as depicted in Figure 1. Long DNA molecules are electrophoretically driven from a microfluidic region to the entrance of the smaller channel. The electric field is turned off before the molecules enter the channel and thermal agitation causes them to undergo a number of different intramolecular conformations. When a molecule happens to be in an appropriate conformation and position relative to the channel entrance (as depicted in Figure 1a), the field is turned on and the molecule enters the channel, often with a folded front end. After the entire DNA molecule has entered the channel, the field is switched off and the dynamics of the molecule are observed. In this letter we pay particular attention to the spontaneous unfolding of the looped end which we theorize to be entropically induced. Presently, the theory of a long polymer confined in a nanochannel is reviewed, the forces on a partially folded molecule in a nanochannel are discussed, and a model describing the unfolding process through time is derived.
Figure 1.
Overview of experimental procedure. (a) A long DNA molecule sits in a microchannel, adjacent to the entrance of a nanochannel. (b) The electric field (blue arrow) pulls the DNA into the nanochannel. Because the molecule’s entrance was initiated at some point along the backbone distinct from either of the ends, it enters the channel in a folded conformation. (c) Once the electric field is turned off, the DNA strand relaxes inside the nanochannel in a high energy folded state. It gradually unfolds, thereby reducing its conformational free energy. (d) The molecule has completely unfolded within the channel, extending to its equilibrium conformation.
Theory
We consider a self-avoiding polymer with contour length C, and persistence length p. In free solution the polymer assumes a spherical conformation with a radius of gyration RG ∝ C3/5. If confined to a long cylindrical channel of diameter D with D << Rg, the polymer will extend along the axis of the channel to an equilibrium length LE. According to a theory developed by de Gennes and co-workers17,18, the confined polymer can be thought of as a series of impenetrable and hydrodynamically uncorrelated blobs where excluded volume effects are maintained within a blob. The blob model predicts that the extension factor for a confined polymer scales according to
| (1) |
where w is the width of the molecule. At this equilibrium length the conformational free energy is at a minimum. The scaling of extension length with channel diameter has been measured for long DNA molecules in nanofabricated channels9. Additionally, the scaling of extension length with w has been investigated in channels19 and nanoslits20. By varying the ionic strength of the buffer solution, and thus the ionic screening length and effective width of the charged DNA monomers, these experiments found that lower ionic strength caused a significant increase in extension. While the cause of this extension increase is under debate21, these studies attribute it to volume exclusion effects19,20.
The experiment described in this letter allows us to probe excluded volume interactions in another manner. It is conceivable that two overlapping DNA molecules in a nanochannel could each have a larger extension than they would in the absence of the other. Since extended length depends on excluded volume interactions, this extra extension could result from the apparently smaller channel diameter each molecule sees due to the presence of the other. Our experiment with folded DNA molecules allows us to investigate this concept. We define α as the extension factor of an unfolded segment of DNA in a nanochannel, and β as the extension factor for a segment of DNA which is occupying the same space in the channel as another, independent segment of DNA. The first question we attempt to answer is whether β is greater than α.
In addition to determining the extension factors for a partially folded molecule, we investigate dynamics of our partially folded DNA molecules. We observe an entropically induced force, driven by an inhomogeneity in conformational free energy along the length of the molecule, which causes a spontaneous unfolding of initially folded molecules. Through diffusive motion, the segment of a molecule straddling the interface between the folded and unfolded regions can test the volume of space available on both sides of the interface. Because there are a greater number of accessible states for that segment in the unfolded region, it experiences a force that drives it from the folded to the unfolded region.
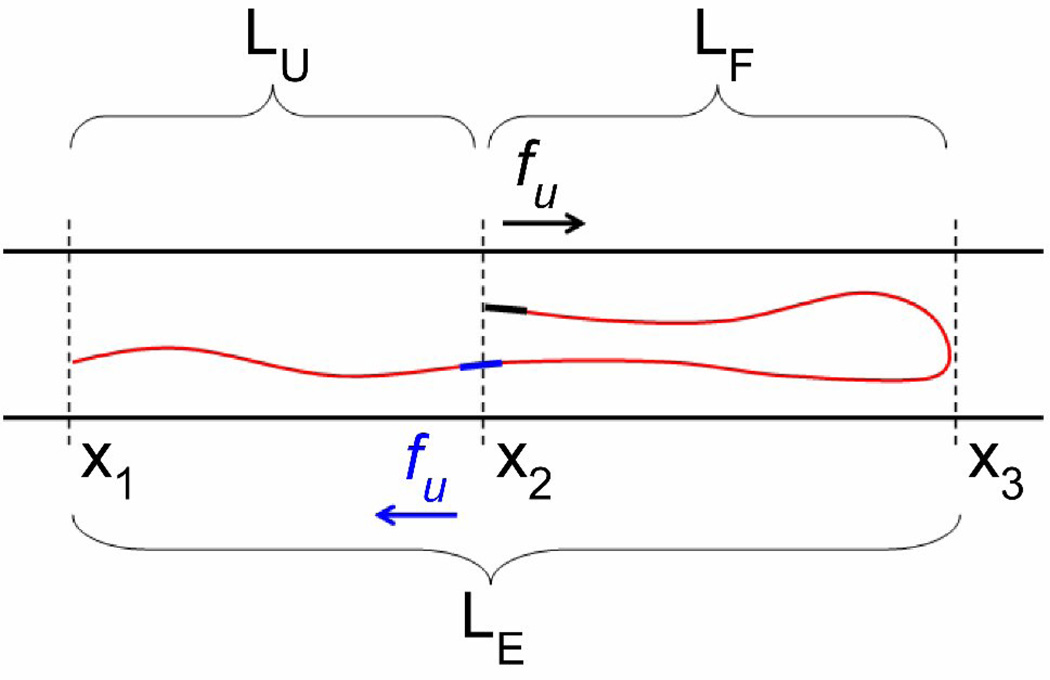
A simplified force diagram of a partially folded DNA molecule confined to a nanochannel is shown in Figure 2. In this diagram, the extension length of the unfolded portion of DNA is defined as LU = α · CU, where CU is the contour length of the unfolded portion of the DNA. In the folded section, the contour length of the DNA is defined as CF. The extension of the folded portion (the distance between x2 and x3 in the diagram) is given by LF = β · CF/2. The magnitude of the unfolding force is written as fU. In order to satisfy force balance, the unfolding force acts with equal magnitude, but opposite direction, on both the red and black points along the DNA strand.
Figure 2.
In this cartoon of folded DNA in a nanochannel, the local bending of the molecule is greatly minimized. The folded state is characterized by the projected length of the unfolded (LU) and folded (LF) portions of the molecule along the channel axis. The unfolding force, localized at the position x2, results from the difference in free energy between conformations in which the blue segment does or does not overlap with the upper black segment. The resulting forces, −fU and fU, acting on the upper and lower segments of the molecule, respectively are balanced by hydrodynamic frictional forces that are assumed to be proportional to the length and velocity of each segment. In our model, a contour length δC will be extended along the channel axis by an amount δL = α · δC or δL = β · δC, depending on whether the segment is part of the unfolded or folded portion of the molecule
In our model, at any instant in time, the upper and lower segments of the molecule are considered to be two unconnected molecules. Each is accelerated by fU until it reaches a velocity at which hydrodynamic friction is large enough to resist further acceleration (assumed to happen instantaneously). Ignoring hydrodynamic interactions (HI) between monomers, the instantaneous hydrodynamic drag on the upper portion of the molecule is given by
| (2) |
where ξ is the hydrodynamic friction per unit contour length. This is probably a slight overestimate of the drag since HI should only be completely screened23 for channels with D < p while the diameter of our channels is a factor of two or three larger. For the lower segment of molecule, the portions in the unfolded and folded regions are modeled as moving together. Because we allow for a different extension factor for those two regions, however, monomers in the unfolded portion move at a velocity ẋ1 (where a dot denotes the time derivative) while those in the folded portion move at a velocity ẋ1 · β / α. The total frictional force acting on the lower segment is the sum of the frictions acting on the two pieces (one in the unfolded region, and one in the folded region.)
| (3) |
After setting the frictional terms and equal to fU, the following difference equations are obtained:
| (4) |
| (5) |
where γ is defined as the ratio of extension factors β / α. From these equations, a numerical solution can be obtained which gives the positions x1 and x2 as a function of time. By fitting this model to unfolding data, an estimate for the magnitude of fU / ξ is obtained. We could have introduced additional terms in our model to account for HI between the upper and lower segments, but the shape of the unfolding data in time is well described by one free parameter (see Supplemental Information).
Experimental Section
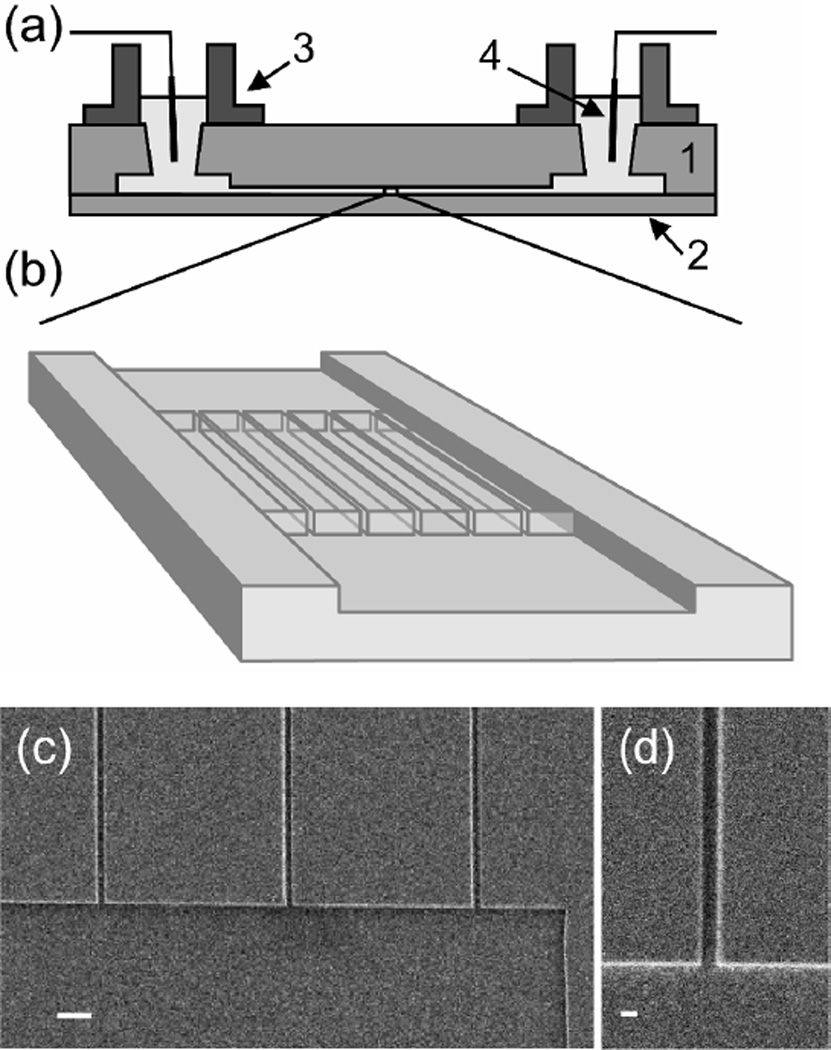
The nanochannel devices used in this letter were fabricated on mirror-polished fused silica wafers using a combination of electron beam lithography on a JBX-9300FS system (JEOL, Peabody, MA) with a negative tone resist (ma-N 2403, Micro Resist Technology, Berlin, Germany) and optical lithography. Microchannel regions were reactive ion etched adjacent to the nanochannels for ease with DNA loading. Additional details describing the device fabrication can be found in the Supporting Information. A schematic of the completed device as well as several electron micrographs of the nanostructures before bonding can be seen in Figure 3. We fabricated two sets of nanochannels with dimensions approximately 215 × 155 nm (width × depth) and 150 × 135 nm. The depth of the nanochannels was determined using a Tencor P-10 Surface Profiler with a specified sub-nm resolution. Due to the size of the profiling tip, we measure the depth in the etched regions adjacent to the nanochannel entrance (Figure 3c) and assume that the channels are etched to the same depth. The width of the channels was determined from scanning electron microscope images (Figure 3d) to an accuracy of approximately 10%. We compute the geometric average of the nanochannel dimensions as the square root of the width times the height22, yielding average nanochannel diameters of 183 nm and 142 nm, respectively.
Figure 3.
(a) Side view schematic representation of a fused silica substrate wafer (1) containing nanochannel arrays, which is bonded to a coverslip wafer (2). DNA molecules were loaded into fluidic reservoirs (3) and driven electrophoretically using gold electrodes (4). (b) Schematic close-up view of the nanochannel array region. Top-down scanning electron microscope image of a microchannel connected to nanochannel array (c) and magnified image of a single nanochannel (d) with dimension 150 × 135 nm (width × height). The scale bars are 920 nm and 195 nm in images (c) and (d), respectively.
T4-bacteriophage DNA molecules (T4GT7 DNA, Nippon Gene, Toyama, Japan) were stained with the bis-intercalating dye YOYO-1 (Molecular Probes, Eugene, OR). The contour length (CT4) of a dyed T4-DNA molecule (165.6 kbp) has been shown to increase by ≈ 30%23,24 at a saturated dye to base pair ratio of 1:4. At our dye ratio of 1:5, we then expect CT4 ≈ 70 µm. The buffer consisted of 445 mM Tris-borate and 10 mM EDTA (5 × TBE, pH 8.3, Sigma, St. Louis, MO) containing 4% (v/v) β–mercaptoethanol (Sigma) to limit photobleaching. Electrical contact was made by inserting gold electrodes in the reservoirs. Individual molecules were observed with an IX71 inverted microscope (Olympus, Melville, NY), which was equipped with a 100×/1.35 NA oil immersion objective (Olympus). Images were acquired using a Cascade 512b EMCCD (Photometrics, Tucson, AZ) at 10 frames per second using custom software written in Labview (National Instruments, Austin, TX).
DNA molecules were electrophoretically driven from loading regions to near the nanochannel entrance with a potential of 40 V. A small potential (~2 V) was applied to drive T4 molecules into nanochannels, resulting in a calculated electric field E ≈ 120 V/cm in nanochannels and E ≈ 10 V/cm in the microchannel region. A small offset voltage (< 10 mV) was sometimes used to prevent drift of DNA molecules inside the nanochannels due to either a residual voltage or pressure differential, or chemical potential differences across the device. Several videos were recorded for each molecule. For each video, the DNA molecule was observed to enter the channel in either an unfolded or folded configuration. If folded, the molecule was recorded until after it appeared to have finished unfolding. If unfolded, the molecule was typically driven back into the microchannel and the previous steps were repeated.
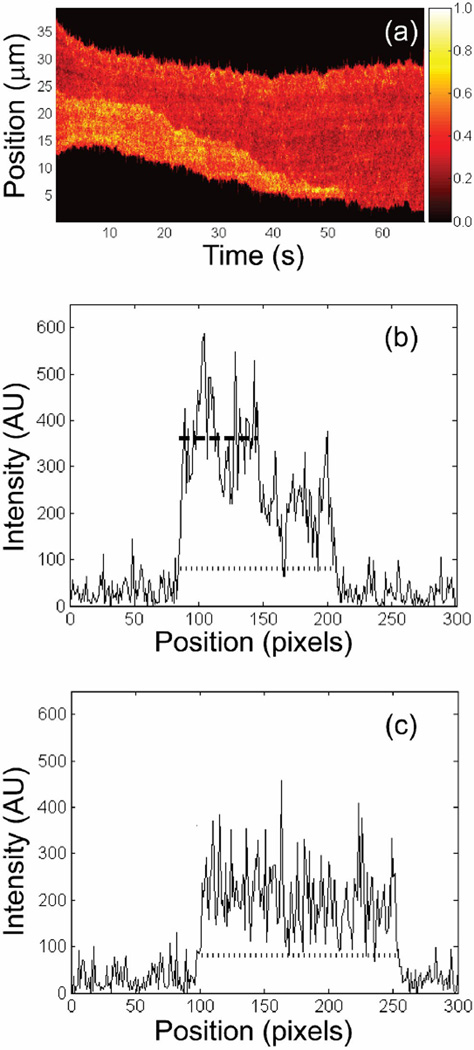
DNA molecule position and folded length were extracted from each video frame using custom algorithms programmed in MATLAB (The Mathworks, Natick, MA). In each frame, the average background intensity was subtracted from the signal region and the intensity was projected over 4 pixels (= 640 nm) along the dimension perpendicular to the channel axis. The endpoints of the DNA molecule were determined by requiring the projected intensity to be larger than a fixed value that was typically about three times larger than the background (Figure 4c). The folded region of the molecule was then found by requiring the intensity to be larger than a second threshold value using an algorithm that allowed for both turn-on and small fluctuations below this threshold (Figure 4b). The folded intensity threshold was set at approximately 1.5 times the intensity of the unfolded molecule as determined visually for each molecule. For analyzing the dynamics of unfolding molecules, we used frames acquired at least 15 s after the molecule had entered the channel (to allow the molecule to relax11) up until a few seconds before the molecule had completely unfolded.
Figure 4.
(a) Time trace showing normalized fluorescent intensity projected transverse to the nanochannel axis as a function of time. (b) Projected intensity of the DNA molecule shown in (a) as a function of position along the nanochannel while folded at 15 s. Both the end-to-end (dotted line) and folded length (dashed line) were determined using the algorithms described in the text. The intensity in the folded region is approximately twice as large as in the unfolded region. (c) Intensity projection of the same molecule at 55 s. At this point the molecule is completely unfolded resulting in a roughly constant projected intensity.
Using the determination of the end points of the molecule, we construct a time trace of the intensity profile of the molecule (Figure 4a), which shows the normalized intensity along the channel axis plotted against time. Since the algorithm for determining the endpoints and folded region of the molecule considers each frame independently, there are occasional unphysical discontinuities in these measurements as a function of time due to intensity fluctuations. To correct for these, we fit both the end-to-end and folded lengths to a smoothing function and discard outliers. In the channel with average diameter of 183 nm, we analyzed the unfolding of 15 separate molecules over an average time of 54 s where the mean initial folded length was 6 µm. In the 142 nm channel, we analyzed the unfolding of 23 separate molecules over an average time of 75 s where the mean initial folded length was 10 µm.
Results and Discussion
In order to determine the difference in extension for the folded and unfolded portions of the molecule, we derive the following equation for the folded extension length normalized by the equilibrium extension length:
| (6) |
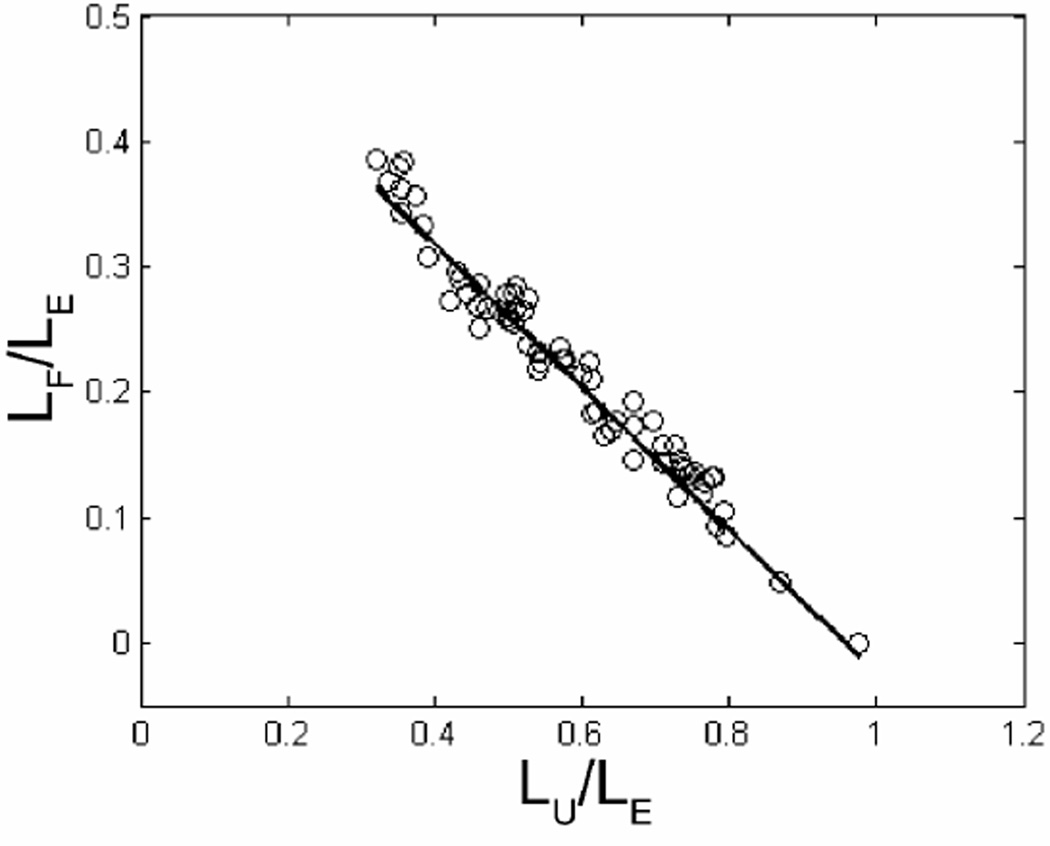
In deriving Eq. (6), we have assumed conservation of contour length and that the extension factor of the unfolded portion of the molecule (α) is the same as the extension factor at equilibrium in the nanochannel (see Supplemental Information). We plot LF / LE versus LU / LE for each molecule (Figure 5) and fit the data with a linear polynomial to extract the ratio of extension factors γ = β / α. We determine LE using the same thresholding algorithm described in the previous section from all frames at least 5 s after the molecule has unfolded (though the value we extract for γ does not depend on LE). We measured the extension factor ratio γ = 1.36 ± 0.14 and 1.30 ± 0.14 in the 183 and 142 nm nanochannels, respectively, where the error is the standard deviation (SD) of the measurements. Given our model, this implies that folded regions of molecules are ≈ 30% more extended than unfolded regions. We do not find a significant difference in the ratio of extension factors based on nanochannel dimension.
Figure 5.
Plot of LF(t) (folded length) versus LU(t) (unfolded length), both of which have been normalized to LE (end-to-end length). The result of a linear fit is overlaid (solid line). The extension parameter calculated from the slope is γ = 1.14, implying larger extension along the folded portion of the molecule relative to the unfolded. The lengths have been averaged over 0.6 s intervals to aid in visualization.
In addition to measuring the ratio of folded to unfolded extension factors, we verified that the intercept along the LU / LE axis is consistent with one to within ≈ 5% for molecules in both diameter channels. This implies that the extension factor of the unfolded portion of the molecule is the same as the equilibrium unfolded extension factor. If, for example, the unfolded portion of the molecule was compressed during the unfolding process, we would not expect the intercept to be consistent with one. The average extension factors we measure at equilibrium for the 183 and 142 nm channels are 0.20 and 0.35, respectively, which agree quite well with data shown in Fig. 4a of Ref. 9. Further, we can rederive Eq. (6) assuming instead that the extension factor for the folded portion of the molecule is the same as for a completely unfolded molecule at equilibrium. However, we then observe an intercept along the LU / LE axis that is greater than one by ≈ 30% for both nanochannel dimensions. To summarize, these results indicate that the unfolded portion of the molecule is extended similarly to the molecule at equilibrium in the channel, and that the folded portion of the molecule is extended by an additional 30% relative to the equilibrium length. We hypothesize that this effect is due to a larger excluded volume interaction for the folded portion of the molecule since the monomer density has increased relative to an unfolded molecule. However, we cannot prove this hypothesis since we do not yet have a quantitative theory relating this extra extension to excluded volume interactions.
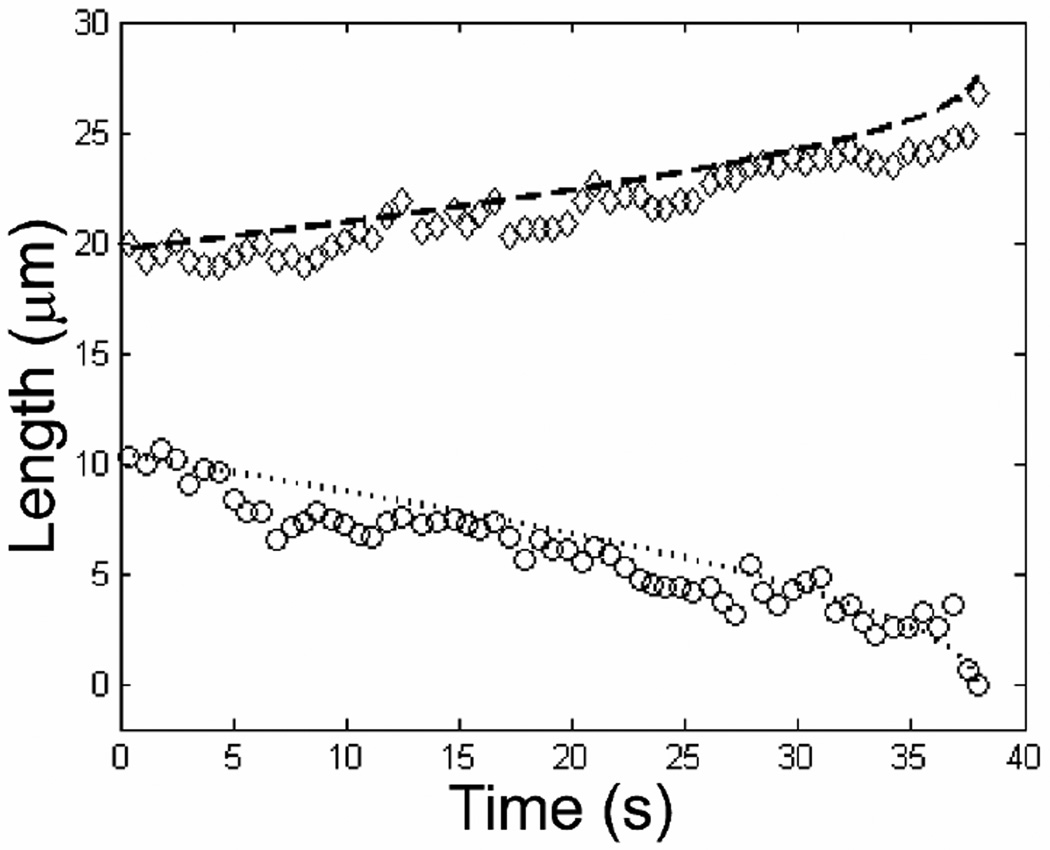
In addition to measuring extension factors, we use the numerical solution to Eq. (4) and (5) to measure the ratio of unfolding force to hydrodynamic friction per contour length fU / ξ. For a given molecule we initialize the model with LF and LU, determined from the first 2.5 s of unfolding, as well as with γ and α found for that molecule as described previously, and with a trial value for fU / ξ. The model then computes the unfolded and folded lengths as a function of time as well as the position x3 (Fig. 2). We iterate over the input value of fU / ξ until we find a minimum in the residual, defined as the sum of the squared difference between the measured and model values for the folded length at each time, normalized by the number of data points. We continue to iterate about the minimum until the change in the residual is less than 1%. A typical result comparing the numerical model prediction to the measured unfolding is shown in Figure 6. Note that the iterative procedure finds the minimum residual for LF, though the model also computes LE using the input value of gamma. We find good visual agreement between the model’s prediction and the data for both LF and LE as a function of time. The shape of a typical curve that describes the folded length as a function of time is similar to a power-law with an exponent of 1/2. The actual bend in the contour is not considered to affect the motion until the last instant of the unfolding process, when the end flops open, and the bending energy is released. We measure average values of fU / ξ = (1.8 ± 1.0) µm2 / s and (2.4 ± 1.5) µm2 / s in the 183 and 142 nm channels, respectively.
Figure 6.
Plot of measured LE (end-to-end length, diamonds) and LF (folded length, circles) for a DNA molecule in a 142 nm channel as a function of time. The results from the numerical simulation for LE and LF as a function of time are overlaid as dashed and dotted lines, respectively. The best fit from the numerical simulation yields fU / ξ = 4.4 µm2 / s. The value for γ was fixed to 1.14 as determined from the fit shown in Figure 5. The lengths have been averaged over 0.6 s intervals to aid in visualization.
We attempt to qualitatively understand the ratio of these values given our nanochannel dimensions. Since the unfolding force is expected to scale inversely with the channel diameter16, and the friction coefficient is known to scale inversely with the logarithm of the channel diameter23,25, we expect fU / ξ to scale as ≈ ln(D) / D. We then expect fU / ξ to be roughly 20% larger in the 142 nm channel than in the 183 nm channel. We find a larger value of fU / ξ in the smaller diameter channel, though with rather large uncertainty.
In order to obtain an estimate for the unfolding force, we first extrapolate the value of ξ from Mannion et al.11 who measured a friction per unit contour length of ξ = (10.0 ± 0.6) fN · s/ µm2 in 95 nm diameter nanochannels. Taking into account the (ln D)−1 scaling for the frictional dependence on channel dimension, we estimate an average unfolding force of ≈ 16 fN and ≈ 22 fN in the 183 and 142 nm channels, respectively. Arnold and Jun16 have recently used MD simulations to investigate the repulsive force between two overlapping polymers confined to a cylindrical tube. They estimate that the repulsive force is given by kBT / D, which is ≈ 25 fN in our nanochannels at room temperature and agrees well with our measured value.
Additionally, we compare the magnitude of the unfolding force to an entropic recoil force previously measured11. Briefly, this recoil force results when a DNA molecule is partially inserted into a nanochannel, with the rest of the molecule in a microchannel. Due to the difference in the number of molecular configurations available to the molecule in the two regions, an entropically induced force acting at the interface pulls the molecule into the microchannel. This force is similar to the unfolding force described in this letter. However, the change in accessible space is clearly greater for the recoiling molecule than for the unfolding one, which should result in a larger force for the recoiling molecule. The measured recoil force was approximately an order of magnitude larger than the unfolding force we present here, supporting this idea.
As previously stated, Arnold and Jun16 investigated a similar entropic force between confined overlapping polymers using MD simulations. Their main result is that entropic segregation occurs on a shorter time scale than diffusion However, they report two additional findings that we did not observe. They found that the monomer density in the region in which the polymers overlap did not depend on the presence of the additional polymer. In contrast, we measured an extension factor (reduced monomer density) of approximately 30% in the folded region of the molecule. Also, they observed that the repulsive force caused the polymers to compress as they segregated as seen in Fig. 6c of Ref. 16. We did not observe compressions distinguishable from random fluctuations in the projected photon intensities. It is possible that compressions near the folding interface could result in an overestimation of the folded length. However, one would then expect a smooth rather than step-like transition in the intensity, contrary to what was typically observed (see Fig. 4b). Our experiment differs mainly from their simulation in that we studied a single molecule unfolding, while Arnold and Jun examined two separate chains repelling. Consequently, the segregation force acts at both ends of the overlapping region in their simulation. Both our numerical model and their dynamic simulation ignored HI between monomers. These disagreements concerning polymer extension or compression may be attributed to a different ratio of the repulsive force to the hydrodynamic friction, or a different value of the polymer spring constant in their model.
Conclusion
It has been shown that DNA molecules can be driven into a nanochannel such that the front end of the molecule is folded over on itself. Using fluorescence microscopy, molecules in a folded conformation can be identified in real time and subsequently analyzed in detail. In this letter, we described two new measurements of folded molecules in nanochannels that have implications for the study of self avoiding polymers in a confining environment. First, we found a larger extension factor for segments of a DNA molecule that overlap compared to those that do not, which is most likely due to increased excluded volume interactions. Second, we measured the magnitude of an entropic repulsive force between overlapping polymer segments that originates from a difference in the number of available molecular configurations. These results add to the growing body of knowledge regarding the behavior of DNA in nanofluidic channels, and may lead to a greater ability to manipulate and analyze single DNA molecules in lab on chip devices. The observation of the unfolding process suggests that a free energy difference between overlapping and nonoverlapping polymer segments results in an entropically induced force that can segregate two initially overlapping polymers, as originally proposed by Arnold and Jun.
In future studies, we hope to investigate the unfolding process in greater detail, particularly during the initial relaxation of the polymer. While our data suggests that the unfolding force may be a function of channel diameter, we would like to systematically study unfolding using channels of many different sizes, with diameters ranging from sub-50 nm to several hundred nm. Other parameters which could be varied are ion concentration and valence. It is expected that both the dynamic behavior of the DNA and the effective confinement of the nanochannel will change as charges are screened over greater lengths or by ions of higher valence. We hope further simulations can verify the increased extension of folded molecules and quantify its dependence on exclusion volume interactions.
Supplementary Material
Acknowledgement
This work was supported by the National Human Genome Research Institute, as well as the Nanobiotechnology Center (NBTC), which is funded by the STC Program of the National Science Foundation (NSF) under agreement No. ECS-9876771 and the New York State Office of Science, Technology and Academic Research (NYSTAR). Device fabrication was performed in part at the Cornell NanoScale Science and Technology Facility (CNF) with the assistance of Daron Westly. The CNF is a member of the National Nanotechnology Infrastructure Network and the Cornell Center for Materials Research (CCMR), both of which are supported by the NSF.
Footnotes
Supporting Information Available. Detailed fabrication methods, experimental methods, difference equations for numerical solution of unfolding model, and video of unfolding DNA molecule (S-1).
References
- 1.Foquet M, Korlach J, Zipfel W, Webb WW, Craighead HG. Anal. Chem. 2002;74:1415. doi: 10.1021/ac011076w. [DOI] [PubMed] [Google Scholar]
- 2.Reccius CH, Stavis SM, Mannion JT, Walker LP, Craighead HG. Biophys. J. 2008;95:273. doi: 10.1529/biophysj.107.121020. [DOI] [PMC free article] [PubMed] [Google Scholar]
- 3.Tegenfeldt JO, Prinz C, Cao H, Chou S, Reisner WW, Riehn R, Wang YM, Cox EC, Sturm JC, Silberzan P, Austin RH. Proc. Natl. Acad. Sci. 2004;101:10979. doi: 10.1073/pnas.0403849101. [DOI] [PMC free article] [PubMed] [Google Scholar]
- 4.Riehn R, Lu MC, Wang YM, Lim SF, Cox EC, Austin RH. Proc. Natl. Acad. Sci. 2005;102:10012. doi: 10.1073/pnas.0503809102. [DOI] [PMC free article] [PubMed] [Google Scholar]
- 5.Chan EY, Goncalves NM, Haeusler RA, Hatch AJ, Larson JW, Maletta AM, Yantz GR, Carstea ED, Fuchs M, Wong GG, Gullans SR, Gilmanshin R. Genome Research. 2004;14:1137. doi: 10.1101/gr.1635204. [DOI] [PMC free article] [PubMed] [Google Scholar]
- 6.Phillips KM, Larson JW, Yantz GR, D'Antoni CM, Gallo MV, Gillis KA, Goncalves NM, Neely LA, Gullans SR, Gilmanshin R. Nucleic Acids Research. 2005;33:5829. doi: 10.1093/nar/gki895. [DOI] [PMC free article] [PubMed] [Google Scholar]
- 7.Chan EY. Mutation Research. 2005;573:13. doi: 10.1016/j.mrfmmm.2005.01.004. [DOI] [PubMed] [Google Scholar]
- 8.Zwolak M, Di Ventra M. Rev. Modern Phys. 2008;80:141. [Google Scholar]
- 9.Reisner W, Morton KJ, Riehn R, Wang YM, Yu ZN, Rosen M, Sturm JC, Chou SY, Frey E, Austin RH. Phys. Rev. Lett. 2005;94 doi: 10.1103/PhysRevLett.94.196101. [DOI] [PubMed] [Google Scholar]
- 10.Reccius CH, Mannion JT, Cross JD, Craighead HG. Phys. Rev. Lett. 2005;95 doi: 10.1103/PhysRevLett.95.268101. [DOI] [PubMed] [Google Scholar]
- 11.Mannion JT, Reccius CH, Cross JD, Craighead HG. Biophys. J. 2006;90:4538. doi: 10.1529/biophysj.105.074732. [DOI] [PMC free article] [PubMed] [Google Scholar]
- 12.Cabodi M, Turner SWP, Craighead HG. Anal. Chem. 2002;74:5169. doi: 10.1021/ac025879a. [DOI] [PubMed] [Google Scholar]
- 13.Turner SWP, Cabodi M, Craighead HG. Phys. Rev. Lett. 2002;88 doi: 10.1103/PhysRevLett.88.128103. [DOI] [PubMed] [Google Scholar]
- 14.Petrov AS, Harvey SC. Biophys. J. 2008;95:497. doi: 10.1529/biophysj.108.131797. [DOI] [PMC free article] [PubMed] [Google Scholar]
- 15.Jun S, Mulder B. Proc. Natl. Acad. Sci. 2006;103:12388. doi: 10.1073/pnas.0605305103. [DOI] [PMC free article] [PubMed] [Google Scholar]
- 16.Arnold A, Jun S. Phys. Rev. E. 2007;76 doi: 10.1103/PhysRevE.76.031901. [DOI] [PubMed] [Google Scholar]
- 17.Brochard F, de Gennes PG. J. Chem. Phys. 1977;67:52. [Google Scholar]
- 18.Daoud M, de Gennes PG. Journal De Physique. 1977;38:85. [Google Scholar]
- 19.Reisner W, Beech JP, Larsen NB, Flyvbjerg H, Kristensen A, Tegenfeldt JO. Phys. Rev. Lett. 2007;99 doi: 10.1103/PhysRevLett.99.058302. [DOI] [PubMed] [Google Scholar]
- 20.Hsieh CC, Balducci A, Doyle PS. Nano Lett. 2008;8:1683. doi: 10.1021/nl080605+. [DOI] [PubMed] [Google Scholar]
- 21.Zhang C, Zhang F, van Kan JA, van der Maarel JRC. J. Chem. Phys. 2008;128 doi: 10.1063/1.2937441. [DOI] [PubMed] [Google Scholar]
- 22.Turban L. Journal De Physique. 1984;45:347. [Google Scholar]
- 23.Bakajin OB, Duke TAJ, Chou CF, Chan SS, Austin RH, Cox EC. Phys. Rev. Lett. 1998;80:2737. [Google Scholar]
- 24.Perkins TT, Smith DE, Larson RG, Chu S. Science. 1995;268:83. doi: 10.1126/science.7701345. [DOI] [PubMed] [Google Scholar]
- 25.Morse DC. Macromolecules. 1998;31:7044. [Google Scholar]
Associated Data
This section collects any data citations, data availability statements, or supplementary materials included in this article.


