Abstract
Purpose
To evaluate a method for quantifying the effect of setup errors and range uncertainties on dose distribution and dose–volume histogram using statistical parameters; and to assess existing planning practice in selected treatment sites under setup and range uncertainties.
Methods and Materials
Twenty passively scattered proton lung cancer plans, 10 prostate, and 1 brain cancer scanning-beam proton plan(s) were analyzed. To account for the dose under uncertainties, we performed a comprehensive simulation in which the dose was recalculated 600 times per given plan under the influence of random and systematic setup errors and proton range errors. On the basis of simulation results, we determined the probability of dose variations and calculated the expected values and standard deviations of dose–volume histograms. The uncertainties in dose were spatially visualized on the planning CT as a probability map of failure to target coverage or overdose of critical structures.
Results
The expected value of target coverage under the uncertainties was consistently lower than that of the nominal value determined from the clinical target volume coverage without setup error or range uncertainty, with a mean difference of −1.1% (−0.9% for breath-hold), −0.3%, and −2.2% for lung, prostate, and a brain cases, respectively. The organs with most sensitive dose under uncertainties were esophagus and spinal cord for lung, rectum for prostate, and brain stem for brain cancer.
Conclusions
A clinically feasible robustness plan analysis tool based on direct dose calculation and statistical simulation has been developed. Both the expectation value and standard deviation are useful to evaluate the impact of uncertainties. The existing proton beam planning method used in this institution seems to be adequate in terms of target coverage. However, structures that are small in volume or located near the target area showed greater sensitivity to uncertainties.
Introduction
Conventional plan assessment includes checking dose distribution quality (eg, conformity, homogeneity, and cold or hot spots) by overlaying the 3-dimensional dose distribution on patient anatomic images. In addition, volume-specific metrics, such as the mean dose of a volume of interest (VOI), dose–volume histogram (DVH), or other similarly derived quantities (eg,VD, the volume receiving at least dose D), are also used. However, the dose distribution and DVHs in traditional plan review only represent a nominal setting that does not contain uncertainties caused by stopping power uncertainties in CT images, daily patient setup errors, and interfractional and intrafractional anatomy changes. These uncertainties make it difficult to assess plan robustness, especially for proton therapy. Traditionally a geometrically expanded volume, such as the planning target volume (PTV) or the planning risk volume, is used for treatment design and evaluation. For example, under the assumption that dose distribution is static in space and the extent of motion of the clinical target volume (CTV) is contained within the margin of the PTV, PTV coverage can be considered the worst case of CTV coverage. For this reason, PTV is often used in prescribing and reporting rather than the CTV itself. The assumption that dose distribution is static in space is crucial for such interpretation. However, previous studies revealed that this assumption does not apply to protons because of their sensitivity to the density variation in the beam path (1). Therefore, the paradigm of using PTV as a surrogate for CTV under uncertainty does not translate well to proton therapy.
Recently researchers reported evaluation methods that account for both setup and range uncertainties in an effort to assess robustness directly. Lomax (2) and Albertini et al (3) proposed the use of worst-case dose distribution and error–volume histogram that are derived from dose distributions calculated under extreme conditions. Trofimov et al (4) proposed to use the DVH bands to visualize the range of DVH variation under uncertainties. However, these methods rely on dose distributions calculated under a handful of (often extreme) conditions (ie, 6 calculations for setup errors and 2 calculations for under- and overestimated range errors). Although these methods are fast and convenient, the metrics used are generally too conservative and sometimes unrealistic. In other words, these approaches lack the assessment of a large number of scenarios and statistical interpretations. Maleike et al (5) and Henriquez et al (6) proposed methods that fully characterize the probability density function (PDF) of individual point dose distributions to quantify expected value and sttandard deviation of point dose, and similar approaches can be done for DVHs. However, their studies were limited to dose variations caused by predefined organ motion models (5) and dose calculation inaccuracies (6). The influence of setup and range uncertainties was not addressed. Using statistical methods to characterize proton dose uncertainties is difficult because the PDF of a point dose distribution under such uncertainties is not known in advance. Multiple-instance sampling of DVH is necessary because point dose distribution may be spatially correlated. To our knowledge, no studies have been performed to quantify such statistical parameters to assess the effects of setup and range uncertainties on proton plans. In addition, the validity of conventional proton therapy treatment planning methods for various cancer sites needs to be investigated under such rigorous robust analysis. In this study we established a method of estimating PDF of dose distribution under the uncertainties based on a large number of simulations (ie, 600 dose calculations per plan). We compared the nominal DVH with its expected value for several clinical sites.
Methods and Materials
Patient selection and treatment planning
We retrospectively evaluated the clinically approved proton plans of 20 patients with locally advanced non-small cell lung cancer who were randomly selected from the clinical trial protocol, and 10 previously treated prostate cancer cases and 1 brain cancer case. Of the 20 lung cancer patients, 5 were treated with breath-hold technique. Seventeen patients were prescribed to 74 Gy and 3 patients to 60 Gy. LungV20Gy, mean lung dose, esophagus V65Gy and V45Gy, heart V60Gy andV30Gy, and maximum spinal cord dose were considered critical planning parameters. For all prostate cases, dose was prescribed to 78 Gy while rectum V45Gy and V70Gy and bladder V45Gy andV70Gy were recorded. For the brain case, 60 Gy was prescribed to the CTV with maximum dose to brainstem and optical nerves considered as dose-limiting factors.
Passively scattered beam treatment planning was used for all lung cancer patients. The free-breathing lung cancer treatment planning method used in this study was described elsewhere (7). Briefly, the CTV defined at the expiration phase of the 4-dimensional (4D) CT set was contoured and then propagated to other phases using a deformable image registration method. Then the contours at individual phases were combined to form the internal target volume (ITV) for planning (equivalent to CTV without motion). To compensate for the density change due to breathing motion, the time-averaged 4D CT data set (averaged CT) was used for proton dose calculation. In addition, the maximum CT number (Hounsfield Unit or HU) found within the gross tumor volume was used to override the averaged CT image in the motion path of the gross tumor volume. In the previous work 4D dose accumulation showed that this approach can account for the breathing motion in terms of target coverage (7). For breath-hold, CTV from a selected breath-hold CT image set is used instead.
The proton range uncertainty was addressed by adding a margin equivalent to 3.5% of the total water equivalent path length to the proximal and distal ITV surfaces along the beam axis. The setup uncertainty was accounted by expanding the ITV laterally 5 mm with in the beam’s-eye view. The tissue density change along the beam path as a result of the setup error was accounted by smearing the local depth of the compensator with a smearing distance of 5-10 mm in passive scatter plans. For prostate and brain cancer cases, a scanning proton beam with single-field optimization was used. For prostate, CTV to PTV margins were 1.2 cm laterally, 0.6 cm posteriorly to rectum, and 0.8 cm elsewhere. The brain case did not have PTV because of adjacent brainstem.
Statistics and simulation
In this work, cumulative DVH is simply referred to as DVH. AVOI consisted of smaller volume elements or voxels (total number n). A dose to the ith voxel (vi) was considered a random variable (di). If the PDF of di for all n is known, the expected value of DVH or E[DVH] can be derived. For the sake of convenience, the framework and definition used in reference 6 are repeated here in brief. DVH is defined as , where is 1 if di ≥ k; otherwise, it is 0. When we use an expectation value operator we get . Because can be considered a Bernoulli random variable, is equal to the probability, P[di ≥ k], which turns the above equation into
| (1) |
To proceed further, we must determine PDFi. Even though the PDFi is unknown, it can be closely approximated from extensive sampling of point dose values by varying the simulation parameters.
A cumulative dose is the summed dose distribution over all fractions. In calculating one cumulative dose, we first introduce systematic setup error and range error into our dose calculation of all fractions while introducing random setup error at every new fraction. The systematic setup errors were randomly drawn from the Gaussian distribution with the mean at the planning isocenter and standard deviation equal to 2 mm in all x, y, and z directions. Similarly, random setup errors were drawn from Gaussian distribution but with its mean at the simulated systematic error position. A systematic range error was also drawn from the Gaussian function, with standard deviation equal to 1.5% of the nominal CT number-to-stopping power ratio calibration curve. The 2-mm and 1.5% simulation parameters were determined on the basis of our previous experiences (8, 9). Figure 1 shows an example of simulation parameters used in our study.
Fig. 1.
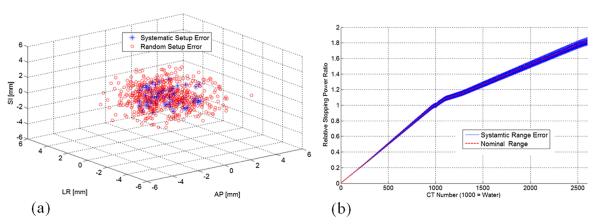
(a) Randomly selected systematic and random setup error coordinates for a selected patient; (b) CT number-to-relative stopping power curve for nominal and with systematic range error.
In this study, we recalculated dose at each fraction by introducing random setup error for a total of 10 fractions. These doses were summed together to represent one cumulative dose per course of treatment. Sixty cumulative doses were simulated for each patient to represent 60 combinations of systematic errors and range uncertainties. This results in total of 600 dose calculations per given plan.
We evaluated the convergence of the E[DVH] as a function of simulated number of treatment courses and fractions, and we found that the influence of the uncertainty over treatment fractions converged when 60 treatment courses composed of 10 fractions are simulated (Fig. 2). Although the actual treatment course consisted of 37 fractions (for lung cancers), the effect of random setup error converges quickly, as indicated in Figure 2a. Therefore, we chose to use 10 fractions to simulate the random setup error for all courses.
Fig. 2.
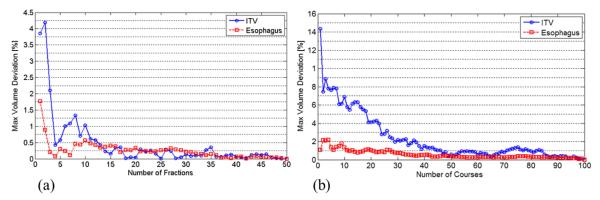
Convergence of estimated E[DVH] value for a selected patient as a function of (a) number of fractions and (b) number of courses for internal target volume (ITV) and esophagus. (b) Approximately 60 cumulative dose samples that consist of 10 fractions were needed to contain the maximum deviation in convergence value of E[DVH] within 1%.
Despite the imposed limit on simulation counts, 600 dose calculations per given plan is too time-consuming if doses were calculated from the treatment planning system. Therefore, dose distributions were approximated using a fast dose calculation method (10). The fast dose calculation method approximates new proton dose from the precomputed nominal dose distribution by taking into account the perturbation of radiologic path length caused by an isocenter shift or stopping power uncertainties. The details of this algorithm and its validation were described elsewhere (10). On the basis of these sample dose distributions, the PDFi in Equation 1 was approximated to compute E[DVH] of various VOIs. The standard deviation of DVH or SD[DVH] was estimated using following definition of sample the standard deviation:
| (2) |
where N is the number of sampled dose distributions over the courses (N=60). We compared the DVH under nominal setting (N[DVH]) against E[DVH] to assess whether what you see on the treatment plan is what you would get under the influence of uncertainties. Furthermore, we plotted the area extended by one SD[DVH] to gauge the likelihood of obtaining E[DVH] for any given simulation.
Probability map of risk
The above method predominantly addresses uncertainties in DVHs or volumetric parameters. However, a thorough plan assessment involves checking dose distribution spatially with respect to patient anatomy. To spatially visualize dose uncertainty, we implemented a similar method, described by Maleike et al (5). We visualized the probability of a given voxel not meeting the clinical dose constraint. For example, we computed the probability of each voxels within the ITV not receiving the prescribed dose (ie, 74 Gy). To associate these probability values in a spatially meaningful way, we scaled the probability to a color band ranging from 0% to 100% (ie, 50% meaning the probability of a voxel receiving the prescription dose is 50%) and mapped them on the CT images for 3-dimensional risk assessment.
Software implementation
Software was implemented as a plug-in module to the CERR (A Computational Environment for Radiotherapy Research) (11) (version 4.0, beta 2) on an Intel Xeon X5680 3.33-GHz central processing unit-based computer. The computation time for 1 patient was approximately 15-20 minutes.
Results
PDF, DVH, and volumetric parameter assessment
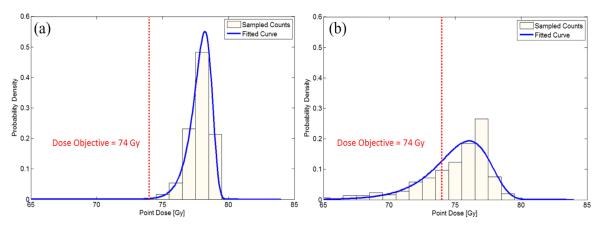
Figure 3 shows an example of PDF at 2 independent dose voxels. The probability of a given voxel not meeting the clinical dose constraint at 74 Gy is shown for a lung cancer patient. The first point is near the center of the ITV, which shows that the probability of not meeting the target dose is near zero (Fig. 3a). The second point is near the periphery of the ITV, and there is a good chance that the dose at this point would be lower than the target dose (Fig. 3b).
Fig. 3.
Approximated PDF of dose is shown for (a) voxel located centrally within the internal target volume (ITV) and (b) voxel near the outer bound of ITV. The centrally located voxel shows no chance of receiving less than the prescription dose (red vertical dotted line). Contrarily, the outer voxel shows significant chance of receiving a lower prescription dose.
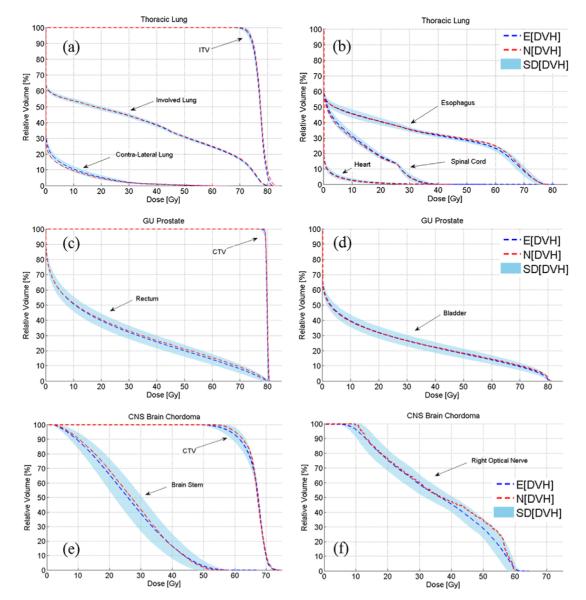
For each patient, we can visualize and quantify the variation in DVHs that resulted from setup and range uncertainties. The E[DVH], which represents the unbiased estimate of the true DVH, was compared with the DVH computed under the nominal setting (N[DVH]). Figure 4 shows the side by side comparison between the E[DVH] and N[DVH] for various target volumes and organs at risk (OARs) along with the shaded area covered by one standard deviation (SD[DVH]).
Fig. 4.
Comparing the N[DVH] of various volumes of interest derived under nominal setting (red dashed lines) and E[DVH] derived under uncertainties (blue dashed lines) for lung (a, b), prostate (c, d), and brain cases (e, f). The one standard deviation SD[DVH] confidence interval is also shown. CNS = central nervous system; GU = genitourinary.
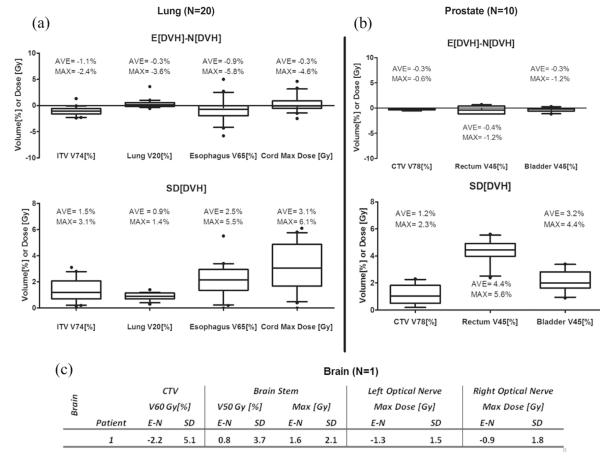
The statistical assessment of volumetric parameters used during treatment planning for all patients is summarized in Figure 5. Here, we compared the difference between the E[DVH] and N[DVH], denoted E-N for brevity. For lung, the average E-N of ITV V74Gy coverage under uncertainties was only −1.1% lower than that calculated under the nominal plan with the average standard deviation of 1.5%. This means that on average, the most likely ITV coverage under simulated uncertainties is approximately 1.1% less than what was observed originally without any uncertainty. The 1.5% standard deviation can be interpreted as 68% chance at which the ITV coverage can be less or greater than 1.5% (ie, this is only an approximation because the distribution here is not entirely normal). The results were similar for the breath-hold group. Of 20 patients, only 1 showed more than 3% deviation from nominal dose under uncertainties, indicating that our treatment planning method provides robust target coverage under setup and range error. For the V20Gy of total lung and mean lung dose, the expected values were identical to the nominal values, with a standard deviation of less than 1.4% on average. Despite the fact that the dose perturbation is most pronounced in lung owing to low tissue density, the effect on volumetric parameters was not seen because of its large volume washout. On the other hand, the esophagus and spinal cord doses experienced substantial fluctuations, with a maximum standard deviation of up to 5.5% and 6.1 Gy, respectively. For prostate, the CTV coverage was unaltered, with an average E-N value of −0.3%, indicating that there is almost no effect on target coverage under uncertainties. However, for rectum, on average, one standard deviation of V45Gy was 5.6%, indicating that the rectum dose shown at the nominal plan could potentially fluctuate significantly, making it harder to predict the true delivered dose. In terms of target coverage, the brain case was least robust, with an SD of the prescription dose level of CTV up to 5.1%.
Fig. 5.
Showing expected versus nominal values for dose objectives parameters and their standard deviations for (a) lung group, (b) prostate group, and (c) a brain case.
Probability map of risk
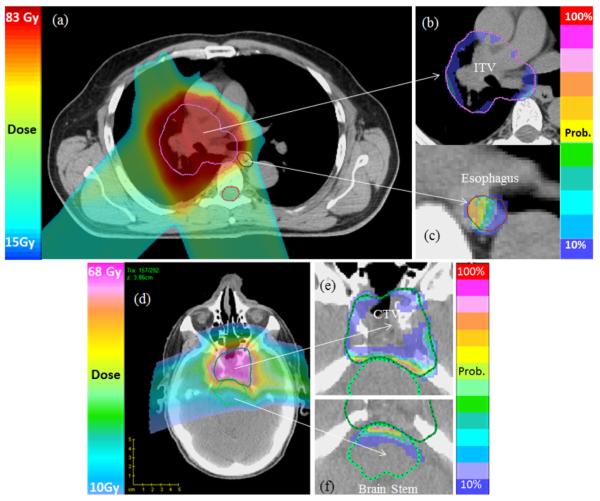
A probability map showing the likelihood of not meeting the plan’s dosimetric goal for an individual voxel is visualized together with CT images in Figure 6. For such visualization, first, the dose objective of the VOI must be specified. On the basis of the predefined dose objective, the probability of achieving it is computed by integrating the area under the point dose PDFi (Fig. 3). Here the higher score of the probability means it is less likely to meet the planning goal. As expected, Figure 6 shows high scores of risk near the boundary between the target volume and adjacent OARs.
Fig. 6.
Probability map for selected cases. The nominal plan dose distributions for a lung and a brain cancer case are shown in (a) and (d). The probability of not receiving the prescribed dose to the internal target volume (ITV) or clinical target volume (CTV) because of uncertainties is shown in (b) and (e). The probability of exceeding the specified dose constraint on esophagus and brainstem is shown in (c) and (f).
Discussion
In this study we used a direct simulation technique to evaluate the statistical performance of clinical proton plans under random and systematic setup errors and range uncertainties. We found that for the selected lung plans, the expected value of prescription dose coverage to the ITV (CTV for breath-hold) was consistently lower than the nominal value without uncertainty. However, the difference was acceptable (the maximum is only −2.4% for a lung cancer case, as shown in Fig. 5), indicating that the current passively scattered proton planning method is adequate for retaining target coverage under the setup and range uncertainties. Furthermore, we showed that the scanning-beam prostate plans designed by the single-field optimization method were robust against setup and range uncertainties (Fig. 5 shows that the maximum difference between the expected and nominal target coverage for prostate site is only −0.6%), indicating that the margins are adequate and might be too conservative. A single brain case, however, showed a greater degree of sensitivity in terms of target coverage and sparing adjacent OARs under uncertainties, primarily owing to the proximity of the 2 competing volumes that forced the plan to be designed using a much tighter margin.
Interpretation of results
The chief advantages of a statistical method and a large number of samples for evaluating plan robustness are 2-fold: (1) its prediction is more realistic; and (2) use of familiar statistical parameters, such as expected value and standard deviation of doses and DVHs. E[DVH] is an unbiased estimator that can be interpreted as the most probable DVH under uncertainties; thus, it is more suitable for evaluating and reporting the treatment plan than the nominal DVH, which describes the best-case scenario (without any uncertainty). The SD[DVH] can be interpreted as the sensitivity to uncertainties or the robustness of the plan. The value of SD[DVH] can be used to measure the risk of DVH deviating from the expected value. In our study the overall E[DVH] of the ITV and CTV for all patients were close to the prescription dose level, and the standard deviation was mostly acceptable, demonstrating that our existing treatment planning procedure is adequate. However, the esophagus and spinal cord for lung, rectum for prostate, and brainstem showed significant fluctuation in DVH values under uncertainties. In general, we found that the VOI with small absolute volume and location near a primary target volume is more sensitive to uncertainties. In selected cases, we also found that poor nominal target coverage (for example, PTV coverage <95% or CTV <98%) tends to produce a large difference between E[DVH] and N[DVH]. Therefore, a large difference between E[DVH] and N[DVH] may imply inadequate margin. Unfortunately, we could not quantify the threshold in this group of clinically treated patients for whom margins seemed to be adequate.
Limitations
One of the limitations of this study was that we did not consider intrafractional and interfractional changes in anatomy. In theory our method can incorporate the uncertainties associated with breathing motion by using different phases of the 4D CT data set to formulate a more comprehensive PDF of point dose distributions. However, this will require deformable dose accumulation, and anatomic changes over the course of treatment are difficult to predict and remain a challenge. Additionally, the fast proton dose calculation algorithm carries its own uncertainty, especially when a large anatomic change occurs. The reported maximum error in DVH introduced by our dose calculation for a single dose calculation was roughly 1.5% to 2.7% (9).
Conclusions
In this study, we demonstrated that direct plan evaluation can be performed with a fast dose calculation method. Plan evaluation can be quantified in terms of expected values under various uncertainties and standard deviations to indicate the sensitivity to uncertainties. The dose uncertainties as a result of setup and range errors can be visualized using a color-coded probability map of different risk factors (for example, the risk for not reaching the prescribed target dose). The proposed method can be used to evaluate previously approved clinical plans to access the adequacy of margins and the plan’s sensitivity against setup and range errors. We found that the current treatment planning procedure in our institution was robust in terms of maintaining target coverage under assumed setup and range uncertainties in typical lung and prostate cancer cases. However, we also found that the dose to OARs such as spinal cord, esophagus, and rectum varied significantly and therefore requires more careful assessment at the time of planning.
Summary.
Assessing proton treatment plan under uncertainties is important to avoid unexpected deviations from the original design. In this study, a statistical approach based on comprehensive simulation of setup and range uncertainties is used to evaluate the integrity of proton therapy plans of various clinical sites.
Acknowledgments
This project is supported by grant P01CA021239 from the National Cancer Institute.
Footnotes
Conflict of interest: none.
References
- 1.Engelsman M, Kooy HM. Target volume dose considerations in proton beam treatment planning for lung tumors. Med Phys. 2005;32:3549–3557. doi: 10.1118/1.2126187. [DOI] [PubMed] [Google Scholar]
- 2.Lomax AJ. Intensity modulated proton therapy and its sensitivity to treatment uncertainties 2: The potential effects of inter-fraction and inter-field motions. Phys Med Biol. 2008;53:1043–1056. doi: 10.1088/0031-9155/53/4/015. [DOI] [PubMed] [Google Scholar]
- 3.Albertini F, Hug EB, Lomax AJ. Is it necessary to plan with safety margins for actively scanned proton therapy? Phys Med Biol. 2011;56:4399–4413. doi: 10.1088/0031-9155/56/14/011. [DOI] [PubMed] [Google Scholar]
- 4.Trofimov A, Unkelbach J, DeLaney TF, et al. Visualization of a variety of possible dosimetric outcomes in radiation therapy using dose-volume histogram bands. Prac Radiat Oncol. 2012;2:164–171. doi: 10.1016/j.prro.2011.08.001. [DOI] [PMC free article] [PubMed] [Google Scholar]
- 5.Maleike D, Unkelbach J, Oelfke U. Simulation and visualization of dose uncertainties due to interfractional organ motion. Phys Med Biol. 2006;51:2237–2252. doi: 10.1088/0031-9155/51/9/009. [DOI] [PubMed] [Google Scholar]
- 6.Henriquez FC, Castrillon SV. A novel method for the evaluation of uncertainty in dose-volume histogram computation. Int J Radiat Oncol Biol Phys. 2008;70:1263–1271. doi: 10.1016/j.ijrobp.2007.11.038. [DOI] [PubMed] [Google Scholar]
- 7.Kang YX, Zhang XD, Chang JY, et al. 4D proton treatment planning strategy for mobile lung tumors. Int J Radiat Oncol Biol Phys. 2007;67:906–914. doi: 10.1016/j.ijrobp.2006.10.045. [DOI] [PubMed] [Google Scholar]
- 8.Yang M, Zhu XR, Park PC, et al. Comprehensive analysis of proton range uncertainties related to patient stopping-power-ratio estimation using the stoichiometric calibration. Phys Med Biol. 2012;57:4095–4115. doi: 10.1088/0031-9155/57/13/4095. [DOI] [PMC free article] [PubMed] [Google Scholar]
- 9.Arjomandy B, Sahoo N, Ciangaru G, et al. Verification of patient-specific dose distributions in proton therapy using a commercial two-dimensional ion chamber array. Med Phys. 2010;37:5831–5837. doi: 10.1118/1.3505011. [DOI] [PubMed] [Google Scholar]
- 10.Park PC, Cheung J, Zhu XR, et al. Fast range-corrected proton dose approximation method using prior dose distribution. Phys Med Biol. 2012;57:3555–3569. doi: 10.1088/0031-9155/57/11/3555. [DOI] [PMC free article] [PubMed] [Google Scholar]
- 11.Deasy JO, Blanco AI, Clark VH. CERR: A computational environment for radiotherapy research. Med Phys. 2003;30:979–985. doi: 10.1118/1.1568978. [DOI] [PubMed] [Google Scholar]


