Abstract
Objective:
Recently introduced energy-sensitive X-ray CT makes it feasible to discriminate different nanoparticulate contrast materials. The purpose of this work is to present a K-edge ratio method for differentiating multiple simultaneous contrast agents using spectral CT.
Methods:
The ratio of two images relevant to energy bins straddling the K-edge of the materials is calculated using an analytic CT simulator. In the resulting parametric map, the selected contrast agent regions can be identified using a thresholding algorithm. The K-edge ratio algorithm is applied to spectral images of simulated phantoms to identify and differentiate up to four simultaneous and targeted CT contrast agents.
Results:
We show that different combinations of simultaneous CT contrast agents can be identified by the proposed K-edge ratio method when energy-sensitive CT is used. In the K-edge parametric maps, the pixel values for biological tissues and contrast agents reach a maximum of 0.95, whereas for the selected contrast agents, the pixel values are larger than 1.10. The number of contrast agents that can be discriminated is limited owing to photon starvation. For reliable material discrimination, minimum photon counts corresponding to 140 kVp, 100 mAs and 5-mm slice thickness must be used.
Conclusion:
The proposed K-edge ratio method is a straightforward and fast method for identification and discrimination of multiple simultaneous CT contrast agents.
Advances in knowledge:
A new spectral CT-based algorithm is proposed which provides a new concept of molecular CT imaging by non-iteratively identifying multiple contrast agents when they are simultaneously targeting different organs.
Despite remarkable advances in diagnostic and therapeutic procedures during the past two decades, annual reports still indicate that cancer remains a challenging disease all over the world. To reduce the morbidity and mortality caused by cancer and many other diseases, endeavours spanning technological innovations in imaging systems to the development of nanoparticulate (NP) materials aim at improving clinical diagnosis and therapy planning. Numerous high-atomic-number agents have been investigated for X-ray imaging applications, such as bismuth [1], gold [2], platinum [3], tungsten [4], tantalum [5], hafnium [6], lutetium [7], ytterbium [8], erbium [9], holmium [10], osmium [10] and gadolinium [11]. Moreover, NP CT contrast agents proved to be promising in the context of molecular imaging owing to their higher diagnostic efficacy than current contrast agents [12–14]. Targetability and high circulation time in vivo make it possible to use multiple contrast agents simultaneously and integrate multiple phases of diagnostic imaging in a single scan. This may decrease CT radiation dose, drug dose and diagnosis time, with higher sensitivity and specificity [12].
Although the use of multiple high-atomic-number contrast agents may improve the efficiency of clinical diagnosis, it would require differentiation of the contrast agents used simultaneously. However, owing to the wide range of atomic numbers and concentrations in the body, conventional CT that uses an integrating detection system is unlikely to be capable of differentiating between multiple contrast agents when injected simultaneously or when using multifunctional agents [15]. In such cases, without correct identification, it is unlikely to achieve the main goal of molecular CT imaging.
It has been shown that energy-dependent information on attenuation coefficients can be used as a metric to identify and discriminate different tissues and materials. Alvarez and Macovski [16] used an energy-dependent representation of attenuation coefficients using energy sensitive CT. Lehmann et al [17] proposed a dual-tube potential algorithm based on scanning using two different X-ray spectra called dual-energy imaging, in which the attenuation coefficient function was decomposed into basis material functions. On the basis of the materials decomposition method, the attenuation coefficient is written as a linear combination of basic functions.
In recent years, CT with energy sensitive detection systems (spectral CT) has attracted considerable attention. In spectral CT, the transmitted X-ray spectrum is compartmentalised into several finite energy bins and the data of each bin are used to generate an image of the corresponding energy window [18,19]. Selective imaging of contrast agents using the K-edge energy using energy-resolved CT was first investigated by Riederer and Mistretta [20]. Subsequently, the decomposition of the attenuation coefficient has been evaluated for identification of contrast agents in projection space [21,22] and in image space [23]. The common idea among all these attempts is to solve a system of equations to obtain the coefficient of each material contribution to the total attenuation coefficient at two or multiple energies.
In this work, we propose a straightforward method using spectral CT data. This approach is analytically simple and generates selective contrast agent images quickly. The calculations are performed in image space to identify and differentiate multiple simultaneous contrast agents using an analytical CT simulator.
MATERIALS AND METHODS
Theoretical background
Within the diagnostic X-ray energy range, the linear attenuation coefficient (LAC) decreases with increasing photon energy, except at absorption edges such as K-edge, where the LAC undergoes a sudden jump. Moreover, with increasing atomic numbers, the energy of the K-edge increases. In the context of contrast enhancement in conventional X-ray imaging, only the atomic number (Z) and mass density (ρ) of contrast agents are important.
In addition to the Z and ρ of contrast agents, two other parameters affect image quality and diagnostic efficiency when multiple contrast agents are used simultaneously: (i) energy of the K-edge and (ii) absorption jump ratio. The K-edge energy is an important factor since this energy determines the acquisition protocol on the detector side when spectral CT is used for discrimination between multiple contrast agents [18,19]. The absorption jump ratio is also important because it provides the potential to identify and discriminate a particular contrast agent from body tissues and from other contrast agents. The absorption jump ratio can be defined as the ratio of the attenuation coefficients slightly above and below the K-edge energy:
 |
(1) |
where  and
and  represent the total mass attenuation coefficient just above and below the K-edge energy, respectively.
Proposed K-edge ratio method
Our proposed algorithm is based on the K-edge ratio method. In this technique, two energy bins on both sides of the K-edge energy of the selected contrast agents are defined, and the ratio of the relevant reconstructed images is calculated. The result is a “parametric map” (virtual image) in which each pixel is equal to the ratio of the corresponding pixels in the bin images:
 |
(2) |
where Image(bini) and Image(binj) are the images reconstructed from data of energy windows bini and binj placed below and above the K-edge energy of the selected contrast agents, respectively. In this parametric map, pixels in the contrast agent region have larger values than all other pixels owing to the sudden increase of LAC at the K-edge of selected contrast agents. Pixels relevant to all biological tissues exhibit values <1.0 in the RK-edge parametric map, owing to the decrease of attenuation coefficients with energy. This phenomenon instigates the differentiation between contrast agents in the corresponding parametric map.
In the case of administering and targeting simultaneous contrast agents, it is crucial to define proper energy windowing in the CT acquisition system for K-edge imaging. This means that an appropriate energy binning framework must be considered to identify all contrast agents. To this end, a priori knowledge of the administered contrast agents is required.
The location and width of energy bins must be adjusted depending on several factors such as the signal-to-noise ratio (SNR), total number of contrast agents or energy resolution of the detector. Depending on the clinical aim of the targeted molecular imaging probe, various combinations of simultaneous contrast agents may be administered. Table 1 summarises some examples of possible combinations. The images corresponding to energy bins (bin images) are individually reconstructed. To obtain an image with low quantum noise and high contrast-to-noise ratio, one additional image is reconstructed from the entire X-ray spectrum (diagnostic image). The bin images are used only for RK-edge parametric map generation to provide the possibility of contrast agent identification. The RK-edge parametric maps are generated using the reconstructed bin images according to Equation (2). For example, for Combination 1 in Table 1, the parametric maps relevant to europium, ytterbium, osmium and thallium contrast agents are obtained by calculating R48.5, R61.3, R73.9 and R85.5, respectively. Owing to the clarity of the pixels that represent the selected contrast agent in the parametric maps, the contrast agent region can be simply segmented using thresholding. To distinctively highlight the contrast agents, we use the colour overlaying technique on the diagnostic image.
Table 1.
Examples of possible combinations of simultaneous contrast agents
| Combination | Contrast agents |
| 1 | Europium, ytterbium, osmium, thallium |
| 2 | Gadolinium, hafnium, gold |
| 3 | Terbium, hafnium, platinum, bismuth |
| 4 | Holmium, tungsten, bismuth |
Analytical CT simulator
Evaluation of CT scanner performance using analytical simulation techniques has been successfully carried out in a number of studies and continues to be an active research topic [24,25]. In this study, an analytic model of fan-beam CT with 912 detector elements placed on an arc geometry was implemented and validated through comparison with experimental results. The X-ray tube focal spot to isocenter and to detector distances have been set to 540 mm and 950 mm, respectively. The fan angle has been set to 56°, which is consistent with the 1.02 mm width for each element of the detector arc. The above-mentioned parameters have been set to be consistent with a typical clinical CT system [26].
In our analytical model, the initial X-ray spectrum I0(E), generated by the X-ray tube, was calculated from the X-ray beam attenuation equation:
| (3) |
where Ir(E) is the discrete X-ray spectrum containing intensity of photons per energy in photons mAs−1 mm–2 obtained from the IPEM Report No. 78 [27], in which the effect of X-ray tube current-time mAs and potential kVp are considered for spectrum calculation. μAl(E) is the LAC of aluminium at energy E. xAl is aluminium equivalent filtration thickness representing inherent and additional X-ray tube filters in total. The collimator opening is represented by A (mm2), which varies with slice thickness.
The projections were calculated around the defined phantoms (described in the next section) in 0.4° angular steps for one full rotation. The initial X-ray spectrum I0(E) was transmitted through the object in each angular step to generate the raw projections matrix. The detection system was designed to enable the acquisition of the attenuated data in spectral (pulse) mode such that
 |
(4) |
where P(E) represents the geometric projections matrix of the object at energy E. Id(binn) is the raw data (same size as P matrix), which represents the detected photon intensity limited to energy binn with ln and hn energy thresholds. The bin number, n, and the energy thresholds can be customised by the user. The detection efficiency of the detector as a function of energy is designated as f(E), whereas w(E) is the energy weighting factor that converts the energy of photons to the signal generated by the detector. Energy weighting algorithms and appropriate modelling of the detection system have been already reported. It has been shown that the SNR can be improved by weighting X-ray photons according to their energies in energy-resolved CT compared with energy-integrating weighting [28], although this might introduce CT number inaccuracies, owing to spectrum tailing [29]. In this study, the detected photons were calculated without energy weighting to simulate pure photon counting mode.
The detection efficiency in the actual situation varies by the materials and technology used to manufacture the detector. However, to generalise our investigation, we assumed that f(E) behaves as a flat function vs energy with an ideal value of 1.0. Therefore, the energies of all photons incident on the detector are recorded as they are.
Based on the above, each element of Id(binn) represents the detected photons intensity in a specific angular step and a detector channel. By adding Poisson noise to each element of Id(binn) matrix according to its value and applying a beam hardening correction function, the final attenuated intensity matrix I(binn) was generated. The line integral along ray paths of the projections, Ln(binn) are then calculated as follows:
 |
(5) |
where I0(binn) is the acquired detected photon intensity in the absence of an object in the scanning area. A built-in filtered backprojection (FBP) function for fan-beam geometry implemented in MATLAB® (MathWorks, Inc., Natick, MA) is then used to reconstruct the L(binn) into 512×512 image matrix:
| (6) |
where Image(binn) is the reconstructed image corresponding to the detected photons inside the binn.
We experimentally scanned various concentrations of the dipotassium hydrophosphate (K2HPO4) and iodine contrast agent inserted in a physical phantom, similar to the one used in simulation studies, to validate the model. For experimental examinations, we used a GE VCT 64-slice CT system (GE Healthcare, Milwaukee, WI). Experimental and simulation results were compared in terms of CT numbers and noise in the regions of interest defined over three categories of regions: (i) those containing various K2HPO4 concentrations, (ii) those with various concentrations of iodine contrast agent and (iii) water background.
Phantoms and materials
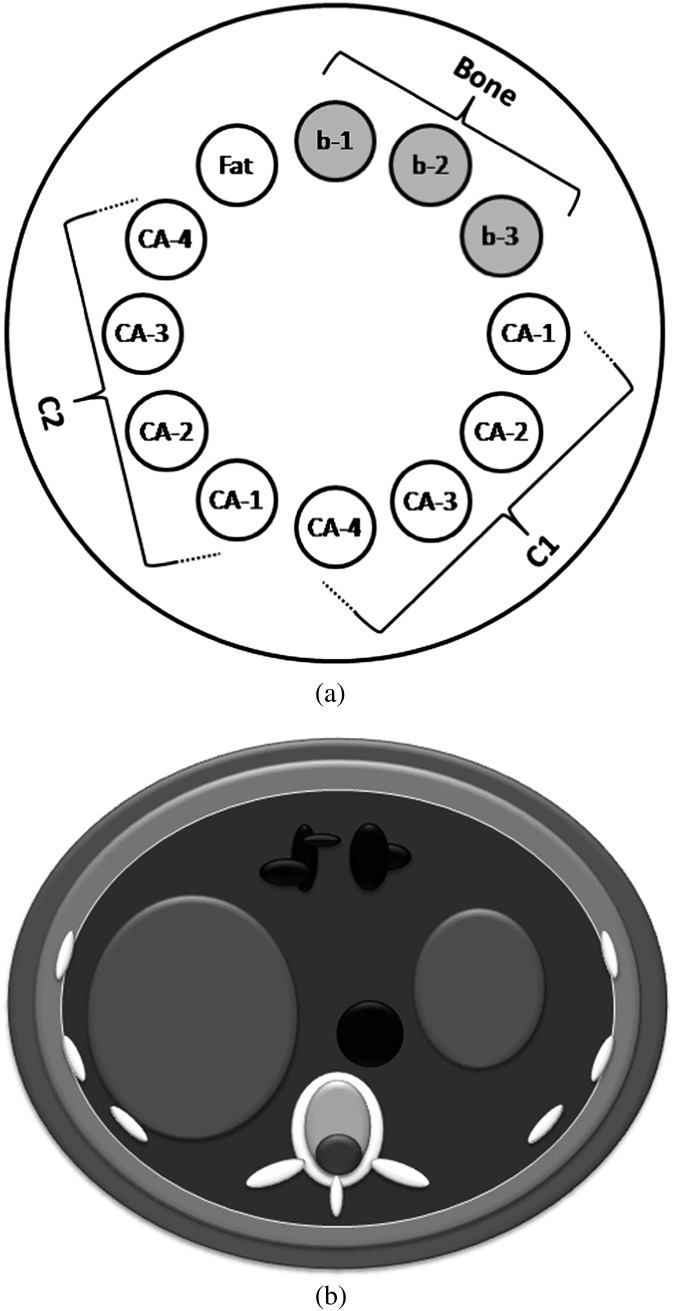
Three shape-based computerised phantoms were numerically designed in the simulation code: (i) a 250-mm diameter cylindrical phantom filled with water for calibration and beam hardening correction, (ii) a 250-mm diameter cylindrical multicontrast phantom with 12 cavities filled with different concentrations of bony and contrast materials for testing our algorithm (Figure 1a) and (iii) an anthropomorphic abdomen phantom for targeted contrast agent illustration (Figure 1b). Simple and more complex numeric phantoms have been extensively used for analytical CT simulation [30,31]. However, for evaluation of our K-edge ratio method, it was required to design particular phantoms in which multiple simultaneous contrast agents with different concentrations could be inserted. For this purpose, an anthropomorphic abdomen phantom consisting of an elliptical cylinder with 410 mm width and 330 mm height including the liver, stomach, colon and aorta that could be filled with contrast agents was designed (Figure 1b).
Figure 1.
Illustration of the computerised phantoms: (a) multicontrast phantom and (b) anthropomorphic phantom.
The following formula was used to acquire the projection P along the ray path S, used in Equation (4):
 |
(7) |
where μ(E) is the two-dimensional matrix corresponding to the distribution of LACs at energy E of the computerised phantom. θ and t represent the projection angle and radial co-ordinate, respectively. Using the same geometrical setting mentioned in the previous section, the sinogram P was generated for all designed computerised phantoms using a built-in MATLAB function.
The attenuation coefficient data of materials and tissues used in the phantoms were calculated using the WinXCom software [32]. To simulate a variety of bone tissues, we used K2HPO4 solutions. We considered seven different high atomic number materials: europium (Eu), gadolinium (Gd), ytterbium (Yb), hafnium (Hf), osmium (Os), gold (Au) and thallium (Tl) as potential X-ray contrast agent candidates. Other high-atomic-number elements not covered in this work can be also considered and differentiated using the proposed approach in the same manner. The LACs of simulated materials (μS) were calculated using the following mixture rule:
| (8) |
where wi and σi are the mass fraction and mass attenuation coefficient of the ith element in the solution. ρS represents the solution mass density.
Matched linear attenuation coefficients examination
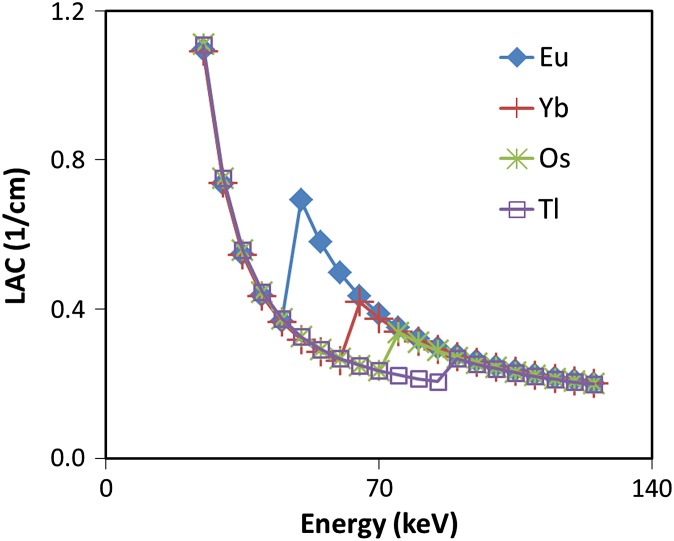
To generate matched LACs, concentrations of materials were purposefully tuned such that their LACs match except near K-edge energies. To this end, two groups of concentrations were calculated (Table 2) such that in each group, the contrast agents exhibited similar pixel intensities at energies far from their K-edge (Figure 2). Such cases constitute the worst-case scenario, in which it is difficult to differentiate contrast agents using conventional CT imaging.
Table 2.
Two levels of concentrations that exhibit matched linear attenuation coefficient vs energy (see Figure 2)
| Contrast agents | CL (mg ml−1) | CH (mg ml−1) |
| Europium | 12.6 | 25.2 |
| Gadolinium | 11.9 | 23.9 |
| Ytterbium | 9.4 | 18.8 |
| Hafnium | 8.5 | 17.1 |
| Osmium | 7.7 | 15.4 |
| Gold | 6.8 | 13.6 |
| Thallium | 6.4 | 12.8 |
Figure 2.
Plot of linear attenuation coefficient (LAC) vs energy of four contrast agents with CH concentrations (see Table 2). The concentration of materials is purposefully adjusted to match their LACs vs energy.
The elements Eu, Yb, Os and Tl (Combination 1) were inserted at the 3, 4, 5 and 6 o’clock positions of the multicontrast phantom with CL concentration and at the 7, 8, 9 and 10 o’clock positions with CH concentrations. Fatty material was inserted at the 11 o’clock position, whereas bony materials with concentrations of 300, 700 and 1000 mg ml−1 of K2HPO4 were inserted at the 12, 1 and 2 o’clock positions, respectively (Figure 2a). Spectral CT images of the phantom were generated using an appropriate acquisition protocol.
Targeted contrast agents examination
Gd, Hf and Au (Combination 2) were inserted in the anthropomorphic phantom to model targeted contrast agents: Gd targeting the liver and stomach tumours, Hf for blood pool and targeting colon tumours and Au targeting aortic wall adjacent to a calcification region. Spectral CT images of this phantom were generated using an appropriate acquisition protocol.
Noise and beam hardening
Narrowing the energy bins might improve identification of the materials but would produce stronger quantum noise in the reconstructed images, owing to a decrease in the number of photons that contribute to the resulting images. Two types of image quality degradations may occur, owing to insufficient number of photons in multienergy CT imaging: contrast degradation as a consequence of high quantum noise and severe beam hardening artefact in the presence of high concentration of high-atomic-number materials such as contrast agents. Consequently, it would be more reasonable to use an image reconstructed from the entire X-ray spectrum for diagnosis and the bin images only for differentiation of the materials.
The effect of energy bin width on image noise and optimisation of bin size in multi-energy CT have been investigated elsewhere [22,33,34]. We evaluated the effect of multiplication of mAs and slice thickness value (mAsT) on the K-edge ratio parametric map quality. We used a fixed tube voltage of 140 kVp, maximum current-time of 200 mAs and maximum slice thickness of 20 mm to avoid exceeding the standard CT dose index in clinical trials [35]. We measured the noise in the background in the parametric maps of the multicontrast phantom for a wide range of mAsT.
RESULTS
On average, the percentage relative differences between simulated and experimental CT numbers were 8.3%, 7.5% and 8.0% for bone; 12.1%, 10.3% and 7.8% for contrast agent and 16.6%, 3.6% and 5.2% for water background at 80 kVp/500 mAs, 120 kVp/250 mAs and 140 kVp/125 mAs, respectively. The percentage relative difference between simulated and experimental noise values varies between 2% and slightly <26% for the above-mentioned tube potential and mAs values.
Acquisition protocol
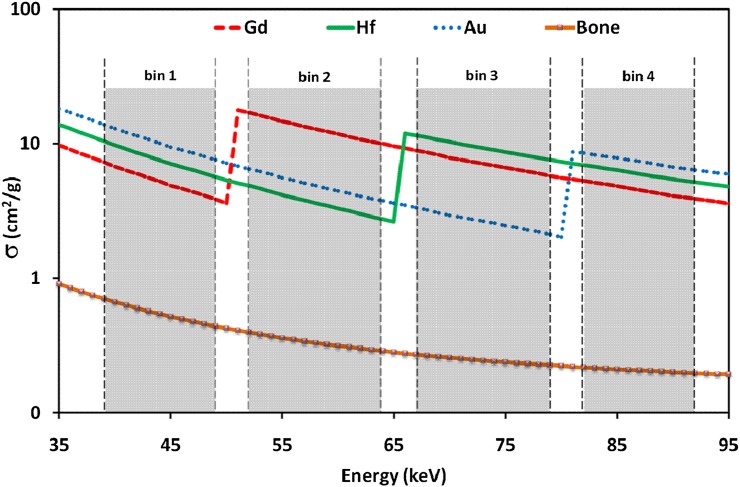
For four simultaneous contrast agents (Combination 1), at least five energy bins are required, where three of the bins are used in common. Bin2 was used as above K-edge bin for R48.5=bin2/bin1, relevant to europium, and at the same time, it was used as below K-edge bin for R61.3=bin3/bin2, relevant to ytterbium. Similarly, there were three common bins in Combination 2, where there is a total of four bins, owing to fewer contrast agents. A schematic of the designed acquisition protocol for Combination 2 is illustrated in Figure 3.
Figure 3.
Graphical scheme of the acquisition protocol for identification of three simultaneous contrast agents.
Contrast agent identification
Matched linear attenuation coefficients
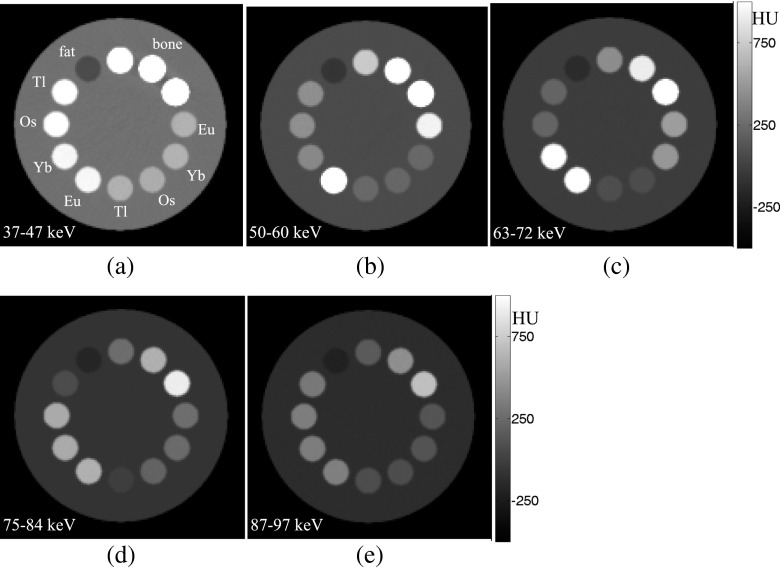
The bin images of the multicontrast phantom, when two matched concentration groups of Eu, Yb, Os, and Tl are inserted in the phantom, are shown in Figure 4. It can be seen that in the image of bin1 with 37–47 keV energy range (Figure 4a), all contrast agents have almost identical grey levels because we purposefully adjusted their concentrations to produce matched LACs. However, in the image relevant to bin2 with 50–60 keV energy range (Figure 4b), which is placed above the Eu K-edge energy, the pixel intensities of regions containing Eu (at 3 and 7 o’clock) are highlighted. Similarly, in bin3 with a 63–72 keV energy range (Figure 4c), bin4 with a 75–84 keV energy range (Figure 4d) and bin5 with a 87–97 keV energy range (Figure 4e), regions corresponding to Yb, Os and Tl are highlighted, respectively. Note that in the bin5 image, all contrast agents have, again, almost identical grey levels because its energy is higher than the largest K-edge energy of these four materials. Pixel intensities of regions containing bony and fatty materials continuously decrease when the energy increases from bin1 to bin5, owing to the absence of their K-edge in the energy range of the images.
Figure 4.
(a–e) Bin images corresponding to bin1 to bin5, respectively, of the multicontrast phantom filled with two levels of concentration of europium (Eu), ytterbium (Yb), osmium (Os) and thallium (Tl) materials. All images have the same greyscale shown in (e).
The RK-edge parametric maps R48.5, R61.3, R73.9 and R85.5 for the above-mentioned examinations were generated. We observed that all pixels inside the regions containing the corresponding contrast agents were noticeably brighter than other regions. As these pixels have values >1.0, they can be simply segmented using a threshold of 1.0 to the pixel intensities of the parametric maps. The parametric maps can also be independently reviewed by radiologists and oncologists for diagnosis and treatment planning.
Targeted contrast agents
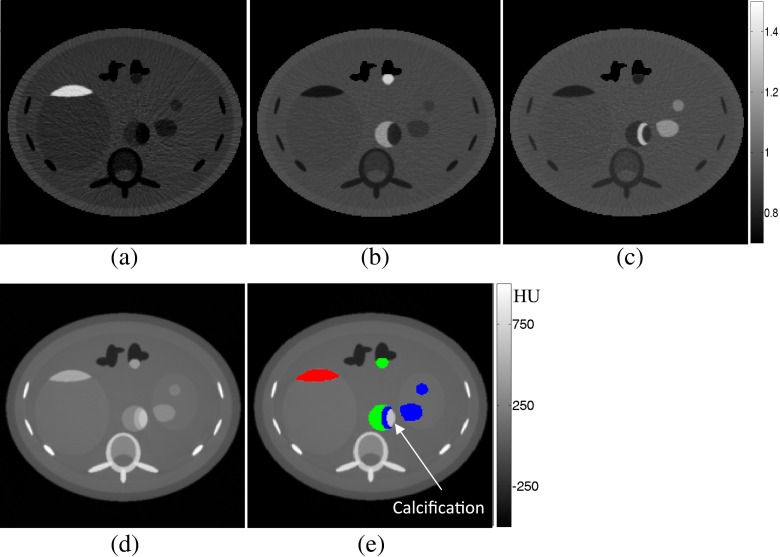
Figure 5 shows parametric maps, diagnostic images and colour overlay of discriminated contrast agents for Combination 2, where Gd, Hf and Au are used. Figure 5a–c corresponds to R50.2=bin2/bin1, R65.4=bin3/bin2 and R80.7=bin4/bin3, respectively.
Figure 5.
(a–c) RK-edge parametric maps of the anthropomorphic phantom. (d) Diagnostic image. (e) Colour overlay image filled with three simultaneous contrasts where red represents gadolinium, green represents hafnium and blue represents gold (colour visible in online version only).
We observed that in the K-edge ratio parametric maps, the pixel values of soft tissue, bones and contrast agents were <0.95, whereas the pixels of the selected contrast agent were >1.10. By thresholding each of the parametric maps at 1.00, pixels belonging to the corresponding contrast agent were successfully separated. The separated pixels can be coloured in the diagnostic image (Figure 5e).
Energy bins image quality
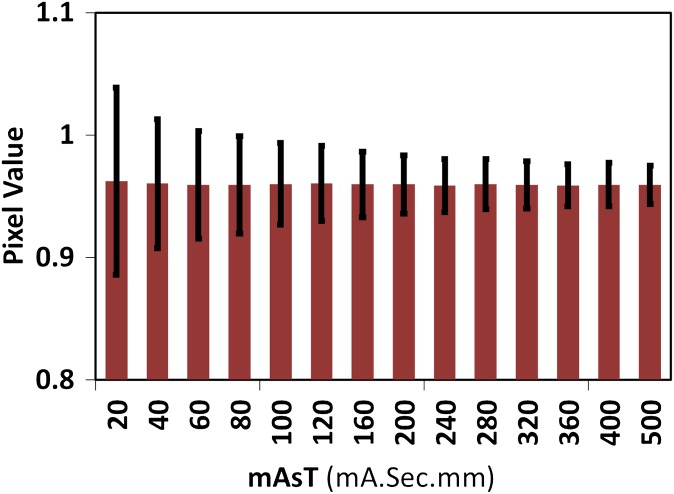
Figure 6 plots quantum noise variation (measured as standard deviation of the background) vs mAsT. Based on our analytical simulation, it can be observed that photon counts for <120 mAsT gives an average background noise >1.0 in the K-edge ratio parametric map. Such pitfall affects the differentiation of low concentrations of very high atomic number materials at the first level owing to the smaller jump ratio of these materials. As the photon count decreases further, differentiation of other materials with higher concentration or lower atomic numbers may be affected. Figure 6 shows that pixel values of the background in the K-edge ratio parametric maps become close to those of the contrast agent under this scenario. Consequently, the automatic segmentation of contrast agent regions using a threshold of 1.0 in the parametric maps may mistakenly classify some other pixels as contrast agent and, therefore, an additional procedure or higher photon counts may be required to solve the problem.
Figure 6.
Parametric map background mean (thick bars) and standard deviations (thin bars) for different mAsT.
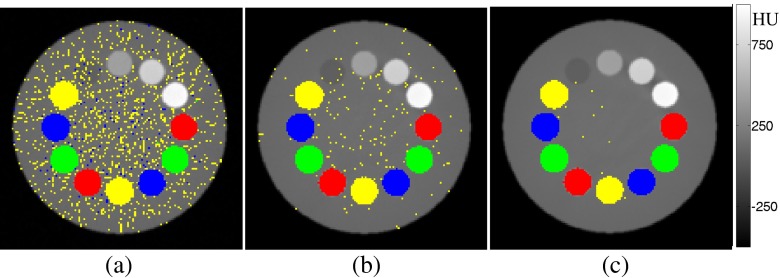
Figure 7 shows three sample images acquired at 80, 240 and 500 mAsT in which high quantum noise leads to such a problem. It can be seen that in situations with insufficient photon counts, which might occur using thin slicing and/or very low mAs, the noise amplitude exceeds the K-edge ratio, which might impact negatively the differentiation power of contrast agents. However, by increasing mAsT and through fine tuning of the threshold values, this effect may be reduced to some extent. Based on our simulations of phantom/body objects with diameters >25 cm, at least 500 mAsT (e.g. 5-mm thickness and 100 mAs with 140 kVp) is required to achieve reliable parametric maps for K-edge ratio imaging.
Figure 7.
Photon starvation effect in the multicontrast phantom filled with four simultaneous contrast agents: europium (Eu), ytterbium (Yb), osmium (Os) and thallium (Tl): (a) mAsT=80, (b) mAsT=240 and (c) mAsT=500. Red represents Eu, green represents Yb, blue represents Os and yellow represents Tl (colour visible in online version only).
DISCUSSION
To underline the ability of spectral CT over integral CT in distinguishing multiple simultaneous contrast agents, we proposed a new imaging method based on the K-edge ratio algorithm. To this end, we used an analytical modelling approach to simulate an energy-sensitive X-ray CT scanner. Since NP contrast agents may have long circulation times in the body, they would be capable of targeting multiple regions containing selective cancer cells. Therefore, they provide the possibility of targeted multiple contrast molecular CT imaging. In this work, we present a straightforward K-edge ratio algorithm that discriminates and identifies multiple contrast agents regardless of being simultaneous and/or mixed. This capability arises from the fact that the K-edge energies of elements are unique and, as such, the proposed method is highly sensitive to the LAC jump in the K-edge energy of the selected materials.
The principle of our image-based method is the sudden increase of LAC at the K-edge energy of a contrast agent. By forming a particular parametric map as the ratio of two images, one from the energy window above the K-edge energy and the other from the energy window below the K-edge energy, we showed that regions containing contrast agents have pixel values higher than 1.0, whereas other regions have pixel values <1.0 (Figure 5). It indicated that by applying a unique and constant threshold, contrast agent regions can be automatically segmented in the parametric maps.
Although it was shown using analytical simulation that the K-edge ratio algorithm achieves reasonably well the task of multiple contrast agent discrimination, it is obvious that translating the technique to clinical practice requires several intermediate steps. In our simulation procedure, some physical factors were not considered. We assumed that the detector can stop all X-ray photons with high count rates and ideally recorded the energy of each hitting photon assuming perfect absorption. Although the geometry and materials of the detector may provide the possibility of stopping all incoming X-rays, perfect recording of the energy of all photons is not quite realistic and hence the f(E) and w(E) in Equation (4) need to be experimentally determined for the given photon-counting detector [36–41]. In addition, we simplified all sources of noise by adding only Poisson noise to the detected photons. Although our validation work demonstrated that we have generated similar noise patterns compared with experimental studies in some cases, robust noise validation requires additional work. This problem is critical, owing to the high quantum noise in the bin images. However, we investigated the effect of noise originating from photon starvation on the performance of our proposed method and suggested a minimum scanning protocol. Moreover, we proposed that the bin images must be used only for parametric map generation and not directly for diagnosis. However, images reconstructed from the entire X-ray spectrum with high contrast-to-noise ratio can be used for clinical diagnosis (Figure 5d).
Since a variety of high atomic number materials can be considered in simultaneous contrast agents imaging, a proper selection of materials according to their K-edge energies may improve the performance of K-edge ratio imaging method. The selection of materials with larger energy distance between their K-edge energies may help to design an acquisition protocol with wider energy bins to optimise the SNR in the K-edge ratio parametric maps. Moreover, the selection of X-ray tube potential, current and filtration as well as scanning time may contribute to the optimisation of the performance of the proposed technique.
In previous studies, the identification of multiple contrast agents has been investigated under different perspectives utilising multienergy (spectral) CT equipped with energy sensitive photon counting detectors. The common algorithm in most of these studies starts with forming a system of equations considering data sets obtained from multienergy acquisition and the use of the decomposition of attenuation coefficient functions. Iteratively solving this system of equations results in the identification of contrast agents with K-edge energy inside the radiological energy range [19,42]. Although it has been reported that the methods utilised in these studies efficiently discriminate between contrast agents when solving such a system of equations, the following issues must be considered: (i) since they are solved using iterative methods, designing a reliable and robust system of equations that avoids ill-conditioning and divergence issues is critical; (ii) a particular system of equations must be designed for each combination of contrast agents [19], which may become challenging when the calculations are performed in projection space, owing to practical difficulties for manufacturers; (iii) in the system of equations, it is required to repeat the calculations for each element of the projection matrix (sinogram). This indicates that a large number of repetitive calculations must be performed to estimate the contributions of the materials in each pixel. Therefore, it must be carefully considered whether or not material decomposition with iterative methods warrants its clinical applicability with the required additional processing time. Unlike iterative methods, our proposed method is based on simple calculations and can discriminate and identify multiple contrast agents in the image domain. Moreover, in contrast to attenuation coefficient decomposition methods, our method does not require prior knowledge of the constant and coefficients of particular functions such as photoelectric and Compton functions. Therefore, it does not require any particular calibration procedures.
The main limitation of energy sensitive CT when used for contrast agent discrimination is the dependency of the energy bin thresholds on the K-edge energies of contrast agents. In K-edge imaging methods, the energy binning should be designed such that no K-edge falls inside the bins, and at the same time, there should be a bin below and a bin above the K-edge energy. It is the nature of K-edge methods to be highly dependent on bins location, which is owing to the fact that in K-edge imaging methods, the main aim is to identify contrast agents by considering their unique K-edge energies. In most previously proposed K-edge imaging approaches, the energy thresholds of bins have been adjusted so that they are placed very near to the K-edge energy of a given contrast agent [8,19,33,43,44]. This indicates that in the presence of multiple contrast agents, increasing the number of contrast agents decreases the energy bins width an increase in the quantum noise and streak artefact in the bin images owing to photon starvation. Therefore, an optimal protocol must be achieved in terms of trade-off between the number of contrast agents to be simultaneously identified and the quantum noise of the bin images.
CONCLUSION
K-edge ratio imaging based on multi-energy CT equipped with energy resolving detectors is a promising approach for identification of contrast agents in molecular CT imaging, particularly when using multiple targetable NP contrast agents. Compared with K-edge methods based on iterative solving of a system of equations, our K-edge ratio method is fast and straightforward. The results show that this method is applicable to cases in which the number and type of contrast agents may vary; only the acquisition protocol must be customised accordingly. The image-based nature of the method makes it practical and easy to be implemented in the clinic.
FUNDING
This work was supported in part by Tehran University of Medical Sciences, Tehran, Iran and the Swiss National Science Foundation under grant SNSF 31003A-135576 and Geneva University Hospital under grant PRD 11-II-1, Switzerland.
REFERENCES
- 1.Aviv H, Bartling S, Grinberg I, Margel S. Synthesis and characterization of Bi2O3/HSA core-shell nanoparticles for X-ray imaging applications. J Biomed Mater Res B Appl Biomater 2012;101:131–8 10.1002/jbm.b.32826 [DOI] [PubMed] [Google Scholar]
- 2.Reuveni T, Motiei M, Romman Z, Popovtzer A, Popovtzer R. Targeted gold nanoparticles enable molecular CT imaging of cancer: an in vivo study. Int J Nanomedicine 2011;6:2859–64 10.2147/IJN.S25446 [DOI] [PMC free article] [PubMed] [Google Scholar]
- 3.Chou SW, Shau YH, Wu PC, Yang YS, Shieh DB, Chen CC. In vitro and in vivo studies of FePt nanoparticles for dual modal CT/MRI molecular imaging. J Am Chem Soc 2010;132:13270–8 10.1021/ja1035013 [DOI] [PubMed] [Google Scholar]
- 4.Axelsson O. Contrast agents comprising tungsten-containing cores. WIPO Patent No. 2006123936. Geneva, Switzerland: World Intellectual Property Organization; 2006. [Google Scholar]
- 5.Torres AS, Bonitatibus PJ, Jr, Colborn RE, Goddard GD, FitzGerald PF, Lee BD, et al. Biological performance of a size-fractionated core-shell tantalum oxide nanoparticle x-ray contrast agent. Invest Radiol 2012;47:578–87 10.1097/RLI.0b013e318260fc40 [DOI] [PubMed] [Google Scholar]
- 6.Dekrafft KE, Boyle WS, Burk LM, Zhou OZ, Lin W. Zr- and Hf-based nanoscale metal-organic frameworks as contrast agents for computed tomography. J Mater Chem 2012;22:18139–44 10.1039/C2JM32299D [DOI] [PMC free article] [PubMed] [Google Scholar]
- 7.Zhou J, Zhu X, Chen M, Sun Y, Li F. Water-stable NaLuF4-based upconversion nanophosphors with long-term validity for multimodal lymphatic imaging. Biomaterials 2012;33:6201–10 10.1016/j.biomaterials.2012.05.036 [DOI] [PubMed] [Google Scholar]
- 8.Pan D, Schirra CO, Senpan A, Schmieder AH, Stacy AJ, Roessl E, et al. An early investigation of ytterbium nanocolloids for selective and quantitative “multicolor” spectral CT imaging. ACS Nano 2012;6:3364–70 10.1021/nn300392x [DOI] [PMC free article] [PubMed] [Google Scholar]
- 9.Liu Z, Li Z, Liu J, Gu S, Yuan Q, Ren J, et al. Long-circulating Er3+-doped Yb2O3 up-conversion nanoparticle as an in vivo X-ray CT imaging contrast agent. Biomaterials 2012;33:6748–57 10.1016/j.biomaterials.2012.06.033 [DOI] [PubMed] [Google Scholar]
- 10.Nowak T, Hupfer M, Brauweiler R, Eisa F, Kalender WA. Potential of high-Z contrast agents in clinical contrast-enhanced computed tomography. Med Phys 2011;38:6469–82 10.1118/1.3658738 [DOI] [PubMed] [Google Scholar]
- 11.Ashokan A, Menon D, Nair S, Koyakutty M. A molecular receptor targeted, hydroxyapatite nanocrystal based multi-modal contrast agent. Biomaterials 2010;31:2606–16 10.1016/j.biomaterials.2009.11.113 [DOI] [PubMed] [Google Scholar]
- 12.Shilo M, Reuveni T, Motiei M, Popovtzer R. Nanoparticles as computed tomography contrast agents: current status and future perspectives. Nanomedicine (Lond) 2012;7:257–69 10.2217/nnm.11.190 [DOI] [PubMed] [Google Scholar]
- 13.Bulte JW. Science to practice: can CT be performed for multicolor molecular imaging? Radiology 2010;256:675–6 10.1148/radiol.101127 [DOI] [PubMed] [Google Scholar]
- 14.Liu Y, Ai K, Lu L. Nanoparticulate X-ray computed tomography contrast agents: from design validation to in vivo applications. Acc Chem Res 2012;45:1817–27 10.1021/ar300150c [DOI] [PubMed] [Google Scholar]
- 15.Cheng Z, Al Zaki A, Hui JZ, Muzykantov VR, Tsourkas A. Multifunctional nanoparticles: cost versus benefit of adding targeting and imaging capabilities. Science 2012;338:903–10 10.1126/science.1226338 [DOI] [PMC free article] [PubMed] [Google Scholar]
- 16.Alvarez RE, Macovski A. Energy-selective reconstructions in X-ray computerized tomography. Phys Med Biol 1976;21:733–44 [DOI] [PubMed] [Google Scholar]
- 17.Lehmann LA, Alvarez RE, Macovski A, Brody WR, Pelc NJ, Riederer SJ, et al. Generalized image combinations in dual KVP digital radiography. Med Phys 1981;8:659–67 [DOI] [PubMed] [Google Scholar]
- 18.Shikhaliev PM. Photon counting spectral CT: improved material decomposition with K-edge-filtered x-rays. Phys Med Biol 2012;57:1595–615 10.1088/0031-9155/57/6/1595 [DOI] [PubMed] [Google Scholar]
- 19.Schlomka JP, Roessl E, Dorscheid R, Dill S, Martens G, Istel T, et al. Experimental feasibility of multi-energy photon-counting K-edge imaging in pre-clinical computed tomography. Phys Med Biol 2008;53:4031–47 10.1088/0031-9155/53/15/002 [DOI] [PubMed] [Google Scholar]
- 20.Riederer SJ, Mistretta CA. Selective iodine imaging using K-edge energies in computerized x-ray tomography. Med Phys 1977;4:474–81 [DOI] [PubMed] [Google Scholar]
- 21.Schmidt TG, Pektas F. Region-of-interest material decomposition from truncated energy-resolved CT. Med Phys 2011;38:5657–66 10.1118/1.3641749 [DOI] [PubMed] [Google Scholar]
- 22.Lee SW, Choi YN, Cho HM, Lee YJ, Ryu HJ, Kim HJ. A Monte Carlo simulation study of the effect of energy windows in computed tomography images based on an energy-resolved photon counting detector. Phys Med Biol 2012;57:4931–49 10.1088/0031-9155/57/15/4931 [DOI] [PubMed] [Google Scholar]
- 23.Le HQ, Molloi S. Segmentation and quantification of materials with energy discriminating computed tomography: a phantom study. Med Phys 2011;38:228–37 [DOI] [PMC free article] [PubMed] [Google Scholar]
- 24.De Man B, Nuyts J, Dupont P, Marchal G, Suetens P. Metal streak artifacts in X-ray computed tomography: a simulation study. IEEE Trans Nucl Sci 1999;46:691–6. [DOI] [Google Scholar]
- 25.Hsieh J. Analytical models for multi-slice helical CT performance parameters. Med Phys 2003;30:169–78 [DOI] [PubMed] [Google Scholar]
- 26.Akbarzadeh A, Ay MR, Ghadiri H, Sarkar S, Zaidi H. Measurement of scattered radiation in a volumetric 64-slice CT scanner using three experimental techniques. Phys Med Biol 2010;55:2269–80 10.1088/0031-9155/55/8/010 [DOI] [PubMed] [Google Scholar]
- 27.Cranley K, Gilmore BJ, Fogarty GWA, Desponds L.Electronic version prepared by Sutton D. Catalogue of diagnostic X-ray spectra and other data. The Institute of Physics and Engineering in Medicine Report No. 78. York, UK: IPEM; 1997. [Google Scholar]
- 28.Shikhaliev PM. Projection x-ray imaging with photon energy weighting: experimental evaluation with a prototype detector. Phys Med Biol 2009;54:4971–92 10.1088/0031-9155/54/16/009 [DOI] [PubMed] [Google Scholar]
- 29.Schmidt TG. CT energy weighting in the presence of scatter and limited energy resolution. Med Phys 2010;37:1056–67 [DOI] [PubMed] [Google Scholar]
- 30.IMP. FORBILD phantoms Erlangen, Germany: Institute of Medical Physics; 2003. Available at: http://www.imp.uni-erlangen.de/forbild
- 31.Segars WP, Mahesh M, Beck TJ, Frey EC, Tsui BM. Realistic CT simulation using the 4D XCAT phantom. Med Phys 2008;35:3800–8 [DOI] [PMC free article] [PubMed] [Google Scholar]
- 32.Gerward L, Guilbert N, Jensen KB, Levring H. WinXCom—a program for calculating X-ray attenuation coefficients. Radiat Phys Chem 2004;71:653–4 [Google Scholar]
- 33.He P, Wei B, Cong W, Wang G. Optimization of K-edge imaging with spectral CT. Med Phys 2012;39:6572 10.1118/1.4754587 [DOI] [PMC free article] [PubMed] [Google Scholar]
- 34.Leng S, Yu L, Wang J, Fletcher JG, Mistretta CA, McCollough CH. Noise reduction in spectral CT: reducing dose and breaking the trade-off between image noise and energy bin selection. Med Phys 2011;38:4946–57 10.1118/1.3609097 [DOI] [PubMed] [Google Scholar]
- 35.Christner JA, Kofler JM, McCollough CH. Estimating effective dose for CT using dose-length product compared with using organ doses: consequences of adopting International Commission on Radiological Protection Publication 103 or dual-energy scanning. AJR Am J Roentgenol 2010;194:881–9 10.2214/AJR.09.3462 [DOI] [PubMed] [Google Scholar]
- 36.Koenig T, Schulze J, Zuber M, Rink K, Butzer J, Hamann E, et al. Imaging properties of small-pixel spectroscopic x-ray detectors based on cadmium telluride sensors. Phys Med Biol 2012;57:6743–59 10.1088/0031-9155/57/21/6743 [DOI] [PubMed] [Google Scholar]
- 37.Procz S, Pichotka M, Lubke J, Hamann E, Ballabriga R, Blaj G, et al. Flatfield correction optimization for energy selective X-ray imaging with Medipix3. IEEE Trans Nucl Sci 2011;58:3182–9 [Google Scholar]
- 38.Walsh MF, Opie AMT, Ronaldson JP, Doesburg RMN, Nik SJ, Mohr JL, et al. First CT using Medipix3 and the MARS-CT-3 spectral scanner. J Instrum 2011;6:C01095 [Google Scholar]
- 39.Herrmann C, Engel KJ, Wiegert J. Performance simulation of an x-ray detector for spectral CT with combined Si and Cd[Zn]Te detection layers. Phys Med Biol 2010;55:7697–713 10.1088/0031-9155/55/24/020 [DOI] [PubMed] [Google Scholar]
- 40.Ding H, Ducote JL, Molloi S. Breast composition measurement with a cadmium-zinc-telluride based spectral computed tomography system. Med Phys 2012;39:1289–97 10.1118/1.3681273 [DOI] [PMC free article] [PubMed] [Google Scholar]
- 41.Brambilla A, Ouvrier-Buffet P, Gonon G, Rinkel J, Moulin V, Boudou C, et al. Fast CdTe and CdZnTe semiconductor detector arrays for spectroscopic X-ray imaging. IEEE Trans Nucl Sci 2013;60:408–15 [Google Scholar]
- 42.Roessl E, Proksa R. K-edge imaging in x-ray computed tomography using multi-bin photon counting detectors. Phys Med Biol 2007;52:4679–96 10.1088/0031-9155/52/15/020 [DOI] [PubMed] [Google Scholar]
- 43.Feuerlein S, Roessl E, Proksa R, Martens G, Klass O, Jeltsch M, et al. Multienergy photon-counting K-edge imaging: potential for improved luminal depiction in vascular imaging. Radiology 2008;249:1010–16 10.1148/radiol.2492080560 [DOI] [PubMed] [Google Scholar]
- 44.Roessl E, Cormode D, Brendel B, Engel KJ, Martens G, Thran A, et al. Preclinical spectral computed tomography of gold nano-particles. Nucl Instrum Methods Phys Res A. 2011;648:S259–S64 [Google Scholar]


