

Abstract
A facile bottom-up method for the synthesis of highly fluorescent graphene quantum dots (GQDs) has been developed using a one-step pyrolysis of a natural amino acid, L-glutamic acid, with the assistance of a simple heating mantle device. The developed GQDs showed strong blue, green and red luminescence under the irradiation of ultra-violet, blue and green light, respectively. Moreover, the GQDs emitted near-infrared (NIR) fluorescence in the range of 800–850 nm with the excitation-dependent manner. This NIR fluorescence has a large Stokes shift of 455 nm, providing significant advantage for sensitive determination and imaging of biological targets. The fluorescence properties of the GQDs, such as quantum yields, fluorescence life time, and photostability, were measured and the fluorescence quantum yield was as high as 54.5 %. The morphology and composites of the GQDs were characterized using TEM, SEM, EDS, and FT-IR. The feasibility of using the GQDs as a fluorescent biomarker was investigated through in vitro and in vivo fluorescence imaging. The results showed that the GQDs could be a promising candidate for bioimaging. Most importantly, compared to the traditional quantum dots (QDs), the GQDs is chemically inert. Thus, the potential toxicity of the intrinsic heavy metal in the traditional QDs would not be a concern for GQDs. In addition, the GQDs possessed an intrinsic peroxidase-like catalytic activity that was similar to the graphene sheets and carbon nanotubes. Coupled with 2,2′-azino-bis(3-ethylbenzothiazoline-6-sulphonic acid) (ABTS), the GQDs can be used for the sensitive detection of hydrogen peroxide with a limit of detection of 20 μM.
Introduction
Recently, graphene and its derivative graphene oxide have attracted remarkable attention due to their extraordinary optical and electronic properties and biocompatibility.1–6 However, applications of graphene in the fields of bioimaging and optoelectronics are limited because graphene is a zero-bandgap semiconductor.7, 8 In order to generate the bandgap in graphenes, a zero-dimensional derivative, graphene quantum dots (GQDs) have been developed.9–17 GQDs have strong quantum confinement and edge effect when their sizes are in the range of 3–10 nm.10, 15, 18, 19 Compared to zero-bandgap graphene sheets, GQDs exhibit stronger photoluminescence for bioimaging, 20 light-emitting diodes,21 and biosensors.11 The photoluminescence is not only attributed to the quantum confinement effect, but also to the edge effect of the small graphene quantum dots. Most importantly, compared to the traditional quantum dots (QDs),22–28 GQDs is chemically inert. Thus, the potential toxicity of the intrinsic heavy metal in the traditional QDs would not be a concern for GQDs. Even though the mechanism of photoluminescence needs further investigation, a wide variety of applications of GQDs have been developed, such as photovoltaic devices,29 biosensing,11, 30 drug delivery,31 cellular imaging,19 and the interaction with biological system.32
A number of methods have been developed for the synthesis of GQDs. Generally, the approaches can be divided into two groups: top-down and bottom-up methods. The top-down methods are based on cutting large carbon materials, such as carbon nanotubes, graphene sheets and carbon fibers, to form small GQDs. For example, Pan et al. synthesized blue GQDs by a hydrothermal method using a preoxidized graphene sheet.10 Zhou et al. broke C-C bonds of a graphene oxide using the photo-Fenton reaction to produce GQDs.32 With controlling of the photo-Fenton reaction conditions, the nanoporous graphene sheets and GQDs were generated in the order. Using microwave as an energy source, Li et al. synthesized greenish-yellow luminescent GQDs by cutting a graphene oxide under acid conditions.33 Furthermore, several other methods were developed such as acid treatment coupled with the chemical exfoliation of carbon fibers,15 the electrochemical etching of a graphene electrode,34 and the ultrasonication breaking of graphene.35, 36 The luminescent GQDs could be obtained from carbon sources by these top-down methods; however, the reaction conditions and purification processes were complicated and time-consuming.
In contrast to the top-down approaches, bottom-up methods fabricate GQDs from small carbon precursors including glucose,21 Hexa-peri-hexabenzocoronene,37 citric acid,12 and etc.38 The bottom-up methods produced GQDs with controllable morphology and well-distributed sizes. However, harsh reaction conditions, such as using a strong acid or alkali, a long treatment period of time, and necessary separation processes, are limitations of the bottom-up methods. In order to overcome these limitations, in this work we have developed a simple and rapid bottom-up synthetic method by carbonizing a common amino acid, L-glutamic acid (Glu), using a heating mantle for pyrolysis. This is the first report to use the L-glutamic acid for the synthesis of highly fluorescent nitrogen-doped GQDs with a simple heating process. The obtained GQDs emitted various wavelengths of fluorescence including the near-infrared fluorescence (NIR). In the NIR region, biological samples have low background fluorescence signals, providing high signal to noise ratio. Meanwhile, NIR radiation can penetrate into sample matrices deeply due to low light scattering. Thus, the GQDs are promising labeling reagents for sensitive determination and imaging of biological targets. The fluorescence quantum yield of the developed GQDs was about 5 times higher than the GQDs from citric acids.12 We have demonstrated the feasibility of using the GQDs in the in vitro and in vivo fluorescence imaging. Besides the bioimaging applications, the GQDs showed a peroxidase-like catalytic activity that was used for the sensitive detection of H2O2.
Experimental section
Materials
L-glutamic acid, Ludox SM-30 colloidal silica (30 wt. % suspension in water), hydrogen peroxide, 2,2′-azino-bis(3-ethylbenzothiazoline-6-sulphonic acid) (ABTS), fluorescein isothiocyanate (FITC) isomer I, rhodamine-101 and phosphate buffered saline (PBS) tablet were purchased from Sigma-Aldrich. The deionized water (18.3 M • cm) was produced from the Millpore water purification system.
Synthesis of GQDs
The GQDs was synthesized by pyrolyzing L-glutamic acid. Briefly, 2.0 g L-glutamic acid was added into a glass bottle and heated to 210 °C with a heating mantle. After the solid L-glutamic acid changed to liquid, the boiling colorless liquid turned to brown in 45 s, which indicated the formation of GQDs. Then, 10.0 mL water was added into the solution followed stirring for 30 min. When the solution temperature reached the room temperature, the solution was centrifuged at 10,000 g for 30 min. The supernatant was collected after centrifuging. The resulted GQD solution could be stored at the room temperature for at least 5 months without precipitation.
Characteristics of GQDs
A JEOL JEM-2100 high-resolution transmission electron microscope (HRTEM) was used to characterize the GQDs at an operating voltage of 200 kV. The size distribution of the GQDs was measured and graphed using Image J. Fourier transform infrared (FTIR) spectra were obtained on a FT-IR spectrometer (Peking). The Energy-dispersive X-ray spectroscope (EDS) (Oxford), which was attached on the Hitachi SU8010 field emission scanning electron microscope (SEM) with an operating voltage of 5 kV, was used to analyze the relative contents of carbon, nitrogen and oxygen in L-glutamic acid and GQDs. X-ray diffraction (XRD) profiles were obtained with Bruker AXS D8 advanced powder X-ray diffraction system using Cu Kα radiation. Raman spectra were performed on an Aramis labRAM Raman spectrometer (Horiba JobinYvon) using the helium-neon laser at 542 nm. A Shimadzu UV-250 UV/vis spectrometer was used for the measurements of the UV/vis absorption of GQDs. The fluorescence spectra, lifetime, and quantum yields were measured using a Jobin-Yvon-Horiba Fluorometer 3 Model (FL 3-11 spectrofluorometer). The zeta potential was detected using the Zetasizer (Marlwen, model of Nano-ZS) by adjusting the pH of the GQDs from 2.0 to 12.0 using PBS buffer.
Detection of quantum yields
Fluorescein in 0.1 M NaOH (QY = 92 %) was chosen as a reference.39, 40 The quantum yield was calculated according to the following equation:
Where the subscripts ST and X denote standard and sample, respectively. Φ is the quantum yield. I represents the measured integrated fluorescence intensity. A is the absorbance at the excitation wavelength, and η is the refractive index of the solvent. The refractive index for the standard and sample are 1.33. The GQDs were excited at 360 nm with an emission range of 380–650 nm.
Detection of fluorescence lifetime
The fluorescence lifetime of GQDs was measured using time-correlated single photon counting (TCSPC) with the LED (370 nm) equipped on the Jobin-Yvon-Horiba Fluorometer 3. A Ludox SM-30 colloidal silica was used as the reference. The emission wavelength of GQDs changed from 455 to 505 and 650 nm. An emission wavelength of 815 nm was used for the NIR fluorescence lifetime measurement.
In vitro fluorescence imaging of cells
The fluorescence imaging of cells treated with GQDs was conducted at various wavelengths (Zeiss LSM-510 Meta Confocal Microscope). Briefly, murine alveolar macrophage cells (MH-S) were cultured overnight at 37 °C on plates in RPMI 1640 medium containing 10 % fetal bovine serum in a 5 % CO2 environment. Then, the cultured cells were washed twice with PBS buffer (pH 7.4). Afterwards, a 2 mL aliquot of 10 mg/mL GQDs in PBS was added to the cell culture medium followed by 1 hour culture at 37 °C in a 5% CO2 environment. Finally, the MH-S cells were washed twice using the PBS buffer and imaged using the Zeiss LSM-510 Meta confocal microscope.
In vivo fluorescence imaging of mice
The in vivo fluorescence imaging of mice treated with GQDs was carried out using the IVIS imaging system (IVIS Lumina XR, Caliper). The athymic BALB/c-nu mice with weight of 20–25 g were obtained from Charles River (Wilmington, MA), and maintained in the University of North Dakota animal center. All animal operations were in accord with the institutional animal use and care regulations, according to protocol No. 1204-4 and 1204-5. The feasibility of the GQDs for in vivo fluorescence imaging was investigated by subcutaneous and intramuscular injection. The mice were anesthetized and injected with 100 μL of 25 mg/mL GQD PBS solution (pH 7.4) subcutaneously on the back, and 100 μL of 25 mg/mL GQD intramuscularly in the right back leg. The fluorescence images of the mice were taken immediately with different excitation and emission filter combinations.
Detection of H2O2 based on the GQD’s catalytic activities
5.4 mg/mL GQDs was dissolved in 110 μL of 10 mM Tris-HCl buffer (pH = 5.0), followed by the addition of 7.2 mM ABTS.
The control samples were prepared using the same condition except for no GQDs or H2O2, respectively. The absorption spectra of these three samples were recorded after 2 min of the reaction. Then, the reaction conditions, such as pH, temperature, concentrations of ABTS, and concentrations of GQDs, were optimized. Different concentrations of H2O2 were added into the solution for the investigation of sensitivity. The absorbance at 416 nm against the reaction time of 120 s was measured.
Results and discussion
Design of the highly fluorescent GQDs
The objective of this work was to develop a simple bottom-up method for the synthesis of highly fluorescent GQDs. The key factor of our design was the usage of a green and natural L-glutamic acid as the precursor. Traditionally the “bottom up” methods for the preparation of GQDs used some special organic precursors, such as 3-iodo-4-bromoaniline,38 resulting in a complicated synthetic process. However, in the synthesis of carbon nanodots, some common organic molecules, including citric acid,41 histidine42 and glucose,43 were used as the precursors with the assistance of microwave. These studies revealed a possibility of using common organic molecules to generate GQDs. Most recently, using a citric acid as the precursor, Chen et al. successfully developed fluorescent GQDs and graphene oxide.12 Inspired by this pioneer work, we considered using a natural amino acid as a precursor to synthesize N-doped GQDs based on the pyrolysis of the precursor. Our criteria for the selection of the precursor were non-toxic, common/natural materials, containing nitrogen groups for easy surface modification of the GQDs during their applications, and no further capping process is needed. Considering of these criteria, we selected L-glutamic acid. Our result demonstrated that the L-glutamic acid was an excellent precursor for making the GQDs. The formation of a GQD from the L-glutamic acid was illustrated in Scheme 1. The solid L-glutamic acid was first directly heated to 210 °C using a heating mantle. This temperature is the boiling point of the L-glutamic acid. At this condition, the L-glutamic acid melted and boiled very soon. The colorless liquid changed to pale yellow and brown within 45 s, indicating the carbonization of L-glutamic acid during the pyrolysis. At this moment, distilled water was added into the brown liquid to dissolve and disperse the GQDs under vigorous stirring to avoid aggregation. Unlike other methods, surface passivation agents or other inorganic additives were not needed for the generation of high quantum yield GQDs. The residue L-glutamic acid could act as a surface passivation agent, resulting in the extremely stable and highly fluorescent GQDs in solution. The GQDs were formed in one step of the pyrolysis of the precursor. Moreover, the amino group on the L-glutamic acid surface provided active groups for surface modification of GQDs.
Scheme 1.
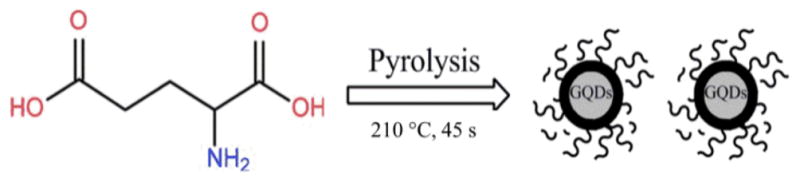
Schematic diagram of the formation of GQDs through pyrolysis of L-glutamic acid.
Characterization of the morphology and composites of the GQDs
The morphology of the obtained GQDs was first characterized using a high resolution TEM (Figure 1A). The high crystallinity of the GQDs was shown as in the inset of Figure 1A. The GQDs’ lattice space was accurately measured to be 0.246 nm at the HRTEM image, which is comparable to that of graphitic.44 The average diameter of the GQDs was 4.66 ± 1.24 nm according to the statistic calculation of more than 100 dots (Figure 1B). The size distribution showed uniform dimension of the developed GQDs.
Fig. 1.
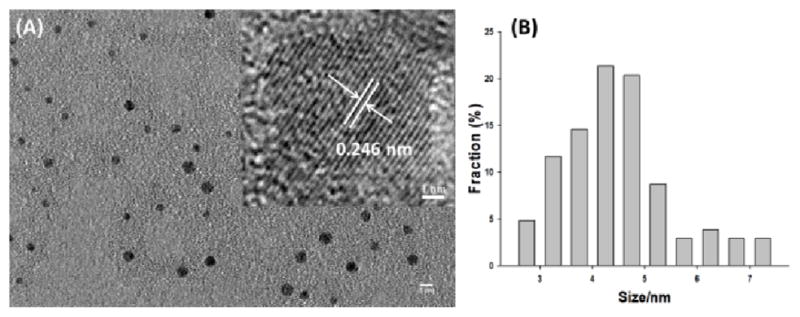
(A) The HRTEM image of GQDs with a scale bar of 5 nm. Inset: A typical single GQD with the lattice parameter of 0.246 nm. The scale bare was 1 nm; (B) The size distribution of GQDs calculated from more than 100 dots.
The element content of the GQDs was analyzed using EDS. As a control, the relative atomic percentage of L-glutamic acid were 48.73% (C), 9.54% (N), and 41.73% (O) (Figure 2A and C), which was similar to the theoretically relative atomic percentage of L-glutamic acid (50 % of C, 10 % of N and 40 % of O). After the pyrolysis of the L-glutamic acid, the GQDs were formed. Their carbon content increased from 48.73 % to 60.01 %. Meanwhile, the oxygen content decreased from 41.73 % to 34.60 %, and the nitrogen content decreased from 9.54 % to 5.39 % (Figure 2B and C). This result indicated that the L-glutamic acid was carbonized after pyrolysis.
Fig. 2.

EDS spectra of L-glutamic acid (A) and GQDs (B), and the relative atomic percentage of L-glutamic acid and GQDs(C).
To confirm the formation of GQDs XRD pattern and Raman spectroscopy were used to characterize the product. As shown in Figure 3A, the Raman spectrum of GQDs has two typical peaks at ca. 1355 cm−1 and 1580 cm−1. The G band (1580 cm−1) was related to the vibration of the sp2-bonded C atoms in the graphene materials; and the D band (1355 cm−1) corresponded to the destruction of the sp2 network by the sp3-bonded C atoms. Figure 3B showed a typical XRD profile of GQDs. It had a broad (002) peak centered at ca. 20.0°, which is similar to the GQDs synthesized by other methods.21
Fig. 3.
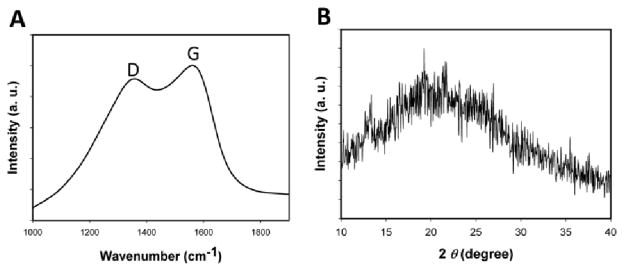
(A) Raman spectra of GQDs. (B) XRD patterns of GQDs.
The structural change of the L-glutamic acid during the formation of the GQDs was further characterized using the FT-IR spectra (Figure 4A). Compared curve a with b in Figure 4A, the C=C stretching of graphite was formed as indicated by the appearance of the 3000 cm−1 and 1500 cm−1 peaks, which demonstrated the formation of GQDs.45 The broad peak area from 2500 – 2800 cm−1 was from the carboxylic acid O-H stretch. Meanwhile, the strong peak from 1600 to 1730 cm−1 resulted from the combination of carboxylic acid C=O stretch and amide C=O stretch in the GQDs. The carboxylic acid O-H stretching and C=O stretching peaks demonstrated the presence of the carboxyl groups. The amide C=O stretching and new formed amide N-H stretching peak (3700 – 3500 cm−1) indicated the formation of the amides between the amine group and the carboxyl group. The stretching vibrations of amine N-H (ca. 3360 cm−1) in both curves indicated the presence of amine groups in the L-glutamic acid and GQDs. The oxygen-containing and nitrogen-containing groups promised the high water solubility and stability in solution.
Fig. 4.
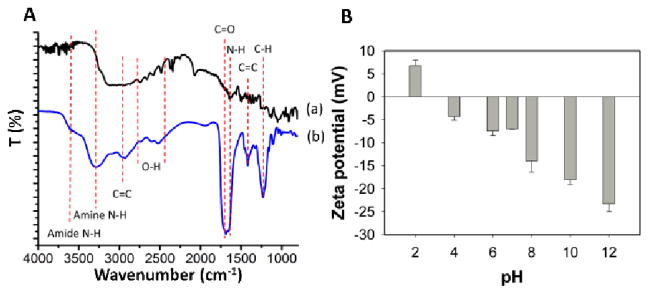
(A) FT-IR spectra of L-glutamic acid (a) and GQDs (b). (B) The zeta potential of GQDs in different pH solutions.
The zeta potential of the GQDs in different pH values was also investigated. As shown in Figure 4B, the zeta potential changed from positive 6.81 mV to negative 23.2 mV by increasing the pH value from 2 to 12. This large change of the zeta potential with the pH was related to the presence of the amino and carboxyl groups in the GQDs. Because of the reaction activity of the amino and carboxyl groups, the biomolecules, such as antibodies and aptamers, could be easily conjugated onto GQDs for further applications.
Fluorescence properties of the GQDs
The significant feature of the developed GQDs relies on their fluorescence properties. We have investigated the fluorescence properties using both the spectroscopy and the microscopy. The obtained UV-vis absorption spectra and photoluminescence spectra were shown in Figure 5A. The GQDs showed two obvious absorption peaks at 238 nm and 335 nm, respectively (Figure 5 A, curve a). The peak around 238 nm was attributed to π-π* transitions of C=C bonds. The apparent peak at 335 nm indicated the major uniform size of the sp2 clusters in the GQDs even though these sp2 clusters were doped in the sp3 matrix. The color of GQDs in the aqueous solution was yellow (Inset of Figure 5A). When the GQDs were excited at 360 nm (Figure 5A curve b), the GQDs showed a strong fluorescence peak at 440 nm (Figure 5A curve c). More importantly, the fluorescence is strong enough to be observed by naked eyes (Inset of Figure 5A), which has promising applications for fluorescence imaging. In addition, the fluorescence emission spectra showed an excitation-dependent manner. The emission peak of GQDs shifted from 415 nm (violet) to 580 nm (red) when the excitation wavelength was changed from 320 nm to 540 nm (Figure 5B).
Fig. 5.

(A) The absorption (curve a), excitation (curve b) and emission spectra (curve c) of GQDs. Inset: from left to right are the GQDs solutions under bright light, violet, blue and green irradiation, respectively; (B) Fluorescence emission spectra of GQDs with different excitation wavelengths; (C)- (E) The confocal fluorescence images of the GQDs under different excitation wavelengths. (C) 359 nm excitation; DAPI channel; (D) 488 nm excitation, LP 505 nm; (E) 514 nm excitation, BP 530–600 nm.
We then investigated the fluorescence property of GQDs using a fluorescence microscope. With the irradiation of the violet (330–385 nm), blue (460–500 nm) and green (535–585 nm) light, the GQDs emitted strong blue, green and red fluorescence, respectively (Figure 5C, D, E). It should be noted that the precursor of the GQDs showed no absorption in the violet region and no fluorescence in the range of violet to visible. Thus, all these fluorescence properties should come from the formation of GQDs.
To further explore the fluorescence features of the developed GQDs, we measured their fluorescence quantum yield and lifetime. Using fluorescein as a reference dye the quantum yield of GQDs was measured to be 54.5 % under the excitation of 360 nm. This relative high quantum yield might be benefited from the protection of the residue L-glutamic acid as the surface passivation agent. The fluorescence lifetime of the GQDs was analyzed using the TCSPC method at different emission wavelengths with 370 nm excitation. All three fluorescence emissions exhibited well fitted triple-exponential function as shown in Figure 6. The observed lifetimes of GQDs at 445 nm, 505 nm, 650 nm and 815 nm were summarized in Table 1. Their average lifetime was in the range of 1.48 to 2.40 ns. The nanosecond lifetime of GQDs demonstrated their potential for optoelectronic and biological applications.
Fig. 6.
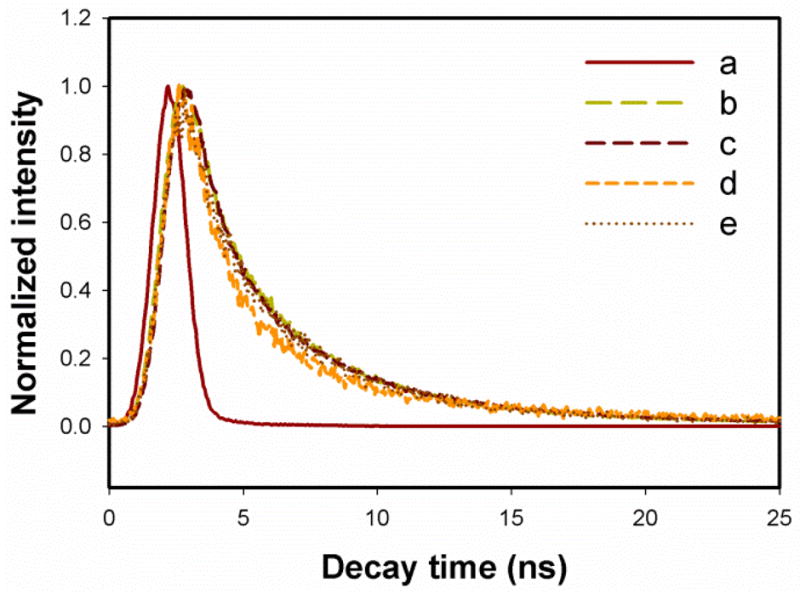
Lifetime measurement curves for reference (a) and GQDs at different emission wavelengths with 370 nm LED irradiation. Emission wavelengths: (b) 445 nm; (c) 505 nm; (d) 650 nm, and (e) 815 nm.
Table 1.
Caption Fluorescence lifetime of GQDs at different emission wavelengths with 370 nm excitation.
| Ex (nm) | Em (nm) | τ1 (ns) | τ2 (ns) | τ 3 (ns) | Av. τ (ns) | Chi |
|---|---|---|---|---|---|---|
| 370 | 445 | 0.81 | 3.64 | 11.55 | 2.40 | 1.14 |
| 370 | 505 | 3.78 | 0.80 | 12.04 | 2.22 | 1.27 |
| 370 | 650 | 2.35 | 6.77 | 0.47 | 1.48 | 1.13 |
| 370 | 815 | 3.23 | 0.47 | 8.70 | 1.91 | 0.97 |
Compared to the traditional organic dyes, such as FITC, the GQDs not only could emit fluorescence at different wavelengths, but also showed much higher photostability. As shown in Figure 7, the fluorescence of FITC was bleached by 70 % under a confocal laser within 2 min (Figure 7A, C). However, the fluorescence of GQDs still showed strong intensity (47 % was bleached) even after 18 min of the same irradiation (Figure 7B, C). This increased photostability provided the GQDs with a great potential for in vitro and in vivo fluorescence imaging.
Fig. 7.
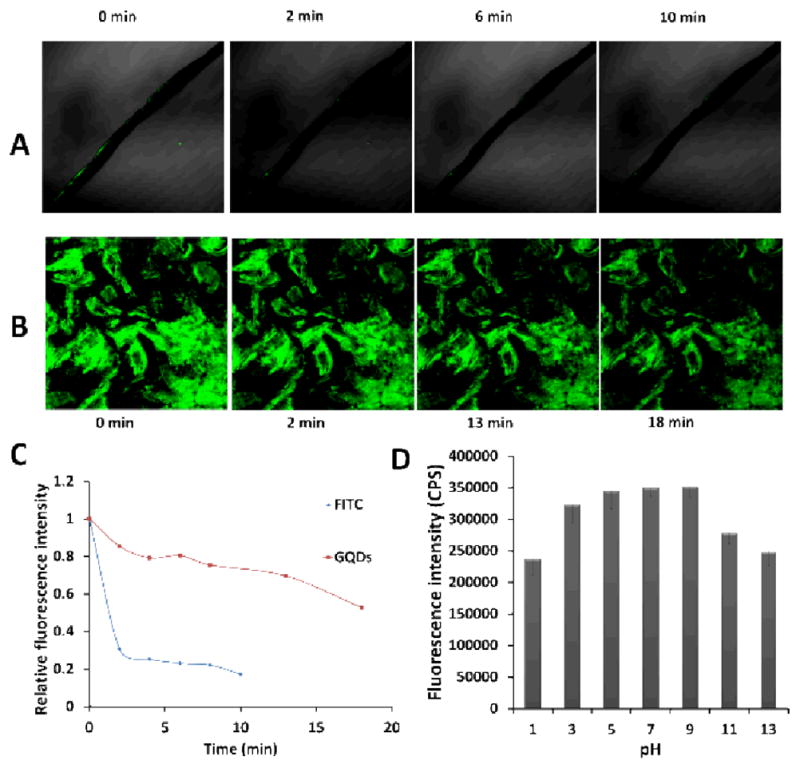
Comparison of the photostability of the GQDs with a fluorescent dye molecule FITC under the irradiation of a confocal laser. A, the confocal fluorescence images of FITC; B, the confocal fluorescence images of GQDs; C, the photostability of these two fluorescent materials; D, the effect of pH on the fluorescence intensity of the GQDs.
We also investigated the stability of the GQDs at different pH values (Figure 7D). The results showed that at pH 7.0 the GQDs had the highest fluorescence intensity. In the range of pH 5.0–9.0, the changes of the fluorescence intensity were less than 1.4 %. This range covered the majority of pH values of living systems. When the pH value was below 5.0 or higher than 9.0, the fluorescence intensity of the GQDs was reduced by 32.3 %. The significant stability of the GQDs over the broad pH range might come from the surface amino groups and carboxyl groups, which 5 could resist the pH effect on the fluorescence intensity of GQDs.
Besides the fluorescence emission in blue, green and red regions, the GQDs emitted relatively lower NIR fluorescence around 815 nm with the irradiation of 360 nm. The intensity ratio of 815 nm to 440 nm was 0.2 according to the fluorescence spectra (Figure 8 A). The NIR peak was significantly higher than the 2 λ diffraction peak as shown in Figure 8B. Similar to the fluorescence property in the visible region, the peak in the NIR region showed red shift if the excitation wavelength became longer (Figure 8B). Meanwhile, the fluorescence intensity of the GQDs in the NIR region was proportional to the concentration of the GQDs in the range of 0.468–15.000 mg/mL (Figure 8C). This relationship indicated that the NIR fluorescence must be attributed to the GQDs even though the mechanism was not clear yet. Notably, the Stokes shift of this NIR fluorescence was as large as 455 nm. The large Stokes shift provided the GQDs with significant advantages for fluorescence bioimaging and biosensing. The lifetime of the fluorescence at 815 nm with excitation of 370 nm was examined (Figure 6e). The result showed a similar value to that of the visible fluorescence. The short lifetime value eliminated the possibility of phosphorescence of the 815 nm peak.
Fig. 8.
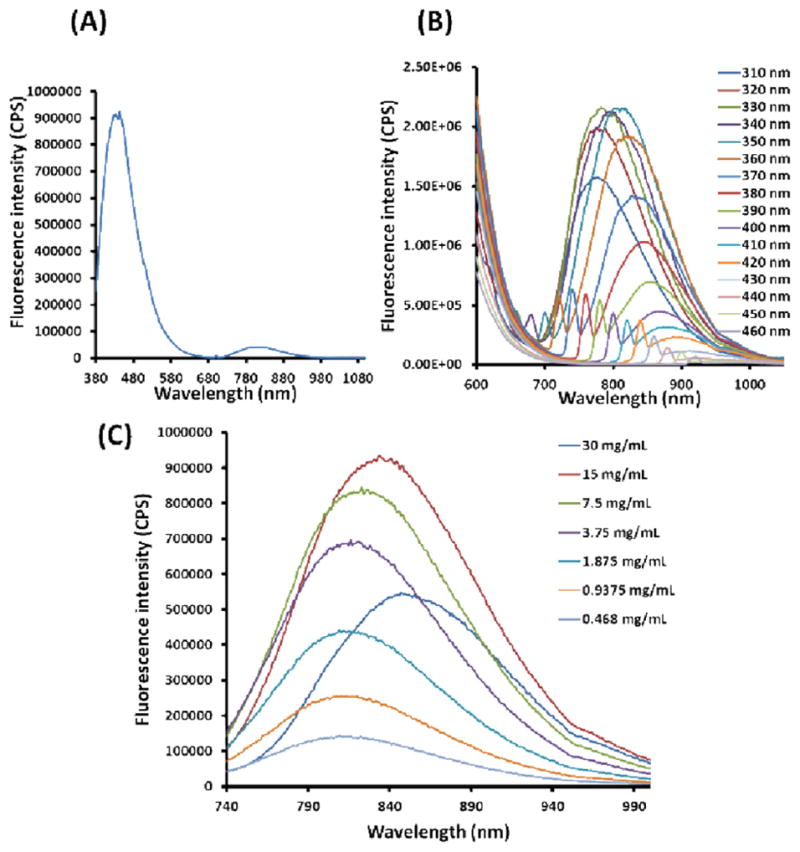
(A) Fluorescence emission spectrum of the GQDs in the visible-NIR region. (B) NIR fluorescence spectra of the GQDs under different excitation wavelengths. (C) The NIR fluorescence intensity vs. the concentration of GQDs.
In vitro fluorescence imaging using GQDs
Based on these excellent fluorescence properties, the bioimaging applications of the fluorescent GQDs were further investigated in vitro and in vivo. The in vitro fluorescence imaging using the developed GQDs was explored under different excitation wavelengths. After the GQDs were incubated with MH-S cells for 1 h, the fluorescence images of the cells were taken using a confocal microscope. As shown in Figure 9B, the MH-S cells incubated with GQDs in PBS buffer showed strong green (LP475) and red (LP 530) colors upon excitation at 458 nm and 514 nm, respectively. However, no apparent fluorescence was observed from the control group that was not incubated with the GQDs under the same conditions (Figure 9A). Our results demonstrated that the GQDs can emit strong fluorescence in the range of green to red for in vitro fluorescence imaging. The strong fluorescence on the MH-S cells incubated with GQDs suggested that GQDs had penetrated the cells and were able to label both the cell membrane and the cytoplasm of MH-S cells. The uptake of GQDs by MH-S cells would be similar to the pathway of nanoparticles, which is endocytosis.46
Fig. 9.
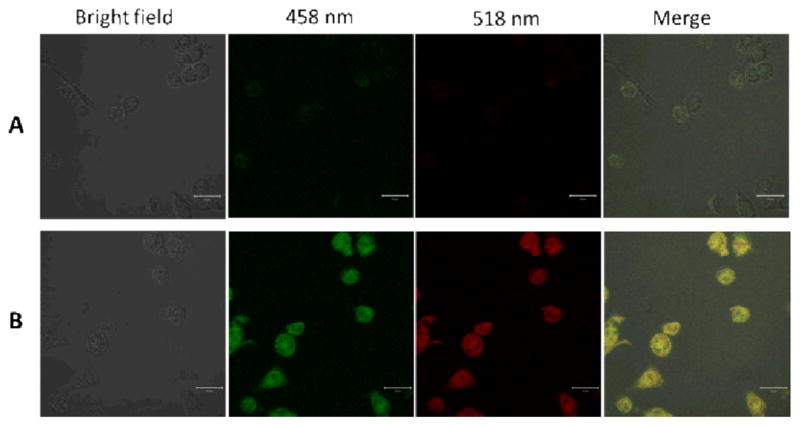
Caption Laser scanning confocal fluorescence microscopy images of MH-S cells. (A) Control MH-S cells without GQDs; (B) the MH-S cells treated with GQDs for 1 hour. All the scale bars was 20 μm.
In vivo fluorescence imaging using GQDs
The feasibility of the GQDs for in vivo bioimaging was investigated in mice. A 100 μL aliquot of 25 mg/mL GQDs were injected subcutaneously into the back of nude mice and intramuscularly into the right back leg. The fluorescence images of the mice under different excitation and emission filters were captured. As shown in Figure 10, various excitations from blue to red centered at 430, 465, 500, 535 and 605 nm were applied for the in vivo fluorescence imaging. The emission bandpass filters for each excitation wavelength were illustrated on the top of each image in Figure 10. With the excitation wavelength increased, all the fluorescence intensity decreased. Moreover, the detectable fluorescence region had extended with the longer excitation and emission wavelengths from the intramuscularly injection spot of the right back leg. This result demonstrated that the longer wavelengths had better penetration ability than the short wavelengths for the in vivo fluorescence imaging. Considering the decreased fluorescence intensity in the longer wavelengths, the optimal excitation and emission bandpass to obtain the highest signal-to-background ratio should be investigated in the future for further imaging applications. Overall, the in vivo fluorescence imaging in mice under subcutaneous and intramuscular injection indicated that the GQDs could be used as a fluorescent labeling agent for bioimaging in both visible and NIR regions.
Fig. 10.

In vivo fluorescence imaging of mice injected GQDs subcutaneously (spot a) and intramuscularly (spot b). The images were taken under various excitation wavelengths and emission wavelengths indicated on the top of each image. A 100 μL aliquot of 25 mg/mL GQDs was injected into each spot. The following emission bandpass filters were used: GFP: 515–575 nm; DsRed: 575–650 nm; Cy5.5: 695–770 nm.
Colorimetric detection of H2O2 using GQDs
To extend the application fields of the GQDs, in addition to the optical properties, we have investigated the catalytic ability of the GQDs. It was reported that the materials containing aromatic sp2 carbon clusters had the intrinsic peroxidase-like catalytic activity to produce a blue color reaction in the presence of H2O2 and peroxidase substrate, 3,3,5,5-tetramethylbenzidine (TMB). For example, both carbon nanotubes and graphene sheets were used for the label-free detection of glucose and single-nucleotide polymorphism through their intrinsic peroxidase-like catalytic activity.47, 48 Inspired by this work, we explored whether our GQDs could be used for label-free colorimetric sensing as a catalyst. With the addition of H2O2, the GQDs catalyzed the reduction of hydrogen peroxide indicated by the color change of the solution to green in the presence of the peroxidase substrate ABTS (Figure 11 inset). The absorbance change of ABTS at 416 nm could be used for monitoring the reaction rate and the peroxidase-like catalytic activity (Figure 11). Compared to the control groups including the solution without GQDs or H2O2, the signal-to-background ratio was higher than 9. Thus, the peroxidase-like catalytic activity of the GQDs would be used for the detection of H2O2, an important reactive oxygen species in the biomedical context.
Fig. 11.
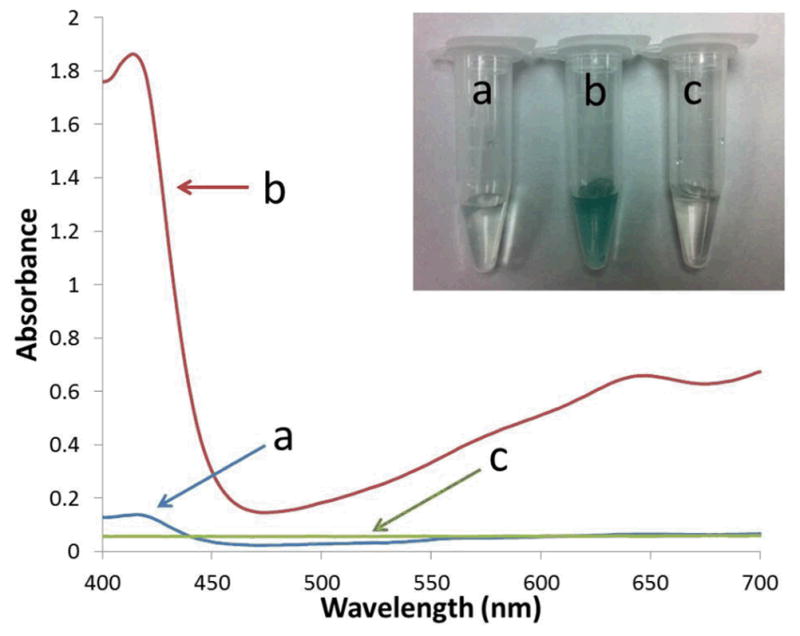
UV-vis absorption spectra of the ABTS solution containg a) 9 mM H2O2; b) 2.7 mg/mL GQDs with 9 mM H2O2; and c) 2.7 mg/mL GQDs. Inset: The corresponding photographs of these three samples.
We then optimized the detection conditions for catalyzing H2O2 reaction using the GQDs. The conditions included pH, reaction temperature, and concentrations of ABTS and GQDs. The pH value was a critical factor for the detection of H2O2. It was reported that the optimal pH for a carbon nanoparticle catalyzed H2O2 reaction was 4.0.49 Our results showed that, in a low pH range (3.0–5.0), the reaction rate was very stable (Figure 12 A). However, the reaction rate decreased above pH 5.0. Therefore, the pH 5.0 was chosen as the optimal pH. Meanwhile, the reaction temperature would affect the catalytic reaction rate. As shown in Figure 12 B, high temperature would increase the reaction rate. Considering normal mammalian body temperature, 37 °C was selected as the standard condition for analyzing H2O2. Apparently, the ABTS as a substrate could affect the sensitivity of the colorimetric detection of H2O2. As shown in Figure 12C, the reaction rate increased as the concentration of ABTS increased until a concentration of 7.2 mM was reached. Therefore, 7.2 mM of ABTS was chosen as the optimal concentration. Moreover, the concentration of GQDs was proportional to the reaction rate (Figure 12 D). However, a high concentration of GQDs would affect the absorption of the ABTS. Therefore, a concentration of 5.40 mg/mL GQDs was chosen as the optimal concentration for the detection.
Fig. 12.
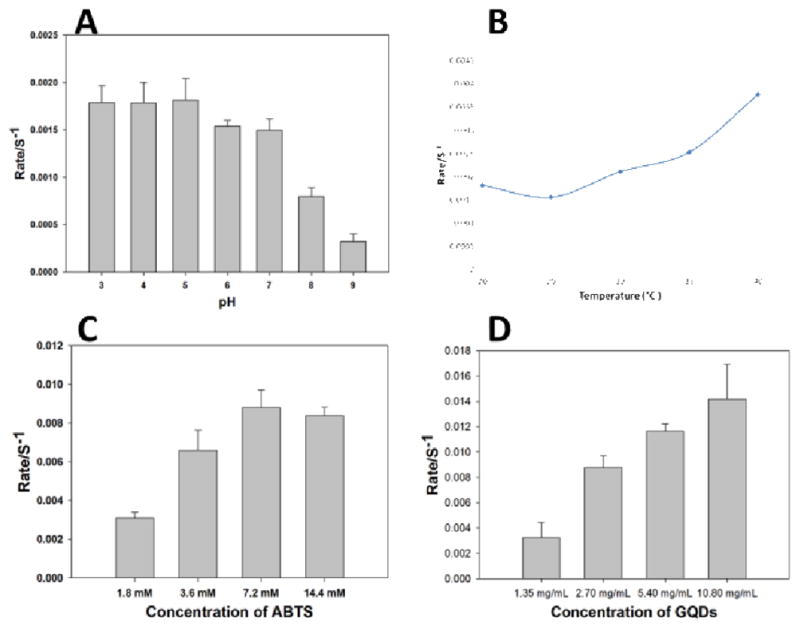
Optimization of the reaction conditions for the detection of H2O2. (A) pH; (B) temperature; (C) concentration of ABTS; (D) concentration of GQDs.
Under the above optimal conditions, the detection of H2O2 was carried out using this GQDs-based label-free colorimetric system. As shown in Figure 13 A, with the increase of the concentrations of H2O2, the absorbance increased in a concentration-dependent manner. This assay provided rapid detection (2 min) of H2O2 with the linear range from 0.1 mM to 10 mM (Figure 13 B). The limit of detection was 20 μM according to the calibration curve at a signal-to-background ratio of 3. Thus, our studies suggest that the GQDs may have potential for applications in the biosensing field.
Fig. 13.
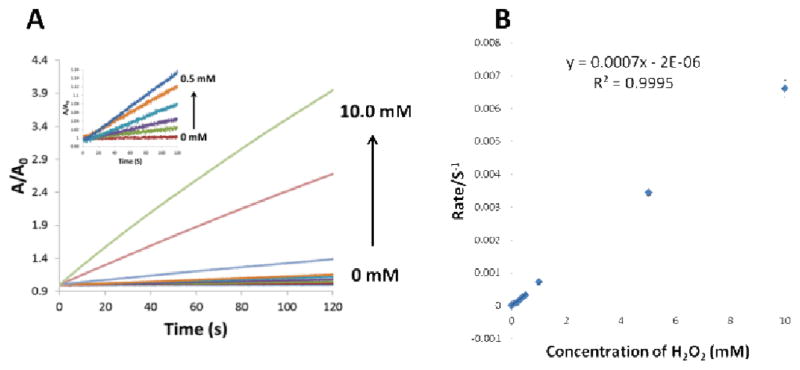
(A) The relationship of the absorption with the concentrations of H2O2 (from the bottom to the top: 0, 0.1, 0.2, 0.3, 0.4, 0.5, 1.0, 5.0 and 10.0 mM); (B) The calibration curve of the label-free colorimetric method for the detection of H2O2.
Conclusions
In conclusion, GQDs with excellent fluorescence properties and peroxidase-like activity were developed using a direct and simple pyrolysis of an amino acid, L-glutamic acid. The GQDs not only showed a stable, strong excitation-dependent photoluminescence with high quantum yield (54.5 %) in the blue to red range but also provided an excitation-dependent NIR fluorescence emission around 815 nm. Even though the mechanism of this NIR fluorescence emission was not well understood, the application potential of the NIR fluorescence was significant. By using a strong visible irradiation, the GQDs showed the potential to be used for in vitro and in vivo fluorescence imaging. Furthermore, the GQDs possessed a peroxidase-like activity which could catalyze the reduction of H2O2 in the presence of the ABTS substrate. Using the labelling-free colorimetric method, the GQDs may have broad applications in detecting H2O2, an important reactive oxygen species in biomedical context.
Acknowledgments
This work was supported by the National Science Foundation Grants CHE 0911472 and CHE 0947043 to J. Zhao; Flight Attendant Medical Research Institute (FAMRI, Grant #103007), National Institute of Health AI101973-01, and AI097532-01A1 to M.W. We thank the Edward C. Carlson Imaging Center at the University of North Dakota for providing the confocal fluorescence microscope and Mr. Blaise Mibeck for XRD profile at UND EERC.
References
- 1.Li H, He X, Kang Z, Huang H, Liu Y, Liu J, Lian S, Tsang CHA, Yang X, Lee ST. Angew Chem, Int Ed. 2010;49:4430. doi: 10.1002/anie.200906154. [DOI] [PubMed] [Google Scholar]
- 2.Mei Q, Zhang K, Guan G, Liu B, Wang S, Zhang Z. Chem Commun. 2010;46:7319. doi: 10.1039/c0cc02374d. [DOI] [PubMed] [Google Scholar]
- 3.Liu Z, Robinson JT, Tabakman SM, Yang K, Dai H. Mater Today. 2011;14:316. [Google Scholar]
- 4.Song Y, Qu K, Zhao C, Ren J, Qu X. Adv Mater. 2010;22:2206. doi: 10.1002/adma.200903783. [DOI] [PubMed] [Google Scholar]
- 5.Lightcap IV, Kamat PV. J Am Chem Soc. 2012;134:7109. doi: 10.1021/ja3012929. [DOI] [PubMed] [Google Scholar]
- 6.Yang X, Niu G, Cao X, Wen Y, Xiang R, Duan H, Chen Y. J Mater Chem. 2012;22:6649. [Google Scholar]
- 7.Eda G, Lin YY, Mattevi C, Yamaguchi H, Chen HA, Chen IS, Chen CW, Chhowalla M. Adv Mater. 2010;22:505. doi: 10.1002/adma.200901996. [DOI] [PubMed] [Google Scholar]
- 8.Loh KP, Bao Q, Eda G, Chhowalla M. Nat Chem. 2010;2:1015. doi: 10.1038/nchem.907. [DOI] [PubMed] [Google Scholar]
- 9.Kim S, Hwang SW, Kim MK, Shin DY, Shin DH, Kim CO, Yang SB, Park JH, Hwang E, Choi SH, Ko G, Sim S, Sone C, Choi HJ, Bae S, Hong BH. ACS nano. 2012;6:8203. doi: 10.1021/nn302878r. [DOI] [PubMed] [Google Scholar]
- 10.Pan D, Zhang J, Li Z, Wu M. Adv Mater. 2010;22:734. doi: 10.1002/adma.200902825. [DOI] [PubMed] [Google Scholar]
- 11.Dong Y, Li G, Zhou N, Wang R, Chi Y, Chen G. Anal Chem. 2012;84:8378. doi: 10.1021/ac301945z. [DOI] [PubMed] [Google Scholar]
- 12.Dong Y, Shao J, Chen C, Li H, Wang R, Chi Y, Lin X, Chen G. Carbon. 2012;50:4738. [Google Scholar]
- 13.Shen J, Zhu Y, Yang X, Li C. Chem Commun. 2012;48:3686. doi: 10.1039/c2cc00110a. [DOI] [PubMed] [Google Scholar]
- 14.Li Y, Zhao Y, Cheng H, Hu Y, Shi G, Dai L, Qu L. J Am Chem Soc. 2012;134:15. doi: 10.1021/ja206030c. [DOI] [PubMed] [Google Scholar]
- 15.Peng J, Gao W, Gupta BK, Liu Z, Romero-Aburto R, Ge L, Song L, Alemany LB, Zhan X, Gao G, Vithayathil SA, Kaipparettu BA, Marti AA, Hayashi T, Zhu JJ, Ajayan PM. Nano Lett. 2012;12:844. doi: 10.1021/nl2038979. [DOI] [PubMed] [Google Scholar]
- 16.Shen J, Zhu Y, Yang X, Zong J, Zhang J, Li C. New J Chem. 2012;36:97. [Google Scholar]
- 17.Li M, Wu W, Ren W, Cheng HM, Tang N, Zhong W, Du Y. Appl Phys Lett. 2012;101:103107. [Google Scholar]
- 18.Ritter KA, Lyding JW. Nat Mater. 2009;8:235. doi: 10.1038/nmat2378. [DOI] [PubMed] [Google Scholar]
- 19.Zhu S, Zhang J, Qiao C, Tang S, Li Y, Yuan W, Li B, Tian L, Liu F, Hu R, Gao H, Wei H, Zhang H, Sun H, Yang B. Chem Commun. 2011;47:6858. doi: 10.1039/c1cc11122a. [DOI] [PubMed] [Google Scholar]
- 20.Zhu S, Zhang J, Tang S, Qiao C, Wang L, Wang H, Liu X, Li B, Li Y, Yu W, Wang X, Sun H, Yang B. Adv Funct Mater. 2012;22:4732. [Google Scholar]
- 21.Tang L, Ji R, Cao X, Lin J, Jiang H, Li X, Teng KS, Luk CM, Zeng S, Hao J, Lau SP. ACS nano. 2012;6:5102. doi: 10.1021/nn300760g. [DOI] [PubMed] [Google Scholar]
- 22.Freeman R, Finder T, Willner I. Angew Chem, Int Ed. 2009;48:7818. doi: 10.1002/anie.200902395. [DOI] [PubMed] [Google Scholar]
- 23.Dong H, Gao W, Yan F, Ji H, Ju H. Anal Chem. 2010;82:5511. doi: 10.1021/ac100852z. [DOI] [PubMed] [Google Scholar]
- 24.Di Corato R, Bigall NC, Ragusa A, Dorfs D, Genovese A, Marotta R, Manna L, Pellegrino T. ACS nano. 2011;5:1109. doi: 10.1021/nn102761t. [DOI] [PubMed] [Google Scholar]
- 25.Hong G, Robinson JT, Zhang Y, Diao S, Antaris AL, Wang Q, Dai H. Angew Chem, Int Ed. 2012;51:9818. doi: 10.1002/anie.201206059. [DOI] [PubMed] [Google Scholar]
- 26.Gao X, Cui Y, Levenson RM, Chung LWK, Nie S. Nat Biotech. 2004;22:969. doi: 10.1038/nbt994. [DOI] [PubMed] [Google Scholar]
- 27.Ye L, Yong KT, Liu L, Roy I, Hu R, Zhu J, Cai H, Law WC, Liu J, Wang K, Liu J, Liu Y, Hu Y, Zhang X, Swihart MT, Prasad PN. Nat Nano. 2012;7:453. doi: 10.1038/nnano.2012.74. [DOI] [PubMed] [Google Scholar]
- 28.Dubertret B, Skourides P, Norris DJ, Noireaux V, Brivanlou AH, Libchaber A. Science. 2002;298:1759. doi: 10.1126/science.1077194. [DOI] [PubMed] [Google Scholar]
- 29.Gupta V, Chaudhary N, Srivastava R, Sharma GD, Bhardwaj R, Chand S. J Am Chem Soc. 2011;133:9960. doi: 10.1021/ja2036749. [DOI] [PubMed] [Google Scholar]
- 30.Ran X, Sun H, Pu F, Ren J, Qu X. Chem Commun. 2013;49:1079. doi: 10.1039/c2cc38403e. [DOI] [PubMed] [Google Scholar]
- 31.Sun X, Liu Z, Welsher K, Robinson JT, Goodwin A, Zaric S, Dai H. Nano Res. 2008;1:203. doi: 10.1007/s12274-008-8021-8. [DOI] [PMC free article] [PubMed] [Google Scholar]
- 32.Zhou X, Zhang Y, Wang C, Wu X, Yang Y, Zheng B, Wu H, Guo S, Zhang J. ACS nano. 2012;6:6592. doi: 10.1021/nn301629v. [DOI] [PubMed] [Google Scholar]
- 33.Li LL, Ji J, Fei R, Wang CZ, Lu Q, Zhang JR, Jiang LP, Zhu JJ. Adv Funct Mater. 2012;22:2971. [Google Scholar]
- 34.Li Y, Hu Y, Zhao Y, Shi G, Deng L, Hou Y, Qu L. Adv Mater. 2011;23:776. doi: 10.1002/adma.201003819. [DOI] [PubMed] [Google Scholar]
- 35.Zhuo S, Shao M, Lee ST. ACS nano. 2012;6:1059. doi: 10.1021/nn2040395. [DOI] [PubMed] [Google Scholar]
- 36.Robinson JT, Tabakman SM, Liang Y, Wang H, Casalongue HS, Vinh D, Dai H. J Am Chem Soc. 2011;133:6825. doi: 10.1021/ja2010175. [DOI] [PubMed] [Google Scholar]
- 37.Liu R, Wu D, Feng X, Mullen K. J Am Chem Soc. 2011;133:15221. doi: 10.1021/ja204953k. [DOI] [PubMed] [Google Scholar]
- 38.Yan X, Cui X, Li LS. J Am Chem Soc. 2010;132:5944. doi: 10.1021/ja1009376. [DOI] [PubMed] [Google Scholar]
- 39.Magde D, Wong R, Seybold PG. Photochem Photobiol. 2002;75:327. doi: 10.1562/0031-8655(2002)075<0327:fqyatr>2.0.co;2. [DOI] [PubMed] [Google Scholar]
- 40.Shen J, Snook RD. Chem Phys Lett. 1989;155:583. [Google Scholar]
- 41.Zhai X, Zhang P, Liu C, Bai T, Li W, Dai L, Liu W. Chem Commun. 2012;48:7955. doi: 10.1039/c2cc33869f. [DOI] [PubMed] [Google Scholar]
- 42.Jiang J, He Y, Li S, Cui H. Chem Commun. 2012;48:9634. doi: 10.1039/c2cc34612e. [DOI] [PubMed] [Google Scholar]
- 43.Zhu H, Wang X, Li Y, Wang Z, Yang F, Yang X. Chem Commun. 2009:5118. doi: 10.1039/b907612c. [DOI] [PubMed] [Google Scholar]
- 44.Baskin Y, Meyer L. Phys Rev. 1955;100:544. [Google Scholar]
- 45.Kwon W, Rhee SW. Chem Commun. 2012;48:5256. doi: 10.1039/c2cc31687k. [DOI] [PubMed] [Google Scholar]
- 46.Jin Y, Kannan S, Wu M, Zhao JX. Chem Res Toxicol. 2007;20:1126. doi: 10.1021/tx7001959. [DOI] [PubMed] [Google Scholar]
- 47.Guo Y, Deng L, Li J, Guo S, Wang E, Dong S. ACS nano. 2011;5:1282. doi: 10.1021/nn1029586. [DOI] [PubMed] [Google Scholar]
- 48.Song Y, Wang X, Zhao C, Qu K, Ren J, Qu X. Chemistry. 2010;16:3617. doi: 10.1002/chem.200902643. [DOI] [PubMed] [Google Scholar]
- 49.Wang X, Qu K, Xu B, Ren J, Qu X. Nano Res. 2011;4:908. [Google Scholar]