Abstract
We observed elevated air pollutant concentrations, especially of ultrafine particles (UFP), black carbon (BC) and NO, across the residential neighborhood of the Boyle Heights Community (BH) of Los Angeles, California. Using an electric vehicle mobile platform equipped with fast response instruments, real-time air pollutant concentrations were measured in BH in spring and summer of 2008. Pollutant concentrations varied significantly in the two seasons, on different days, and by time of day, with an overall average UFP concentration in the residential areas of ~33 000 cm−3. The averaged UFP, BC, and NO concentrations measured on Soto St, a major surface street in BH, were 57 000 cm−3, 5.1 µg m−3, and 67 ppb, respectively. Concentrations of UFP across the residential areas in BH were nearly uniform spatially, in contrast to other areas in the greater metropolitan area of Los Angeles where UFP concentrations exhibit strong gradients downwind of roadways. We attribute this “UFP cloud” to high traffic volumes, including heavy duty diesel trucks on the freeways which surround and traverse BH, and substantial numbers of high-emitting vehicles (HEVs) on the surface streets traversing BH. Additionally, the high density of stop signs and lights and short block lengths, requiring frequent accelerations of vehicles, may contribute. The data also support a role for photochemical production of UFP in the afternoon. UFP concentration peaks (5 s average) of up to 9 million particles cm−3 were also observed immediately behind HEVs when they accelerated from stop lights in the BH neighborhood and areas immediately adjacent. Although encounters with HEV during mornings accounted for only about 6% and 17% of time spent monitoring residential areas and major surface streets, HEV contributed to about 28% and 53% of total ultrafine particles measured on the route, respectively. The observation of elevated pollutant number concentrations across the Boyle Heights community highlights how multiple factors combine to create high pollutant levels, and has important human exposure assessment implications, including the potential utility of our data as inputs to epidemiological studies.
Keywords: Vehicle emissions, Mobile Platform, Exposure Assessment, Ultrafine Particle, Freeway, New particle formation, Boyle Heights
1. Introduction
Numerous urban air pollutants, including ultrafine particles (UFP), black carbon (BC), oxides of nitrogen (NOx), particle-bound polycyclic aromatic hydrocarbon (PB-PAH), carbon monoxide (CO), carbon dioxide (CO2), and volatile organic compounds (VOC), are strongly associated with local combustion sources such as motor vehicle emissions. During the daytime, vehicle-related pollutant concentrations exhibit sharp gradients downwind of roadways, spiking at the roadways and then decaying to background levels at about 200–300 m downwind (Hitchins et al. 2000, Zhu et al. 2002). Recently, it has been shown that during pre-sunrise hours the impact distances from roadways are much longer, extending downwind more than 2000 m (Hu et al. 2009), during nocturnal temperature inversions and low wind speeds.
Pollutant concentration gradients surrounding local sources such as roadways are critically important in determining exposure at the individual level. Numerous epidemiological studies have linked close proximity to heavily traveled roadways with significantly increased adverse health effects, including both morbidity and mortality (e.g., Brunekreef et al. 1997; Knox and Gilman 1997; Pearson et al. 2000; Hoek et al. 2002; Lin et al. 2002; Gauderman et al. 2007; Kan et al. 2007; Sandstrom and Brunekreef 2007; Brauer et al. 2008; Hart et al. 2009). Vehicles equipped with fast-response monitoring instruments have recently been providing many insights into pollutant gradients and “hot spots” from a variety of sources (Bukowiecki et al. 2002; Kittelson et al. 2004j; Isakov et al. 2007; Baldauf et al. 2008; Fruin et al. 2008; Hu et al. 2009; Kozawa et al. 2009; Ning et al. 2010). While traveling at normal vehicle speeds and on fixed routes, mobile instrumented platforms can capture pollutant concentrations and gradients in proximity to local emission sources, and contrast these with background pollutant concentrations measured in adjacent residential areas (Kozawa et al. 2009).
The current study used a mobile platform (MP) to generate data on vehicle-related pollutant concentrations and gradients in Boyle Heights (BH), California, an area bounded by half a dozen freeways and traversed by several major surface streets with heavy traffic flows, including heavy-duty diesel trucks (HDDT) and high-emitting gasoline vehicles (HEGV). Concentrations of pollutants (primarily UFP, BC, NOx, PB-PAH, CO and CO2) on roadways, near freeways, and in the residential areas were measured in BH in spring and summer of 2008 to characterize local pollutant sources and their impacts in an area containing and surrounded by an unusually dense occurrence of traffic-related sources.
2. Methods
2.1 Mobile Platform and Data Collection
A Toyota RAV4 sub-SUV electric vehicle free from self pollution served as the mobile platform. Table 1 lists of sampling instruments and equipment installed on the mobile platform. The time resolution for most instruments is between 5 to 20 seconds; the Aethalometer has one minute time resolution. The average speed of the mobile platform was about 6 m/s which determined the average spatial resolution of our measurement, e.g. an instrument having a 5s time resolution would have a spatial resolution of about 30 m. The instrument power supply and sampling manifold is similar to that described by Westerdahl et al. (2005). Calibration and flow checks were conducted on a bi-monthly and daily basis, respectively, as described in Hu et al. (2009) and Kozawa et al. (2009).
Table 1.
Monitoring instruments on the mobile platform.
| Instrument | Measurement Parameter | Time Resolution |
|---|---|---|
| TSI Portable CPC, Model 3007 | UFP Count (10 nm-1um) | 5 s |
| TSI FMPS, Model 3091 | UFP Size (5.6–560 nm) | 5 s |
| TSI DustTrak, Model 8520 | PM2.5 Mass | 5 s |
| Magee Scientific Aethalometer | Black Carbon | 1 min |
| EcoChem PAS 2000 | Particle Bound PAH | 5 s |
| Teledyne API Model 300E | CO | 20 s |
| LI-COR, Model LI-820 | CO2 | 10 s |
| Teledyne-API Model 200E | NOx, NO, NO2 | 20 s |
| Vaisala Sonic Anemometer and Temperature/RH Sensor | Local Wind Speed and Direction, Temperature, Relative Humidity (RH) | 1s |
| Stalker LIDAR and Vision Digital System | Traffic Documentation, Distance and Relative Speed | 1s |
Measurement times and associated meteorological conditions are listed in Table 2. For each season, measurements were conducted 4–5 weekdays between Monday and Friday and each day had two measurement periods, one in the morning and one in the afternoon, of about 30–50 min duration. For each morning/afternoon run, the mobile platform was driven on a route developed for BH, starting at approximately the same time each day. In the spring, measurements were also collected on the BH route on a Saturday.
Table 2.
Measurement times and meteorological conditions (2008).
| Date | Day | Relative Humiditya(%) |
Temperaturea (°C) |
Wind Speedb (m/s) |
Wind Direction b(degree) |
||||
|---|---|---|---|---|---|---|---|---|---|
| AM | PM | AM | PM | AM | PM | AM | PM | ||
| March 26 | Wednesday | 70 | 59 | 17.8 | 20 | 1.0 | 1.7 | 254 | 282 |
| March 27 | Thursday | 54 | 41 | 19.7 | 20.2 | 0.9 | 1.7 | 264 | 262 |
| April 3 | Thursday | 75 | 63 | 14.7 | 18.3 | 1.3 | 1.7 | 275 | 266 |
| April 4 | Friday | 64 | - | 19.2 | - | 0.9 | - | 200 | - |
| April 5 | Saturday | 65 | 63 | 16.4 | 17.7 | 1.6 | 1.2 | 116 | 119 |
| April 7 | Monday | 59 | 56 | 18.3 | 18.3 | 0.9 | 1.7 | 98 | 354 |
| July 14 | Monday | 54 | 41 | 27.1 | 28.3 | 1.2 | 3.2 | 300 | 287 |
| July 16 | Wednesday | 51 | 52 | 28.6 | 28.1 | 1.2 | 1.9 | 340 | 143 |
| July 18 | Friday | 68 | 61 | 24.4 | 26.7 | 1.6 | 2.0 | 142 | 265 |
| July 22 | Tuesday | 59 | 55 | 25.6 | 27.5 | 0.8 | 1.9 | 293 | 308 |
| July 24 | Thursday | 61 | 55 | 24.1 | 25.9 | 0.9 | 1.8 | 360 | 287 |
Data were obtained from a preliminary database provided by California Air Resources Board for the North Main Street air monitoring station about 2 km north of Boyle Heights.
Data were obtained from the instruments on the mobile platform.
Real-time traffic flow on the freeway was obtained from the Freeway Performance Measurement System (PeMS) provided by the UC Berkeley Institute of Transportation.
2.2 Route
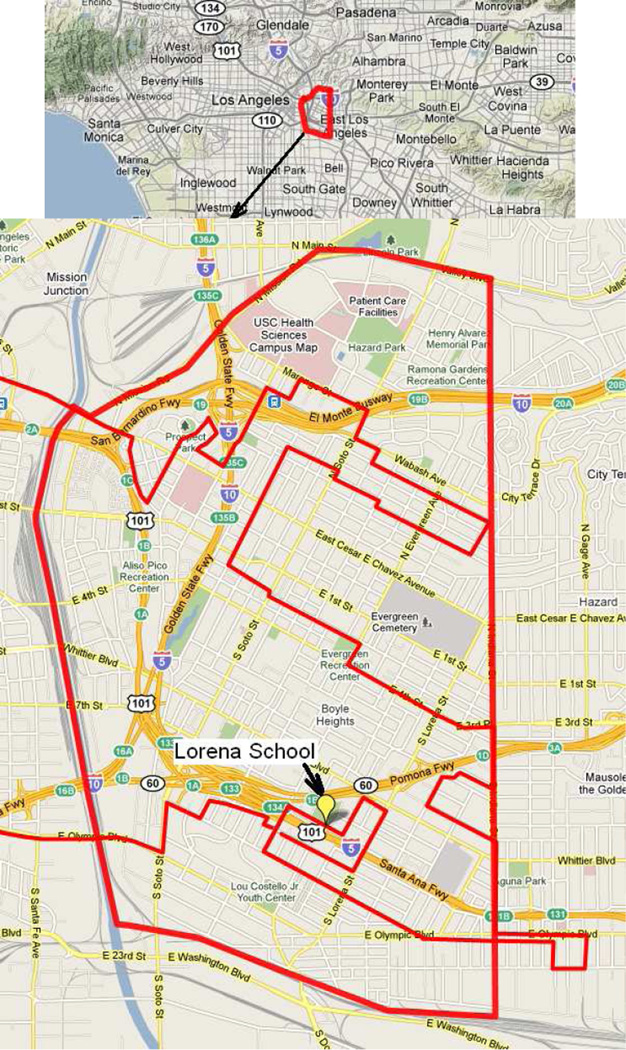
Figure 1 shows the Boyle Heights route. The community is located east of Downtown Los Angeles, separated by the Los Angeles River. The north, west, and south sides of the BH area are bounded by rail lines, and the east side abuts the community of City Terrace. BH occupies a relatively small area, 5 500 m by 3 500 m, but the community is surrounded or traversed by segments of five freeways, as well as six major surface streets and tens of minor surface streets, forming a dense roadway network. Houston et al. (2004) showed that although BH and other minority and high-poverty neighborhoods in Los Angeles have among the lowest vehicle ownership rates, they experience more than two times the level of traffic density compared to the rest of the southern California region. Based on the 2000 Census, the population in BH was about 87 000, with 36% under age 18, with about 22 000 housing units (Los Angeles Times database, Laalmanac.com). Land use is primarily residential, with about 5 000 residents per square kilometer, but also includes commercial shops and amenities.
Figure 1.
Route for Boyle Heights. The thick line represents the boundary of the Boyle Heights community.
The MP route was selected to collect representative air pollutant concentrations and concentration gradients near freeways, on major surface streets with higher traffic densities (such as Soto St and Cesar Chavez Blvd) and in the interiors of the residential neighborhoods in Boyle Heights.
2.3 Data Analysis and Selection of Key Pollutants
Data were adjusted for the varying response times of the instruments on the mobile platform to synchronize the measurements. NOx, CO, CO2, and particulate data (UFP, BC, and PM2.5 mass) were synchronized with PB-PAH concentrations measured by the PAS instrument, which had the fastest response time. NO, UFP, and BC were selected in the present study for detailed spatial analysis because of their large variation on and near roadways.
To account for the different pollutant sources and associated impacts, two microenvironments were investigated: (a) Residential area: measurements on minor surface streets at least 200 m down wind and 50 m upwind of freeways and major surface streets; and (b) On-road: measured on one of the six major surface streets, including E Cesar E Chavez Ave, N Soto St, E 4th St, N Lorena St, S Indiana St, and E Olympic Blvd.
3. Results
3.1 Traffic flows on the I-5 freeway
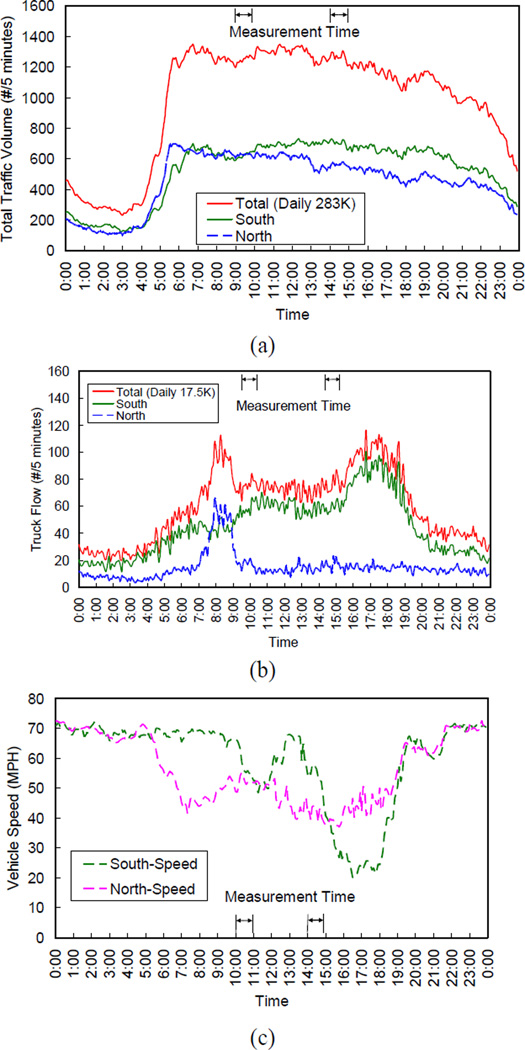
Daily total traffic volumes on the I-5 freeway bordering BH averaged 283 000 vehicles, varying within 4.3% from day-to-day on weekdays (Fig. 2). The weekend day (April, 5, 2008) had about 3.8% more traffic than the weekday average. Traffic flows were nearly constant from 06:00 to 13:00 at ~1300 vehicles per 5 min. They then decreased slowly to ~1100 vehicles per 5 min at 19:00, and dropped off more steeply after that.
Figure 2.
Diurnal traffic patterns on the I-5 freeway in Boyle Heights. (a) Total traffic volumes; (b) Truck volumes; (c) Speed.
High daily truck volumes were recorded on the section of I-5 freeway in the BH area, averaging 17 500 counts per day, accounting for about 6% of the daily total traffic counts (Figure 2(b)). Between 08:00–19:00, total truck volumes remained above 80 counts per 5 minutes, and two rush hour peaks above 100 per 5 min occurred in the morning and afternoon.
The diurnal patterns of speeds on the section of I-5 freeway in BH are shown in Figure 2(c). In general, vehicle speeds were above 40 MPH in both north and south directions during most of the day, except between 15:00–19:00 when speeds were significantly slower in the south lanes. During this period, speeds dropped to about 20 MPH for about two hours.
3.2. Meteorological conditions
Meteorological conditions, including atmospheric stability, temperature, wind speed and wind direction, play an important role in determining air pollutant concentrations and gradients in ambient air, especially in the vicinities of roadways (e.g., Calder, 1973, Zhu et. al. 2005, Kozawa et al. 2009, Hu et al. 2009). A wide variety of meteorological parameters are available from various data sources for the dates of our measurements, from national weather archives, local airports, the South Coast Air Quality Management District (SCAQMD), including the North Main site located 2 km from Boyle Heights. Data collected with the mobile platform when stopped (Table 2), and vertical structure data are provided here to give a brief qualitative description of prevailing meteorology on the measurement days.
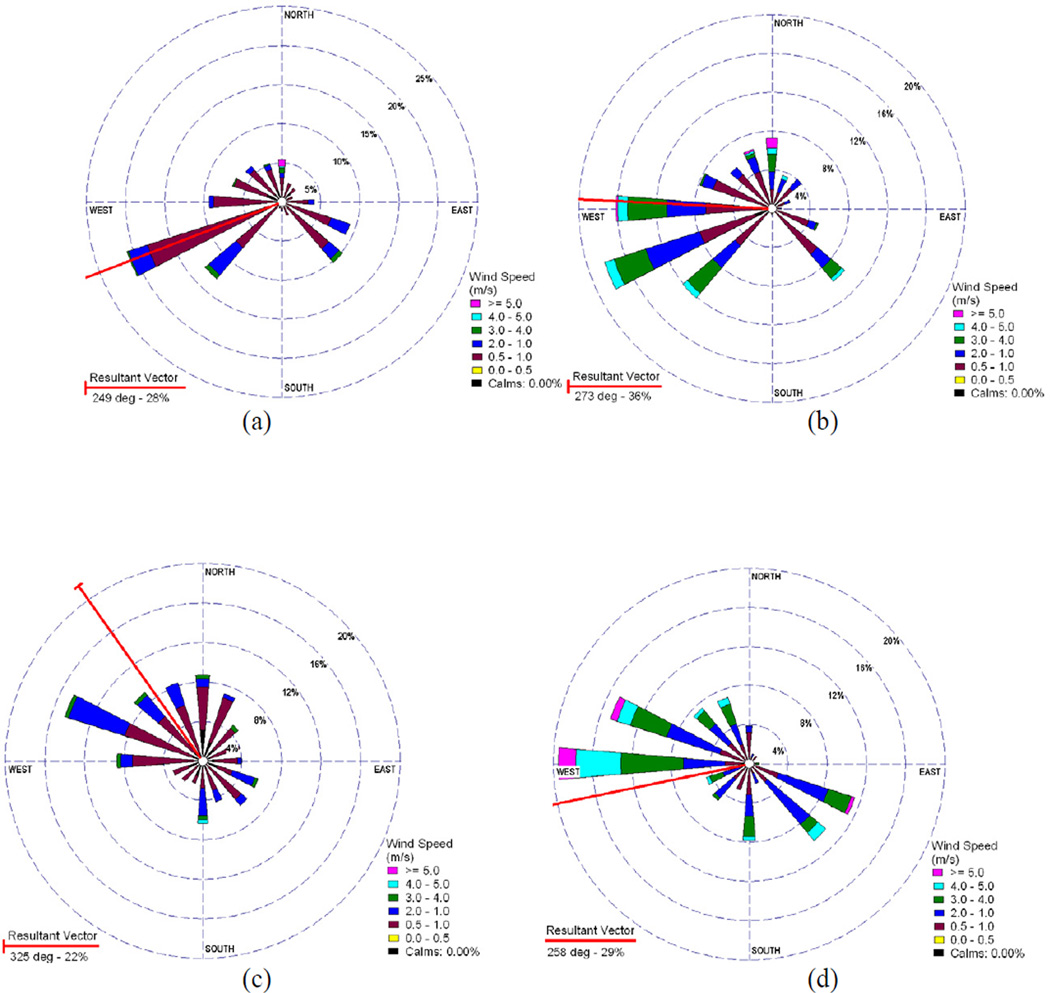
Temperatures fell in narrow ranges for each period: 15–20 °C and 18–20 °C, during spring and summer mornings, respectively; spring and summer afternoons averaged in the 24–29 °C and 26–28 °C ranges, respectively. Relative humidities also varied little from day to day in each season (Table 2) and time period, with values somewhat higher in the mornings. Averaged wind speeds measured by the mobile platform were 0.8–1.6 m/s in the mornings and 1.2–3.2 m/s in the afternoons for both the spring and summer seasons. Figure 3 shows the wind roses and vector-averaged wind orientations for mornings and afternoons in the spring and summer seasons. Averaged wind directions measured by the MP were predominantly W/SW/NW during most of the measurement periods. Under these conditions, BH was downwind of the I-5 freeway.
Figure 3.
Wind roses for the measurement times in BH. (a) Spring mornings; (b) Spring afternoons; (c) Summer mornings; (d) Summer afternoons;
Vertical temperature structure data collected by the SCAQMD at Los Angeles Airport (LAX), ~ 18 km southwest of the Boyle Heights, from 130 to ~850 m provides insights into day-to-day variations and comparability of mixing heights. The summer profiles indicate the typical poor mixing common in summer in the Los Angeles area. On July 16, the vertical profile was inverted at the lower edge of the measurements, indicating a mixing height of no more than 130 m. For all other summer dates, profiles exhibited a clear inversion base between 200–400 m (other dates) and were strongly sub-adiabatic below the inversion base, changing little over the course of the day. Spring days were much more variable from day-to-day, and within days, ranging from neutrally stable (April 3, 7) to sub adiabatic (March 27, April 5) to inverted (March 26, April 4).
3.3. Air pollutant concentrations observed in Boyle Heights
The overall average UFP concentrations (mornings and afternoons and both seasons combined) in the residential area and on the major streets in BH were 33 000 cm−3, 57 000 cm−3, respectively. The average levels in the BH residential areas were approximately double the average levels observed in residential areas in West Los Angeles made under similar meteorological conditions within 2 weeks of the Boyle Heights measurements (Winer et al., 2010). They also appear to be about 25% higher than the average of other adjacent and nearby residential neighborhoods, including University Park, Downtown and Southeast Los Angeles, observed on the same measurement days (Winer et al., 2010). Average concentrations of other pollutants such as BC and NO, were also elevated in the on-road, near-road, and residential microenvironments.
3.3.1 Real-time temporal and spatial distributions of pollutants in BH
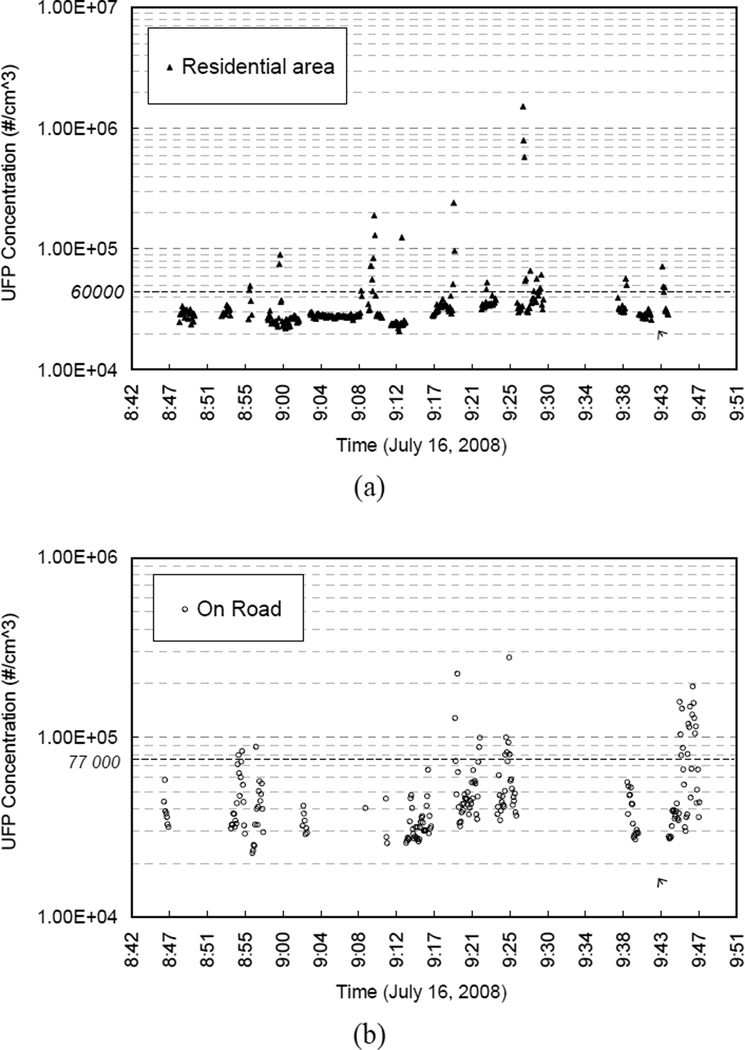
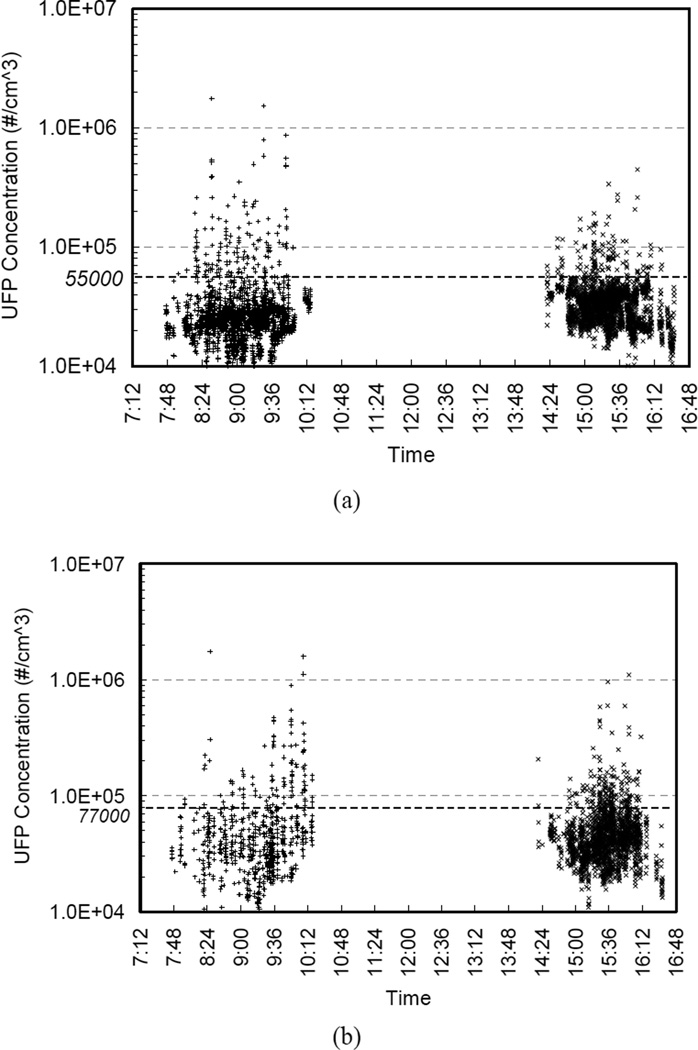
Figure 4 shows representative time series of the UFP concentrations measured in the residential and on-road microenvironments (morning of July 16), together with “threshold” UFP levels, which are discussed below. The residential trace presents a fairly uniform background with scattered encounters with HEV. In contrast, the on-road data do not have a clear background due to continual encounters with HEV plumes in various states of dilution. Figure 5 shows time-series plots of UFP concentrations in BH for all measurement days for the residential areas and on the major streets. For the residential microenvironment (route segments that were at least 50 m upwind and 200 m downwind of freeways and major streets during the MP measurement), UPF concentrations fall mostly in a range between 20 000 and 30 000 cm−3 in the morning and 20 000 and 45 000 in the afternoon. UFP spikes due to HEV encounters were more frequent in the morning than in the afternoon, as the mobile platform appears to have encountered more high-emitting vehicles in the morning, possibly associated with a greater volume of high-emitting delivery or service vehicles in the morning. The UFP spikes, although brief, corresponded to UFP concentrations of up to 1.5×106 cm−3, 30–50 times the residential area background levels and 15 –30 the on-road levels. Table 2 includes the coefficients of variance (COV) for the residential and on-road data, with and without the high emitters removed. This metric somewhat over-represents the variability in the residential areas because the average UFP concentration is smaller in the residential areas compared to on roadways; however it generally provides support for the interpretations, illustrated in both Figures 4 and 5, that the UFP concentrations are relatively uniform in the residential neighborhoods, and there is more influence of high emitting vehicles in the mornings.
Figure 4.
Time series plot of UFP concentrations measured in BH on the morning of July 16, 2008. (a). Residential area; (b). On road. The dashed lines indicate HEV threshold concentrations, 55 000 cm−3 and 77 000 cm−3 in the residential area and on road, respectively (see discussion in Section 4.1.1).
Figure 5.
Time series plot of UFP concentrations measured in BH on all the measurement days. (a) In the residential areas; (b) On surface streets.
3.3.2 Daily pollutant concentrations in BH
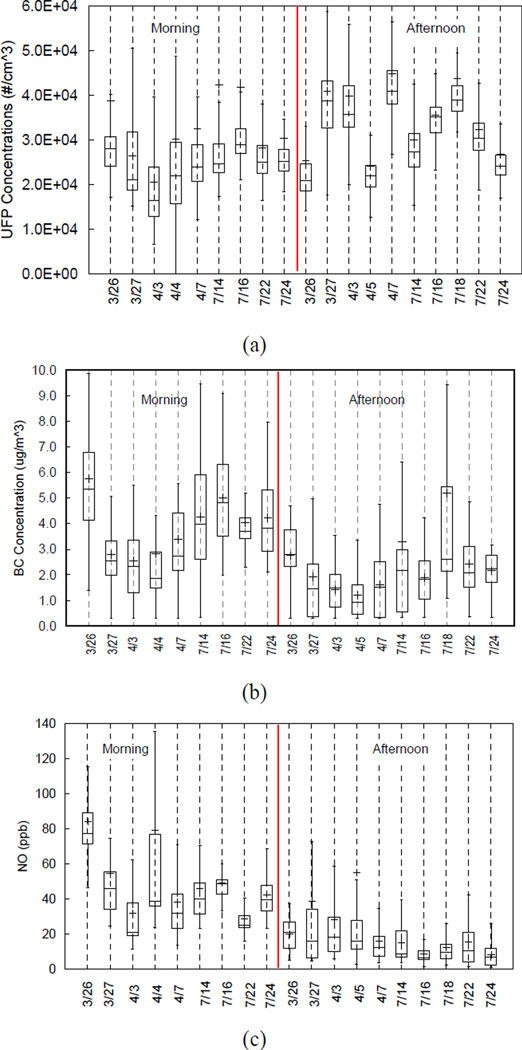
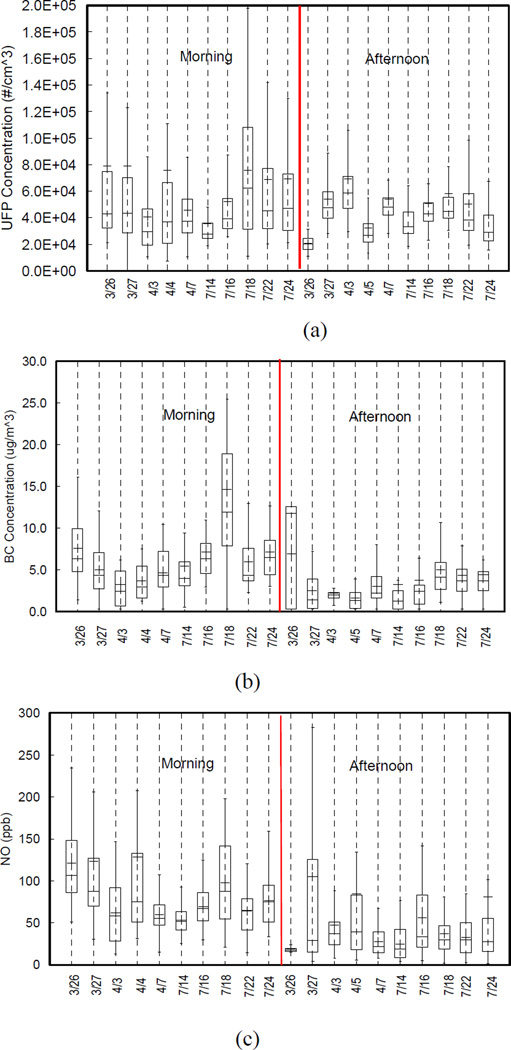
Figures 6–7 show the averages and ranges of UFP, BC, and NO in the residential areas and on the major surface streets in the morning and afternoon for all measurement days. By most metrics (with a few exceptions) spring mornings were the most variable, summer afternoons the least variable, with spring afternoons and summer mornings falling in between. Temperature structure and mixing heights were more variable in spring and winds speeds were generally higher in the afternoons, both factors that are consistent with the observed trends of the pollutant concentrations.
Figure 6.
Daily average pollutant concentrations in the residential areas in BH. (a) UFP; (b) BC; (c) NO. The symbol + in the box means the average and line in the box indicates median.
Figure 7.
Daily average pollutant concentrations on the major streets in BH. (a) UFP; (b) BC; (c) NO. The symbol + in the box means the average and line in the box indicates median.
3.3.2.1 Residential Areas
NO and BC exhibited divergent diurnal trends from UFP, and in some respects from each other (Figure 6): NO and BC concentrations were more variable in the morning while UFP was more variable in the afternoon. Both NO and BC were higher in the mornings, while UFP concentrations were usually higher in the afternoon. NO was larger by a factor of 3.1 and BC by a factor of 1.8 in the morning compared to the afternoon for all data. The larger difference between morning and afternoon for NO vs. BC is likely due to more rapid photochemical conversion of NO to NO2 in the afternoon, while BC is a relatively conservative pollutant. Elevated primary pollutant concentrations in the morning relative to the afternoons are commonly observed (e.g., Kozawa et al. 2009, Hu et al. 2009) in the SoCAB due to lower wind speeds in the morning vs afternoon, sometimes accompanied by lower mixing heights.
The overall average afternoon UFP concentrations were about 30% higher than morning, and the median UFP concentration was lower in the afternoon on only two of the measurement days. Higher UFP concentrations in the afternoon vs. morning are in sharp contrast to observations obtained with the mobile platform at the ports of the Los Angeles region (Kozawa et al. 2009) and in W. Los Angeles (Hu et al. 2009), both coastal areas with persistent low levels of photochemical oxidants on most days. Higher UFP concentrations in the afternoon vs. the morning have also been observed at a measurement station on the east side of I-110 in Downtown Los Angeles (Moore et al. 2007; Ning et al. 2007) and attributed to fresh particle nucleation in the afternoon (Moore et al. 2007; Ning et al. 2007). This observation is discussed further below.
3.3.2.2 On-road
Pollutant concentrations on the major streets in BH (Fig. 7) were highly elevated compared to residential areas. Average UFP, BC, and NO concentrations during mornings were 63 000 cm−3, 7.0 µg m−3, and 84 ppb, respectively, 1.6–2.0 times the residential area concentrations. During the afternoons, the average UFP, BC, and NO concentrations were 51 000 cm−3, 3.6 µg m−3, and 55 ppb, respectively, 1.5–2.3 times the residential area concentrations. In contrast to residential areas, UFP concentrations on major surface streets were mostly higher in the mornings than in the afternoons, a typical diurnal pattern expected based on lower AM wind speeds and somewhat higher traffic flows.
3.4 Contribution of photochemical formation of UFP
Photochemical particle formation offers a plausible explanation for our observation of higher UFP in the afternoons in BH residential areas compared to the mornings. Over the time scale of a few hours, BC and CO are both reasonably conserved markers of combustion, their concentrations controlled primarily by the competing effects of source emissions, atmospheric dilution, and some coagulation and deposition of smaller BC particles. UFP are emitted by the same sources, but have higher loss rates due primarily to rapid coagulation and in some cases, evaporation and evaporation-enhanced coagulation (Jacobson et al. 2005). Since each of the three effects should increase with the higher temperatures typical of the afternoons, their effect should, if anything, be to decrease relative levels of UFP compared to CO and BC in the afternoons relative to mornings. This is opposite of the observed trend, and consistent with photochemical production of freshly nucleated particles.
The fact that the trend goes in the opposite direction supports the notion of a large role for freshly nucleated particles from photochemical processing of upwind aerosol precursors (Zhang et al. 2005; Robinson et al. 2007; Moore et al. 2007; Ning et al. 2007). The PM ratios of UFP/BC, UFP/CO, and UFP/CO2 are 1.9, 2.1, and 1.1 times what they are in the AM, respectively (Table 3). This indicates an extra source of UFP in the afternoons. CO2 also increases in the afternoon, but is less straightforward to use as a reference pollutant because of its large background, which is somewhat variable and difficult to define in urban areas. Boyle Heights is about 24 km from the ocean, allowing for about 2–4 hours of photochemical processing from the time of initial emissions in the coastal areas upwind to arrive in BH in the afternoon, sufficient time for substantial oxidation of aerosol precursors.
Table 3.
Concentration ratios of UFP to other pollutant a
| Ratio | UFP/BC | UFP/CO | UFP/CO2 |
|---|---|---|---|
| AM Ratio b | 8 420 | 69 700 | 65 |
| PM Ratio c | 15 900 | 145 200 | 72 |
| PM Ratio/AM Ratio | 1.9 | 2.1 | 1.1 |
The units of UFP, BC, CO, and CO2 concentrations are count cm−3, µg m−3, ppm, and ppm, respectively.
The average UFP, BC, CO, and CO2 concentrations in the mornings were 32 000 count cm−3, 3.8 µg m−3, 0.46 ppm, and 493 ppm, respectively.
The average UFP, BC, CO, and CO2 concentrations in the afternoons were 35 000 count cm−3, 2.2 µg m−3, 0.24 ppm, and 485 ppm, respectively.
4 Contribution of high emission vehicles
To estimate the contribution of UFP from HEV to the average UFP concentration, we attribute all UFP associated with each (5 s avg.) point above a set threshold (55 000 and 77 000 cm−3 for residential and on-streets, respectively—see Section 4.1 below) to the HEV. A more detailed description of the calculation is provided in the supplementary information. HEV includes high-emitting gasoline vehicles (HEGV; including cars and pickup trucks) and heavy-duty diesel trucks (HDDT; trash trucks, street sweepers, cement trucks and construction and other vehicles). High concentrations of UFP were also frequently observed associated with CNG buses. HEV can generate very high numbers of particles per kg fuel burned, especially during hard acceleration. Encounters with HEVs accelerating directly in front of the MP were characterized by isolated 5 second average UFP spikes over 105 cm−3 and even over 106 cm−3. HEV accelerate frequently due to the short lengths of street blocks (most are 50–150m along the measurement route) in the area, and ubiquitous stop signs and stop lights, an urban design feature that may exacerbate pollutant concentrations and be an underlying factor leading to the relatively uniform spatial distribution of pollutant concentrations in the BH residential areas.
4.1 Fraction of UFPs in BH attributable to HEV
Over the past 20 years many studies have shown that a relatively small fraction of the light-duty motor vehicle fleet (typically 5–10%) have been responsible for a large fraction (as much as 50% or more) of the total fleet emissions of pollutants such as CO, VOC, and NOx (Lawson et al. 1990; Stephens and Cadle 1991; Stedman et. al 1995). To date, however, we are not aware of a similar demonstration for emissions of UFPs, although we emphasize our study did not directly measure tailpipe emissions of UFP.
To estimate the contribution of HEV, we chose 55 000 and 77 000 cm−3 as threshold UFP concentrations values in the residential area and surface street microenvironments of BH, respectively. Concentrations above this level assigned to high-emitting vehicles and were in almost all cases directly attributable to a visually observed vehicle likely to be an HEV.
Arguments can be made for various threshold values, and the estimated contribution to UFP from HEV is sensitive to the choice of threshold value. A simple approach such as the average particle number concentration plus one or two standard deviations yields a threshold value that will increase as the number of high emitters encountered increases. A more robust approach is to remove the high emitters first, and find the standard deviation of the resulting “background” (with HEVs removed). This approach is slightly sensitive to the (arbitrary) choice for the HEV cutoff. For the analysis here, we chose 80 000 cm−3 in the residential areas and 100 000 cm−3 on-road as the HEV cutoffs to remove HEV. The resulting average backgrounds plus two standard deviations of the background result in the threshold concentrations of 55 000 cm−3 and 77 000 cm−3 for the residential and on-road areas, respectively (Figs 4 and 5) we use here.
We emphasize that for the purposes of the following calculations we are employing an empirical definition of high-emitting vehicles. Concentrations observed by the MP will be highly dependent on plume capture and how close the MP was to an emitting vehicle. For a more formal definition of high-emitting vehicles see ARB (2006).
Elevated UFP concentrations are well known to be associated with 1) vehicle cold starts, 2) hard accelerations, 3) vehicles in need of repair, and 4) high-emitting vehicles under many or all modes of operation. Encounters with gasoline vehicles during cold start (generally the 1st minute after an engine is turned on) were limited during our MP measurements in BH. While undiluted exhaust of newer vehicles can have high UFP concentrations during hard accelerations, by the time exhaust has reached our samplers, it is generally diluted by a factor of 1000 or more (Zhang et al. 2004). Thus hard acceleration of clean vehicles also seems unlikely to have contributed significantly to our UFP observations. Indeed, we have observed hundreds of incidences in which we saw little or no change in UFP concentrations when new or newer gasoline vehicles accelerated rapidly directly in front of the MP.
4.2 Residential Areas
For the residential areas in the AM, UFP concentrations above the 55 000 cm−3 threshold were associated with HEV about 5% of the time, but contributed up to 28% of the ultrafine particles measured on the route in BH (Table 4). In the afternoons, UFP concentrations were above the 55 000 cm−3 threshold for a similar fraction of the time, about 5%, but contributed a much smaller fraction, about 13% of the total ultrafine particles (Table 4). The lower contributions of HEV to UFP counts in the afternoons may be due to the significant contribution of secondary aerosol formation in the afternoon, as noted above.
Table 4.
Percentages of time and ultrafine particles from HEV in BH
| Morning | Afternoon | Overall | |
|---|---|---|---|
| In residential neighborhoods: | |||
| Coefficient of Variance (All Data) | 1.8 | 0.56 | 1.3 |
| Coefficient of Variance (HEV removed) | 0.33 | 0.28 | 0.31 |
| Percent of time HEV encountered | 6% | 5% | 5% |
| Percent of total UFPs from HEV | 28% | 13% | 20% |
| On major surface streets: | |||
| Coefficient of Variance (All Data) | 1.8 | 0.99 | 1.4 |
| Coefficient of Variance (HEV removed) | 0.49 | 0.38 | 0.4 |
| Percent of time HEV encountered | 17% | 10% | 12% |
| Percent of total UFPs from HEV | 53% | 27% | 35% |
4.3 Surface Streets
On the major surface streets in the AM, UFP concentrations were above the 77 000 cm−3 threshold due to HEV encounters about 17% of the time, but contributed 53% of the ultrafine particles measured on our route. In the afternoon HEV encounters were much less frequent (10%), but the ratio of HEV encounters to total UFP above the threshold (27%) was almost identical. While new particle formation is sufficient to affect UFP concentrations in the neighborhoods, vehicles and especially HEVs appear control concentrations on roadways in BH.
5. Conclusion
Elevated pollutant concentrations were observed in the residential areas, and on the major surface streets in Boyle Heights, an area bounded by dense freeways and traversed by several heavily travelled surface streets during the spring and summer of 2008. The overall average concentrations of UFP, BC, and NO were about 33 000 cm−3, 2.9 µg m−3, and 35 ppb, respectively, in the residential areas. We attribute the elevated pollutant concentrations in the BH community to high traffic flows on surrounding freeways, the significant incidence of high emission vehicles in this low socioeconomic area, contributions of secondary aerosol formation in the afternoon, and possibly short block lengths and high density of stop signs and lights, requiring frequent accelerations of the vehicle fleet. Additionally, it appears that a relatively small fraction of the vehicles on major surface streets and in the residential areas in Boyle Heights may make a significant contribution to ultrafine particles in this community, suggesting that focusing emission control efforts on a relatively small number of high-emitting vehicles would yield disproportionate benefits for improving air quality in this community.
The pollutant concentrations we observed in BH may have important implications for human exposure for the residents of this area, including the potential utility of our data as inputs to epidemiological studies of UFP impacts on urban populations.
Supplementary Material
Highlights.
-
-
We monitored primary pollutants throughout in a low income Los Angeles neighborhood
-
-
Multiple factors lead to elevated ultrafine particles in residential areas
-
-
High traffic density, many high emitters and ubiquitous stop signs all contribute
-
-
Photochemical production appears to elevate ultrafine particles in the afternoon
Acknowledgements
The authors gratefully acknowledge support for this study by the California Air Resources Board, Contract No. 04-348. The authors wish to express their appreciation to Drs. Jorn Herner, Ying-Kuang Hsu, Michael FitzGibbon and Dane Westerdahl of ARB for their assistance, and Joe Cassmassi and Kelvin Durkee of the SCAQMD and James Murakami of the Department of Atmospheric and Oceanic Sciences for their technical support. We also wish to thank Professor Douglas Houston at UC Irvine and Hwajin Kim and Shahir Masri at UCLA, and two anonymous reviewers for their contributions to the study and/or the manuscript.
Footnotes
Publisher's Disclaimer: This is a PDF file of an unedited manuscript that has been accepted for publication. As a service to our customers we are providing this early version of the manuscript. The manuscript will undergo copyediting, typesetting, and review of the resulting proof before it is published in its final citable form. Please note that during the production process errors may be discovered which could affect the content, and all legal disclaimers that apply to the journal pertain.
Contributor Information
Shishan Hu, Email: shhu@arb.ca.gov.
Suzanne E. Paulson, Email: paulson@atmos.ucla.edu.
Scott Fruin, Email: fruin@usc.edu.
Kathleen Kozawa, Email: kkozawa@arb.ca.gov.
Steve Mara, Email: smara@arb.ca.gov.
Arthur M. Winer, Email: amwiner@ucla.edu.
References
- ARB. 2006 http://www.arb.ca.gov/msprog/avrp/06-29-06VAVRWorkshopPresentation.pdf.
- Baldauf R, Thoma E, Hays M, Shores R, Kinsey J, Gullett B, Kimbrough S, Isakov V, Long T, Snow R, Khlystov A, Weinstein J, Chen F, Seila R, Olson D, Gilmour I, Cho S, Watkins N, Rowley P, Bang J. Traffic and meteorological impacts on near-road air quality: Summary of methods and trends from the Raleigh near-road Study. J. Air and Waste Manag. Assoc. 2008;58:865–878. doi: 10.3155/1047-3289.58.7.865. [DOI] [PubMed] [Google Scholar]
- Brauer M, Lencar C, Tamburic L, Koehoorn M, Demers P, Karr C. A cohort study of traffic-related air pollution on birth outcomes. Environ. Health Perspect. 2008;116(5):680–686. doi: 10.1289/ehp.10952. [DOI] [PMC free article] [PubMed] [Google Scholar]
- Brunekreef B, Janssen NAH, de Hartog J, Harssema H, Knape M, van Vilet P. Air pollution from truck traffic and lung function in children living near motorways. Epidemiol. 1997;8:298–303. doi: 10.1097/00001648-199705000-00012. [DOI] [PubMed] [Google Scholar]
- Bukowiecki N, Dommen J, Prevot ASH, Richter R, Weingartner E, Baltensperger UJ. A mobile pollutant measurement laboratory--Measuring gas phase and aerosol ambient concentrations with high spatial and temporal resolution. Atmos. Environ. 2002;36:5569–5579. [Google Scholar]
- Calder KL. Estimating air-pollution concentrations from a highway in an oblique wind. Atmos. Environ. 1973;7(9):863–868. [Google Scholar]
- Fruin S, Westerdahl D, Sax T, Sioutas C, Fine PM. Measurements and predictors of on-road ultrafine particle concentrations and associated pollutants in Los Angeles. Atmos. Environ. 2008;42:207–219. [Google Scholar]
- Gauderman W, Vora H, McConnell R, Berhane K, Gilliland F, Thomas D, Lurmann F, Avol E, Kunzli N, Jerrett M, Peters J. Effect of exposure to traffic on lung development from 10 to 18 years of age: a cohort study. Lancet. 2007;369:571–577. doi: 10.1016/S0140-6736(07)60037-3. [DOI] [PubMed] [Google Scholar]
- Hart JE, Laden F, Puett RC, Costenbader KH, Karlson EW. Exposure to traffic pollution and increased risk of rheumatoid arthritis. Environ. Health Perspect. 2009;117(7):1065–1069. doi: 10.1289/ehp.0800503. [DOI] [PMC free article] [PubMed] [Google Scholar]
- Hitchins J, Morawska L, Wolff R, Gilbert D. Concentrations of submicrometre particles from vehicle emissions near a major road. Atmos. Environ. 2000;34:51–59. [Google Scholar]
- Hoek G, Brunekreef B, Goldbohm S, Fischer P, van den Brandt PA. Association between mortality and indicators of traffic-related air pollution in the Netherlands: A cohort study. Lancet. 2002;360:203–1209. doi: 10.1016/S0140-6736(02)11280-3. [DOI] [PubMed] [Google Scholar]
- Houston D, J. Wu P, Ong, Winer AM. Structural Disparities of Urban Traffic in Southern California: Implications for Vehicle-Related Air Pollution Exposure in Minority and High-Poverty Neighborhoods. J. Urban Affairs. 2004;26:565–592. [Google Scholar]
- Hu S, Fruin S, Kozawa K, Mara S, Paulson SE, Winer AM. A Wide Area of Air Pollutant Impact Downwind of a Freeway during Pre-Sunrise Hours. Atmos. Environ. 2009;43:2541–2549. doi: 10.1016/j.atmosenv.2009.02.033. [DOI] [PMC free article] [PubMed] [Google Scholar]
- Isakov V, Touma S, Khlystov A. A method of assessing air toxics concentrations in urban areas using mobile platform measurements. J. J. Air Waste Manage. Assoc. 2007;57:1286–1295. doi: 10.3155/1047-3289.57.11.1286. [DOI] [PubMed] [Google Scholar]
- Jacobson MZ, Kittelson DB, Watts WF. Enhanced Coagulation Due to Evaporation and its Effect on Nanoparticle Evolution. EST. 2005;39:9486–9492. doi: 10.1021/es0500299. [DOI] [PubMed] [Google Scholar]
- Kan H, Heiss G, Rose KM, Whitsel E, Lurmann F, London SJ. Traffic Exposure and lung function in adults: the atherosclerosis risk in communities study. Thorax. 2007;62:873–879. doi: 10.1136/thx.2006.073015. [DOI] [PMC free article] [PubMed] [Google Scholar]
- Kittelson DW, Watts W, Johnson J, Remerowki M, Ische E, Oberdorster G, Gelein R, Elder A, Hopke P, Kim E, Zhao W, Zhou L, Jeong C-H. On-road exposure to highway aerosols. 1. Aerosol and gas measurements. Inhalation Tox. 2004;16(S1):31–39. doi: 10.1080/08958370490443024. [DOI] [PubMed] [Google Scholar]
- Knox EG, Gilman EA. Hazard proximities of childhood cancers in Great Britain from 1953-80. Journal of Epidemiology and Community Health. 1997;51:151–159. doi: 10.1136/jech.51.2.151. [DOI] [PMC free article] [PubMed] [Google Scholar]
- Kozawa KH, Fruin SA, Winer AM. Near-Road Air Pollution Impacts of Goods Movement in Communities Adjacent to the Ports of Los Angeles and Long Beach. Atmos. Environ. 2009;43:2960–2970. [Google Scholar]
- Lawson DR, Groblicki PJ, Stedman DH, Bishop GA, Guenter PL. Emissions from in-use motor vehicles in Los Angeles: a pilot study of remote sensing and the inspection and maintenance program. J. J. Air Waste Manage. Assoc. 1990;40:1096–1105. [Google Scholar]
- Lin S, Munsie JP, Hwang S-A, Fitzgerald E, Cayo MR. Childhood asthma hospitalization and residential exposure to state route traffic. Environ. Res. 2002;88:71–81. doi: 10.1006/enrs.2001.4303. [DOI] [PubMed] [Google Scholar]
- Moore KF, Ning Z, Ntziachristos L, Schauer J, Sioutas C. Daily variation in the properties of urban ultrafine aerosol-Part I: Physical characterization and volatility. Atmos. Environ. 2007;41:8633–8646. [Google Scholar]
- Ning Z, Geller MD, Moore KF, Sheesley R, Schauer JJ, Sioutas C. Daily variation in chemical characteristics of urban ultrafine aerosols and inference of their sources. Environ. Sci. Technol. 2007;41:6000–6006. doi: 10.1021/es070653g. [DOI] [PubMed] [Google Scholar]
- Ning Z, Hudda N, Daheer N, Kam W, Herner J, Kozawa K, Mara S, Sioutas C. Impact of roadside noise barriers on particle size distribution and pollutant concentrations near freeways. Atmos. Environ. 2010;44:3118–3127. [Google Scholar]
- Pearson RL, Watchel H, Ebi KL. Distance-weighted traffic density in proximity to a home is a risk factor for leukemia and other childhood cancers. J. Air Waste Manage. Assoc. 2000;50:175–180. doi: 10.1080/10473289.2000.10463998. [DOI] [PubMed] [Google Scholar]
- Robinson AL, Donahue NM, Shrivastava MK, Weitkamp EA, Sage AM, Grieshop AP, Lane TE, Pierce JR, Pandis SN. Rethinking Organic Aerosols: Semivolatile Emissions and Photochemical Aging. Science. 2007;315:1259–1262. doi: 10.1126/science.1133061. [DOI] [PubMed] [Google Scholar]
- Sabin LD, Behrentz E, Winer AM, Lee SJ, Fitz DR, Pankratz DV, Colome SD, Fruin SA. “Characterizing the Range of Children’s Air Pollutant Exposure During School Bus Commutes”. J. Exposure Anal. Environ. Epidemiology. 2005;15:377–387. doi: 10.1038/sj.jea.7500414. [DOI] [PubMed] [Google Scholar]
- Sandstrom T, Brunekreef B. Traffic-related pollution and lung development in children. Lancet. 2007;369:571–577. doi: 10.1016/S0140-6736(07)60038-5. [DOI] [PubMed] [Google Scholar]
- Stedman DH, Bishop GA, Aldrete P, Slott RS. On-road evaluation of an automobile emission test program. Environ. Sci. Technol. 1997;31:927–931. [Google Scholar]
- Stephens P, Cadle SH. Remote sensing of carbon monoxide emissions from road vehicles. J. Air Waste Manage. Assoc. 1991;41:39–43. [Google Scholar]
- Winer AM, Paulson SE, Hu S, Kozawa K, Mara S, Houston D, Fruin S. Investigation and characterization of air pollution concentrations and gradients in port-adjacent communities and west and downtown Los Angeles using a mobile platform. Final report to the California Air Resources Board 04-348. 2010 http://www.arb.ca.gov/research/mobile/hcm/mp_04-348_final_report.pdf.
- Zhang KM, Wexler AS. Evolution of particle number distribution near roadways-Part I: analysis of aerosol dynamics and its implications for engine emission measurement. Atmos. Environ. 2004;38:6643–6653. [Google Scholar]
- Zhang Q, Worsnop DR, Canagaratna MR, Jimenez JL. Hydrocarbon-like and oxygenated organic aerosols in Pittsburgh: insights into sources and processes of organic aerosols. Atmos. Chem. Phys. 2005;5:3289–3311. [Google Scholar]
- Zhang Y, Stedman DH, Bishop GA, Guenther PL, Beaton SP. Worldwide On-Road Vehicle Emission Study by Remote Sensing. Environ. Sci. Technol. 1995;29:2286–2294. doi: 10.1021/es00009a020. [DOI] [PubMed] [Google Scholar]
- Zhu YF, Hinds WC, Kim S, Shen S, Sioutas C. Study of ultrafine particles near a major highway with heavy-duty diesel traffic. Atmos. Environ. 2002b;36:4323–4335. [Google Scholar]
- Zhu YF, Hinds WC. Predicting particle number concentrations near a highway based on vertical concentration profile. Atmos. Environ. 2005;39(8):1557–1566. [Google Scholar]
- Zhu YF, Eiguren-Fernandez A, Hinds WC, Miguel AH. In-Cabin Commuter Exposure to Ultrafine Particles on Los Angeles Freeways. Environ. Sci. Technol. 2007;41(7):2138–2145. doi: 10.1021/es0618797. 2007. [DOI] [PubMed] [Google Scholar]
Associated Data
This section collects any data citations, data availability statements, or supplementary materials included in this article.


