

Abstract
Background
Cytochrome P450 2C19 is responsible for the metabolism of many drugs, including the activation of clopidogrel. The allele CYP2C19*17 is associated with ultra-rapid metabolizer phenotypes by increasing gene transcription. This study tests to what extent CYP2C19*17 enhances CYP2C19 expression in human liver and whether additional regulatory variants contribute to variation in CYP2C19 expression.
Methods
CYP2C19 mRNA was measured with quantitative real-time PCR (qRT-PCR), enzyme activity as metabolic velocity with S-mephenytoin as the substrate and allelic mRNA expression ratio with SNaPshot in human livers. CYP2C19 transcribed exons and a 4kb promoter region were sequenced using IonTorrent PGM or Sanger sequencing and screened for polymorphisms associated with total hepatic CYP2C19 mRNA, enzyme activity and allelic mRNA ratios.
Results
Livers heterozygote and homozygous for CYP2C19*17 had mRNA levels 1.8-fold (p=0.028) and 2.9- fold (p=0.006), respectively, above homozygous reference allele livers. CYP2C19*17 heterozygotes were also associated with increased allelic mRNA expression (allelic ratio ~1.8-fold, SD±0.6, p<0.005), whereas CYP2C19 enzyme activity was elevated 2.3-fold, with borderline significance (p=0.06) in CYP2C19*17 carriers. One liver sample of African ancestry displayed a 2-fold allelic expression ratio, and another sample, a ~12-fold increase in metabolic velocity. Neither case was accounted for by *17, which indicates the presence of additional regulatory variants.
Conclusions
Our findings confirm *17 as a regulatory polymorphism enhancing hepatic CYP2C19 expression 2-fold with potential to compensate for the loss of function allele CYP2C19*2. Additional regulatory factors may also enhance CYP2C19 expression in African American populations.
Keywords: CYP2C19, clopidogrel, allelic expression imbalance, polymorphism, biomarker, cytochrome P450
Introduction
CYP2C19 is a member of the cytochrome P450 enzyme family. Hepatic CYP enzymes are main contributors to the metabolism of many endogenous and exogenous compounds [1]. The CYP2C19 isoform metabolizes 8%–10% of prescribed drugs, including clopidogrel, omeprazole and citalopram [2–4]. CYP2C19 consists of nine coding exons spanning 90,209 bases with a coding region of 1473 bases (Figure 1). Similar to other CYP genes, CYP2C19 carries genetic variants with strong effects on substrate metabolism [5]. Two frequent alleles lacking metabolic ability in vivo and in vitro are CYP2C19*2 (rs4244285, cryptic splice site) and CYP2C19*3 (rs4986893, premature stop codon), causing intermediate (heterozygous) or poor metabolizer phenotypes (homozygous) [6, 7]. Minor allele frequencies vary by race, with CYP2C19*2 frequent in Caucasian and African populations, whereas *3 is common in Asians and Africans (Table 1A) [9].
Figure 1.
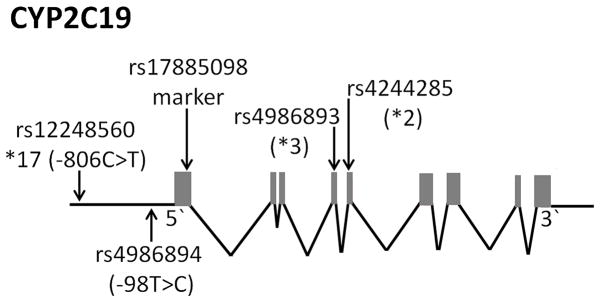
Schematic of CYP2C19 gene locus and relevant SNPs. Gray boxes indicate coding exons.
Table 1. Minor allele frequencies of common CYP2C19 biomarkers (A) and associated metabolic phenotypes defined by Clinical Pharmacogenetics Implementation Consortium guidelines for individuals receiving clopidogrel (19) (B).
Frequencies are based on the 1000 genomes project at http://browser.1000genomes.org or HapMap http://hapmap.ncbi.nlm.nih.gov/
| A. | |||
|---|---|---|---|
| SNP | Minor allele frequency | ||
| Caucasian | African | Asian | |
| CYP2C19*2 | 0.133 | 0.169 | 0.308 |
| CYP2C19*3 | 0.00 | 0.021 | 0.058 |
| CYP2C19*17 | 0.208 | 0.271 | <0.02 |
| B. | ||||
|---|---|---|---|---|
| CYP2C19*1 | CYP2C19*2 | CYP2C19*3 | CYP2C19*17 | |
| CYP2C19*1 |
*1/*1(wt) (Extensive Metabolizer |
*1/*2 Intermediate Metabolizer |
*1/*3 Intermediate Metabolizer |
*1/*17 Ultra-Rapid Metabolizer |
| CYP2C19*2 |
*2/*2 Poor Metabolizer |
*2/*3 Poor metabolizer |
*2/*17 Unknown Metabolizer |
|
| CYP2C19*3 |
*3/*3 Poor Metabolizer |
*2/*17 Unknown Metabolizer |
||
| CYP2C19*17 |
*17/*17 Ultra-Rapid Metabolizer |
|||
The anti-platelet prodrug clopidogrel (Plavix) requires enzymatic activation mediated mainly through CYP2C19 [2]. Clinical evidence indicates that *2 and *3 carriers fail to benefit fully from clopidogrel therapy, thereby increasing the risk for reoccurring cardiac events such as myocardial infarction, stroke and stent thrombosis [10–13]. With an FDA-issued black box warning regarding clopidogrel treatment of CYP2C19*2/*3 carriers [14], CYP2C19*2 and *3 have emerged as clinical biomarkers to predict the metabolizer status of CYP2C19 (Table 1B).
Not yet commonly represented in CYP2C19 allele biomarker panels, the gain of function allele CYP2C19*17 has been reported to increase transcription, resulting in ultra-rapid metabolism of CYP2C19 substrates [15]. Clinical association studies have shown CYP2C19*17 increases clopidogrel efficacy in reducing reoccurring cardiac events, risk of stent thrombosis and residual platelet aggregation, while enhancing the risk of a major bleeding event [16–19]. The Clinical Pharmacogenetics Implementation Consortium, which intends to define how genetic biomarkers should be used clinically, has classified CYP2C19*17 carriers as ultra-rapid metabolizers in the context of clopidogrel treatment (Table 1B) [8]. However, this classification may not stand for other CYP2C19 substrates. The effect of CYP2C19*17 has been measured for several drugs, including omeprazole, amitriptyline, voriconazole, mephenytoin, pantoprazole and escitalopram [4, 15, 20–25]. In many cases, CYP2C19*17 does increase enzyme activity, but when comparing the effect on multiple drugs, CYP2C19*17 is not always a clinically relevant contributor to drug metabolism. Alternate routes of clearance between drugs may be responsible for some of these discrepancies, but this does draw into question the use of the ultra-rapid metabolizer classification outside of clopidogrel treatment. Recent meta-analyses have questioned the role of CYP2C19*17 (and to some extent *2) as a biomarker [26–28], and others propose that CYP2C19*17 homozygotes should be considered extensive metabolizers, rather than ultra-rapid [29].
Whereas the impact of *2 and *3 alleles on CYP2C19 function is well documented, the regulation of gene expression by *17 and possibly other polymorphisms is less well established. In human liver, CYP2C19*17 carriers have not been shown to have significantly different gene expression from non-carriers, which fails to support the ultra-rapid metabolizer classification of CYP2C19*17 carriers. However, evidence supporting a gain-of-function for *17 includes electrophoretic mobility shift assays showing enhanced binding of the CYP2C19*17 allele (-806T) to nuclear receptor cellular fractions and increased luciferase reporter gene activity in mice [15]. Another study in transfected cells failed to show that CYP2C19*17 is active, instead implicating variants such as rs4986894, part of a haplotype including two other promoter single-nucleotide polymorphisms (SNPs), with increased expression. In the case of rs4986894, high linkage disequilibrium (LD) with *2 (D′=1.00, r2=1.00, 1000 Genomes Project), denoted as CYP2C19*2C or *21, renders this variant of little clinical consequence [30, 31].
Absent from these analyses is an accurate measure of the effect size of CYP2C19*17 and its interindividual variability on CYP2C19 expression in human liver, which is crucial information if *17 were to be used as a predictor of ultra-rapid metabolizer status for a wide range of CYP2C19 substrates. A further confounding factor is the estimated low linkage disequilibrium of *17 with *2 (D′=1.0, r2 =0.04, 1000 Genomes Project) [32]. A high D′, low r2 and different allele frequencies indicate that *17 resides mainly on the opposite allele compared to *2 (namely, on the wild- type *1 allele). Therefore, the enhanced transcriptional activity of *17 is not annulled by residing on the inactive *2 allele in compound heterozygotes, although the latter case cannot be excluded in some subjects.
In this study, we determined whether CYP2C19*17 enhances CYP2C19 expression in target tissues (liver) and to what extent. We further asked whether additional promoter polymorphisms are contributing to variability in CYP2C19 expression and re-examined the relationships between *17 and *2 by measuring CYP2C19 total mRNA expression and enzyme activity in human livers. In addition, we apply allelic mRNA expression analysis, a more accurate and precise measure of the effect of cis-acting regulatory variants on mRNA levels. When determined in livers, heterozygous for a marker SNP in the mRNA, a significant deviation of allelic mRNA ratios from the gDNA ratios indicates the presence of allelic expression imbalance (AEI), a measure of cis-acting regulatory polymorphisms [33]. Whereas the scarcity of frequent exonic CYP2C19 marker SNPs limits the scope of AEI analysis, we show that CYP2C19*17 accounts for 2-fold enhanced allelic mRNA expression, with some degree of interindividual variability. Further results in individual liver tissues indicate the presence of a candidate regulatory variant in a sample of African descent. Finally, we show that CYP2C19*17 may compensate for the presence of loss of function alleles such as *2 in compound heterozygous samples, but this requires further confirmation in a larger number of subjects.
Materials and methods
Tissue samples
A total of 125 biopsy or autopsy human liver samples were obtained from the Cooperative Human Tissue Network (Midwest and Western Division) under approval of the Ohio State Institutional Review Board. Fifty liver samples were obtained from other sources that included the Medical College of Wisconsin (Milwaukee, WI, USA), Medical College of Virginia (Richmond, VA, USA), Indiana University School of Medicine (Indianapolis, IN, USA) or University of Pittsburgh (Pittsburgh, PA, USA). These livers were under protocols approved by the appropriate committees for the conduct of human research. Samples were primarily from Caucasians, with ~15% of African descent. Liver microsomes were prepared by differential centrifugation using standard procedures [34] and characterized for protein content by the Lowry method [35].
DNA and RNA isolation and genotyping
Genomic DNA and RNA were prepared from liver tissue samples as previously described [36]. DNase I was used for RNA isolation to prevent contamination of genomic DNA in cDNA synthesis. cDNA was prepared using RNA and Reverse Transcriptase SSIII (Invitrogen, San Francisco, CA, USA), with controls lacking reverse transcriptase to test for residual gDNA. SNPs in CYP2C19 were genotyped in liver samples using a primer extension assay (SNaPshot, Life Technologies) or fluorescently labeled PCR-restriction fragment length polymorphism (RFLP) analysis as previously described [37, 38]. PCR conditions and primers for all PCR assays (including genotyping) are given in Supplemental Table 1. For quality control, the Hardy-Weinberg equilibrium was assessed for each SNP, and allele frequencies were compared to existing population genotype data (Supplemental Table 2).
Measurements of gDNA and mRNA allelic ratios using a primer extension assay (SNaPshot)
The protocol for SNaPshot has been previously described [36, 38], using PCR amplification surrounding a marker SNP in an exonic region, from a heterozygous sample. The SNaPshot read-out peaks on an ABI3730 sequencer (Life Technologies) provide the relative amounts of each allele. The average of allelic ratios of gDNA is used to normalize allelic mRNA ratios in each tissue. A finding of significant mRNA AEI in each tissue was established with a cutoff of three standard deviations from the mean of the genomic DNA allele ratios calculated from all tissues assayed. For the marker SNP in CYP2C19, normalized allelic mRNA ratios, measured at rs17885098 (T > C) in exon 1, > 1.26-fold in either direction (> 1 or < 1) were considered an indication of AEI. All SNaPshot measurements were completed in duplicate for gDNA and at minimum triplicate for mRNA. To achieve sufficient accuracy, CYP2C19 mRNA expression needed to be robust (Ct of < 26 measured via qRT-PCR) for a liver to be considered for AEI analysis. Only nine livers were heterozygous for SNP rs17885098 and passed quality control for AEI analysis. PCR conditions and primers are given in Supplemental Table 1.
SNP scanning and sequencing of CYP2C19
The CYP2C19 promoter region (4kb) and exons were sequenced to scan for regulatory variants (for PCR conditions and primer sequences, see Supplemental Table 1; some primer sets were adapted from Blaisdell et al. [39]). PCR products were quantitated by QUBIT Broad Range DNA spectroscopy (Invitrogen). Fragments were mixed in equimolar ratios to generate libraries that were analyzed by an IonTorrent PGM (Life Technologies) and barcoded for multiple samples per sequencing run. A total of four runs were performed on 15 samples. Sequences were analyzed in CLC Bio’s Genomics Workbench (CLC Bio, Katrinebjerg, Denmark). SNP calling required, at minimum, 20 reads at a given base with 30% reads per allele. SNP calls with depth and allele ratio information is included in Supplemental Table 3. Select regions and samples were also sequenced using Sanger sequencing at OSU’s sequencing facility.
Analysis of mRNA levels with quantitative real-time PCR
mRNA levels of CYP2C19 and transcription factors PXR, RXRα, HNF4α, CAR and GATA4 were measured in human liver samples using quantitative real-time PCR (qRT-PCR) (in duplicate) on a 7500 Fast Real Time PCR System (Applied Biosystems, Carlsbad, CA, USA). GAPDH served as a housekeeping gene yielding expression representative of overall RNA quality in human liver with low interindividual variability (for primers, see Supplemental Table 1) [40]. Standard curves were made using serial dilutions of cDNA for each gene and used for mRNA quantification.
Measurement of CYP2C19 activity in human liver microsomes
CYP2C19 enzyme activity was measured in 40 liver microsomes using S-mephenytoin as the substrate as described [41]. The formation of 4′-hydroxymephenytoin (nmol/min/mg) at a single substrate concentration (≤Km), represented by metabolic velocity (V), was used to measure the metabolic activity of CYP2C19. The data represent duplicate assays, transformed into log scale for analysis by linear regression and independent t-test.
Data analysis
Linkage disequilibrium (LD) and the Hardy-Weinberg equilibrium (Supplemental Table 2) were analyzed using Helix-Tree SNP and Variation Suite (Golden Helix, Bozeman, MT, USA). Significant differences in allelic mRNA ratios from mean allelic gDNA ratios (presence of AEI) were confirmed by t-test. Linear regression was used to test the effects of SNPs and transcription factor expression on CYP2C19 mRNA expression and protein activity using SPSS and Minitab, respectively. p-Values <0.05 were considered significant for all associations.
Results
CYP2C19*17 is associated with increased CYP2C19 total mRNA expression
Total mRNA expression for CYP2C19 was measured by qRT-PCR in 83 liver samples. On average, CYP2C19*17 heterozygotes showed a 1.8-fold increase in mRNA expression (p=0.028, 95% CI 1.08-fold to 3.00-fold, t-test) over the tissue of *17 non-carriers. CYP2C19*17 homozygotes showed 2.9-fold increased expression (p=0.006, 95% CI 1.5- fold to 5.8-fold, t-test, equal variances not assumed) with large variability (Figure 2). Known regulators of CYP2C19 expression (transcription factors) including the pregnane X receptor (PXR), constitutive androgen receptor (CAR) and GATA4 [42, 43] were measured by qRT-PCR to determine whether they significantly contribute to CYP2C19 expression. HNF4α and RXRα, additional factors that do not directly interact with the CYP2C19 promoter but may affect expression of other CYP2C19 regulators were also included. CYP2C19 expression was positively correlated with the expression of GATA4 and negatively with CAR and RXRα mRNA (p<0.05). After adjusting for the expression of GATA4, CAR and RXRα, CYP2C19*17 carriers remain significantly associated with increased expression of CYP2C19 mRNA (1.6-fold, p=0.014).
Figure 2. Association between CYP2C19*17 genotype and total CYP2C19 expression.

CYP2C19*17 heterozygotes and homozygous were associated with 1.8-fold (p=0.028) and 2.9-fold (p=0.006) increases in CYP2C19 mRNA, respectively. Data are presented as a box plot and whisker plot (box shows median with the 25th and 75th percentiles), and minimum and maximum values are shown by whiskers. Outliers that do not fall within the bounds of the plot and that are greater than three box-heights are indicated with ○ and *, respectively
CYP2C19*17 is associated with increased allelic expression of CYP2C19 in human liver tissues
We measured CYP2C19 allelic RNA expression to determine whether and to what extent CYP2C19*17 increases transcription and whether any additional functional polymorphisms are present. Allelic expression was measured using SNP rs17885098, located in the first exon of CYP2C19 as a marker (minor allele frequency=0.083, 1000 Genomes Project). Lack of frequent marker SNPs in CYP2C19 exons limited the number of livers accessible for allelic RNA expression analysis. Of 175 livers, we identified nine heterozygotes that passed the quality controls outlined in Methods. Of these nine samples, seven were Caucasian and two were of African ancestry (LL34, L123). Five samples showed significant allelic expression imbalance (AEI) using criteria described in Methods (Figure 3, AEI >1.26-fold).
Figure 3. Allelic RNA expression imbalance of CYP2C19 at marker SNP rs17885098 (T>C) in nine individual livers.

The allelic RNA ratio is expressed as a ratio of C/T averaged from a minimum of three measurements. Three standard deviations of the genomic DNA control (>1.26-fold AEI) indicate a biologically significant allelic expression imbalance (indicated by arrows), showing significant difference from the gDNA control at p<0.005. L123 is the only sample showing AEI and not carrying*17. Data are mean±SD.
To test the association of AEI with CYP2C19*17, we genotyped CYP2C19*17 and other known functional SNPs CYP2C19*2 and CYP2C19*3 and promoter SNP rs4986894 [30]. Functional SNPs must be heterozygous in all samples showing AEI and absent or homozygous in all samples not showing AEI. Four samples lacking AEI were also lacking CYP2C19*17. Of the five with AEI, all were *17 heterozygotes except one (L123), which is one of two samples of African descent. Significant allelic mRNA ratios (AEI-positive) within the CYP2C19*17 carriers ranged from 1.4- to 2.8-fold, with an average of 1.8-fold (SD±0.68-fold) (Figure 3). These results support the hypothesis that CYP2C19*17 is functional, increasing RNA expression ~2-fold and also indicates additional regulatory polymorphisms may be present in African Americans. Sample L123 did not contain the functional SNPs for *2 and *3 haplotypes. To identify any additional polymorphisms causing AEI in L123, CYP2C19 coding exons and 4 kb upstream of the first exon (promoter) were sequenced using the Ion Torrent PGM. Four additional livers were also sequenced for comparison: L114 (*1/*2, no AEI), LL16 and LL19 (*1/*17, with AEI), and L90, an additional African liver (no AEI data). CYP2C19*17 was the only allele uniquely associated with AEI in LL16 and LL19, which is consistent with CYP2C19*17 causing increased gene expression (Supplemental Table 3). Comparing sequencing results of L123 with genotypes of LL34 (an AEI – sample from African descent) as control, we found a possible haplotype of multiple SNPs as being causative (rs11568730 and others, Supplemental Table 3); however, additional studies will be needed to establish the function of these regulatory variants. These observations indicate that there are additional polymorphisms that may affect the transcription of CYP2C19 in African American populations.
CYP2C19*17 association with CYP2C19 enzyme activity
To confirm the function of CYP2C19*17, we tested whether *17 was associated with enzyme activity. CYP2C19 enzyme activity (V) was measured in 40 human liver microsomes using S-mephenytoin as substrate. To determine the gene dosage effect of CYP2C19*17 on enzyme activity, we compared CYP2C19 enzyme activity between diplotypes using a t-test (Figure 4). In *1/*2 carriers (intermediate metabolizers, n =9), the mean activity was 2.3-fold lower (V=0.0091 nmol/min/mg, SD±0.0086) than the average of wild-type samples (V=0.021 nmol/min/mg, SD±0.022,*1/*1, extensive metabolizers, n=11) (p=0.07, Figure 4). Although not significant at p=0.05, this relationship is consistent with current expectations of genotype/phenotype associations. The average activity for *2/*17 (V=0.025 nmol/min/mg, SD±0.018, n=6) carriers did not significantly differ from wild-type samples, with a 2.7-fold increase in the average activity over *1/*2 carriers (V=0.0091 nmol/min/mg, SD±0.0086, n=9) (p=0.075, Figure 4). Comparing the average enzyme activity between CYP2C19*17 carriers (both heterozygote and homozygote) and non-carriers showed no significant difference. The comparison showed a borderline significant (p=0.06) 2.3-fold increase in carriers over non-carriers of CYP2C19*17. This result suggests that *17, which increases allelic expression 2-fold may compensate for the CYP2C19*2 nonfunctional allele in individuals heterozygous for both *17 and *2, which implies that *2 and *17 are likely to be on different alleles, consistent with an inverse LD between *17 and *2 (Supplemental Figure 1). Comparisons between CYP2C19*1/*1 and CYP2C19*17 heterozygotes or homozygotes show these groups are not significantly different (p=0.47 and p=0.512, respectively). However, the small sample size limits generalizations that could be drawn from this analysis. Larger studies are required to fully address *2/*17 genotype-phenotype associations.
Figure 4. Association between CYP2C19*17 and CYP2C19 enzyme activity by CYP2C19 diplotype.
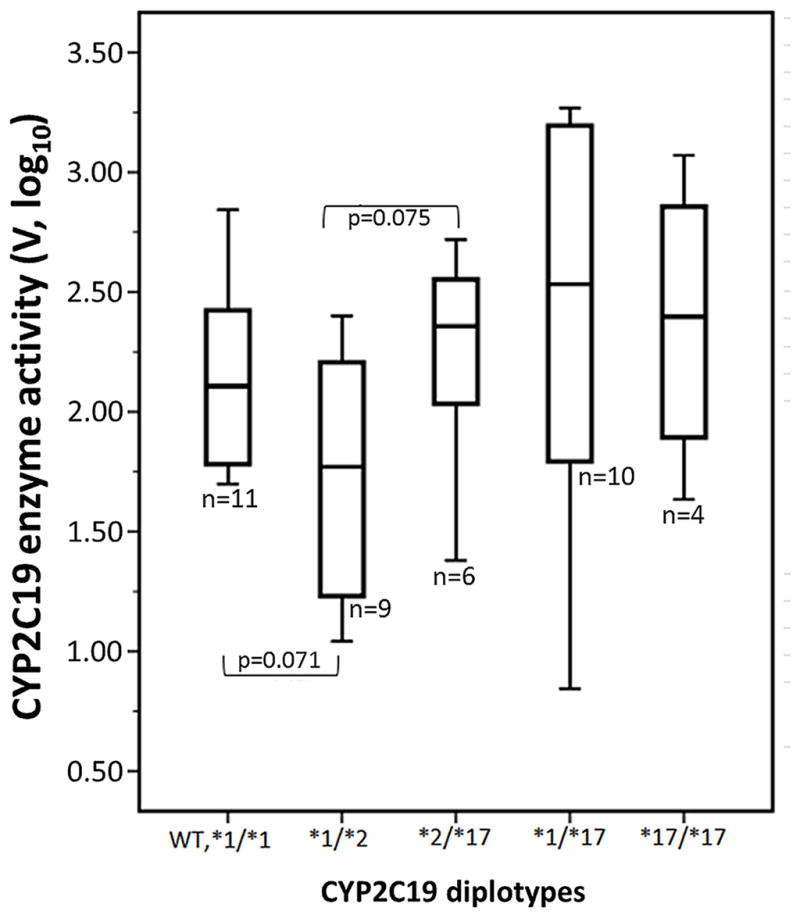
CYP2C19 enzyme activity was measured by conversion of S-mephenytoin to 4-hydroxymephenytoin in human liver microsomes. Data are presented as a box plot and whisker plot (box shows median with the 25th and 75th percentiles), and minimum and maximum values are shown by whiskers. Outliers that do not fall within the bounds of the plot and that are greater than three box-heights are indicated with ○ and *, respectively.
One liver (LL44, *2/*17) displayed extremely high enzyme activity, exhibiting a velocity of 0.41 nmol/min/mg, more than 12-fold higher than the average level in our cohort. We hypothesized that LL44 would contain a rare variant responsible for the high activity. To test this, we sequenced promoter (4 kb) and coding regions of sample LL44 and nine control samples using Ion Torrent PGM. Sequencing confirmed the presence of both *2 and *17 alleles in LL44. Information on the SNPs called, read depth and allele frequency can be found in Supplemental Table 3. Sample LL44 showed 14 polymorphisms in the regions sequenced. Compared to nine control samples, no SNPs were unique to LL44 that could explain high enzyme activity, which indicates non-genetic factors or SNPs located in proximal regulatory regions may be responsible. A larger cohort of well-phenotyped liver tissues will be needed to investigate variants associated with extremely high CYP2C19 enzyme activity.
Discussion
The results of this study show that CYP2C19*17 is associated with a 2-fold increase in mRNA expression in human liver. Sequencing and SNP scanning further support the conclusion that CYP2C19*17 is a functional SNP causing enhanced CYP2C19 transcription. However, the presence of an additional regulatory variant was indicated by an allelic mRNA expression imbalance in a liver from a sample of African descent. Further regulatory variants may exist, as indicated by exceptionally high CYP2C19 metabolic activity not accounted for by *17 alone in a Caucasian liver. Although the regulation of CYP enzyme expression is complex, use of allelic mRNA expression analysis in human liver tissues proved a valuable tool for assessing the effect size of CYP2C19*17 in target tissues, prompting the continued search for additional regulatory variants. Because of the absence of frequent marker SNPs for AEI analysis, large collections of liver tissues will be needed to complete this analysis.
Individual CYP mRNA expression and drug metabolizing ability are highly variable [44]. Our initial analysis of the association between *17 and total CYP2C19 mRNA revealed a significant 2-fold increase for *17 heterozygotes and a 3-fold increase for *17 homozygotes. To account for confounding effects of a transacting source in CYP2C19 expression, we also measured the expression of five transcription factors. A positive correlation of CYP2C19 mRNA expression with GATA4 mRNA and negative correlations with CAR and RXRα confirm trans-regulation by diverse processes. After controlling for the expression of these transcription factors, CYP2C19*17 carriers remained significantly associated with a 1.6-fold increase in CYP2C19 mRNA expression, which indicates that CYP2C19*17 increases mRNA transcription independent of these transcription factors. CYP2C19 allelic RNA expression and enzyme activity results further support CYP2C19*17 as a gain-of-function allele. It is possible that there is an interaction between the expression of transcription factors and *17, accounting for the lower estimated effect size when transcription factor expression is taken into account, but the sample size was too small to test this hypothesis further.
Our finding that CYP2C19*17 results in a 2-fold increase in CYP2C19 expression should be considered in the context of clinical CYP2C19 biomarker tests. Currently, the primary utility of CYP2C19*17 is in the context of monitoring treatment and managing risk (clopidogrel treatment). Any variation of CYP2C19*17 effect size between individuals poses a challenge if *17 is to be used as a biomarker. Shown here, the 2-fold variation in expression (in human liver) with allelic mRNA ratios of 1.4- to 2.8-fold is within a sufficiently narrow range for predicting metabolizer status. To fully define the effect size of *17, more samples are needed to quantitate differences in expression. In addition, large scale genotyping and metabolic phenotyping can be used to ascertain that *17 and *2 are indeed on different alleles in the majority of samples, to support the hypothesis that *2/*17 compound-heterozygote metabolizer status is equivalent to a *1/*1 extensive metabolizer. For certain CYP2C19 substrates, where ultra- rapid metabolizer status prediction by CYP2C19*17 is questionable, alternate phenotype/genotype tables may be required. Further, we show that CYP2C19*17 does not explain all instances of AEI or increased enzyme activity, requiring a continued search for regulatory variants affecting CYP2C19. These additional marker SNPs will be needed to assure adequate prediction of the CYP2C19 metabolic phenotype in any single individual.
In conclusion, we have shown that CYP2C19*17 increases CYP2C19 expression approximately 2-fold in human liver. The defined effect size measured here supports the notion that CYP2C19*17 can serve as a biomarker, refining treatment decisions based on genotype, and solidifies clinical use in the context of risk management for bleeding events during clopidogrel treatment regimens. Further, in two samples with evidence of enhanced transcription or increased enzyme activity, respectively, the CYP2C19*17 allele cannot account for this finding or CYP2C19*17 alone is insufficient. Therefore, additional regulatory polymorphisms could also alter a patient’s response to drug therapy and requires further study.
Supplementary Material
Acknowledgments
This study was supported by a grant from the National Institutes of Health, General Medical Sciences, U01 GM092655.
Abbreviations
- CYP2C19
Cytochrome P450 2C19
- Ion Torrent PGM
Ion Torrent Personal Genome Machine
- AEI
allelic expression imbalance
- LD
linkage disequilibrium
- TF(s)
transcription factors
- PXR
pregnane X receptor
- CAR
constitutive androgen receptor
- RXRα
retinoic acid X receptor alpha
- HNF4α
hepatocyte nuclear factor 4 alpha
- GATA4
GATA binding protein 4
Footnotes
Conflict of interest statement
Authors’ conflict of interest disclosure: The authors stated that there are no conflicts of interest regarding the publication of this article.
Research funding: National Institutes of Health, General Medical Sciences, U01 GM092655.
Employment or leadership: None declared.
Honorarium: None declared.
References
- 1.Guengerich FP. Cytochrome p450 and chemical toxicology. ChemRes Toxicol. 2008;21:70–83. doi: 10.1021/tx700079z. [DOI] [PubMed] [Google Scholar]
- 2.Kazui M, Nishiya Y, Ishizuka T, Hagihara K, Farid NA, Okazaki O, et al. Identification of the human cytochrome P450 enzymes involved in the two oxidative steps in the bioactivation of clopidogrel to its pharmacologically active metabolite. Drug Metab Dispos. 2010;38:92–9. doi: 10.1124/dmd.109.029132. [DOI] [PubMed] [Google Scholar]
- 3.Karam WG, Goldstein JA, Lasker JM, Ghanayem BI. Human CYP2C19 is a major omeprazole 5-hydroxylase, as demonstrated with recombinant cytochrome P450 enzymes. Drug Metab Dispos. 1996;24:1081–7. [PubMed] [Google Scholar]
- 4.Ohlsson Rosenborg S, Mwinyi J, Andersson M, Baldwin RM, Pedersen RS, Sim SC, et al. Kinetics of omeprazole and escitalopram in relation to the CYP2C19*17 allele in healthy subjects. Eur J Clin Pharmacol. 2008;64:1175–9. doi: 10.1007/s00228-008-0529-z. [DOI] [PubMed] [Google Scholar]
- 5.The Human Cytochrome P450 (CYP) Allele Nomenclature Committee. The Human Cytochrome P450 (CYP) Allele Nomenclature Database. [Accessed 10/15/2012];CYP2C19 allele nomenclature. Available at: http://www.cypalleles.ki.se/cyp2c19.htm.
- 6.de Morais SM, Wilkinson GR, Blaisdell J, Meyer UA, Nakamura K, Goldstein JA. Identification of a new genetic defect responsible for the polymorphism of (S)-mephenytoin metabolism in Japanese. Mol Pharmacol. 1994;46:594–8. [PubMed] [Google Scholar]
- 7.de Morais SM, Wilkinson GR, Blaisdell J, Nakamura K, Meyer UA, Goldstein JA. The major genetic defect responsible for the polymorphism of S-mephenytoin metabolism in humans. J Biol Chem. 1994;269:15419–22. [PubMed] [Google Scholar]
- 8.Scott SA, Sangkuhl K, Gardner EE, Stein CM, Hulot JS, Johnson JA, et al. Clinical Pharmacogenetics Implementation Consortium guidelines for cytochrome P450-2C19 (CYP2C19) genotype and clopidogrel therapy. Clin Pharmacol Ther. 2011;90:328–32. doi: 10.1038/clpt.2011.132. [DOI] [PMC free article] [PubMed] [Google Scholar]
- 9.The 1000 Genomes Project. [Accessed 10/15/2012];1000 Genomes Browser. Available at: http://browser.1000genomes.org.
- 10.Mega JL, Close SL, Wiviott SD, Shen L, Hockett RD, Brandt JT, et al. Cytochrome p-450 polymorphisms and response to clopidogrel. N Engl J Med. 2009;360:354–62. doi: 10.1056/NEJMoa0809171. [DOI] [PubMed] [Google Scholar]
- 11.Shuldiner AR, O’Connell JR, Bliden KP, Gandhi A, Ryan K, Horenstein RB, et al. Association of cytochrome P450 2C19 genotype with the antiplatelet effect and clinical efficacy of clopidogrel therapy. J Am Med Assoc. 2009;302:849–57. doi: 10.1001/jama.2009.1232. [DOI] [PMC free article] [PubMed] [Google Scholar]
- 12.Mega JL, Simon T, Collet JP, Anderson JL, Antman EM, Bliden K, et al. Reduced-function CYP2C19 genotype and risk of adverse clinical outcomes among patients treated with clopidogrel predominantly for PCI: a meta-analysis. J Am Med Assoc. 2010;304:1821–30. doi: 10.1001/jama.2010.1543. [DOI] [PMC free article] [PubMed] [Google Scholar]
- 13.Hwang SJ, Jeong YH, Kim IS, Koh JS, Kang MK, Park Y, et al. The cytochrome 2C19*2 and *3 alleles attenuate response to clopidogrel similarly in East Asian patients undergoing elective percutaneous coronary intervention. Thromb Res. 2011;127:23–8. doi: 10.1016/j.thromres.2010.10.021. [DOI] [PubMed] [Google Scholar]
- 14.U.S Food and Drug Administration. [Accessed 9/17/2012];Information on clopidogrel bisulfate (marketed as Plavix) Available at: http://www.fda.gov/Drugs/DrugSafety/PostmarketDrugSafetyInformationforPatientsandProviders/ucm190836.htm.
- 15.Sim SC, Risinger C, Dahl ML, Aklillu E, Christensen M, Bertilsson L, et al. A common novel CYP2C19 gene variant causes ultrarapid drug metabolism relevant for the drug response to proton pump inhibitors and antidepressants. Clin Pharmacol Ther. 2006;79:103–13. doi: 10.1016/j.clpt.2005.10.002. [DOI] [PubMed] [Google Scholar]
- 16.Tiroch KA, Sibbing D, Koch W, Roosen-Runge T, Mehilli J, Schomig A, et al. Protective effect of the CYP2C19*17 polymorphism with increased activation of clopidogrel on cardiovascular events. Am Heart J. 2010;160:506–12. doi: 10.1016/j.ahj.2010.06.039. [DOI] [PubMed] [Google Scholar]
- 17.Sibbing D, Koch W, Gebhard D, Schuster T, Braun S, Stegherr J, et al. Cytochrome 2C19*17 allelic variant, platelet aggregation, bleeding events, and stent thrombosis in clopidogrel-treated patients with coronary stent placement. Circulation. 2010;121:512–8. doi: 10.1161/CIRCULATIONAHA.109.885194. [DOI] [PubMed] [Google Scholar]
- 18.Pare G, Mehta SR, Yusuf S, Anand SS, Connolly SJ, Hirsh J, et al. Effects of CYP2C19 genotype on outcomes of clopidogrel treatment. N Engl J Med. 2010;363:1704–14. doi: 10.1056/NEJMoa1008410. [DOI] [PubMed] [Google Scholar]
- 19.Sibbing D, Gebhard D, Koch W, Braun S, Stegherr J, Morath T, et al. Isolated and interactive impact of common CYP2C19 genetic variants on the antiplatelet effect of chronic clopidogrel therapy. J Thromb Haemost. 2010;8:1685–93. doi: 10.1111/j.1538-7836.2010.03921.x. [DOI] [PubMed] [Google Scholar]
- 20.Baldwin RM, Ohlsson S, Pedersen RS, Mwinyi J, Ingelman-Sundberg M, Eliasson E, et al. Increased omeprazole metabolism in carriers of the CYP2C19*17 allele; a pharmaco- kinetic study in healthy volunteers. Br J Clin Pharmaco. 2008;65:767–74. doi: 10.1111/j.1365-2125.2008.03104.x. [DOI] [PMC free article] [PubMed] [Google Scholar]
- 21.Dolton MJ, McLachlan AJ. Clinical importance of the CYP2C19*17 variant allele for voriconazole. Br J Clin Pharmaco. 2011;71:137–8. doi: 10.1111/j.1365-2125.2010.03801.x. [DOI] [PMC free article] [PubMed] [Google Scholar]
- 22.de Vos A, van der Weide J, Loovers HM. Association between CYP2C19*17 and metabolism of amitriptyline, citalopram and clomipramine in Dutch hospitalized patients. Pharmacogenomics J. 2011;11:359–67. doi: 10.1038/tpj.2010.39. [DOI] [PubMed] [Google Scholar]
- 23.Wang G, Lei HP, Li Z, Tan ZR, Guo D, Fan L, et al. The CYP2C19 ultra-rapid metabolizer genotype influences the pharmaco- kinetics of voriconazole in healthy male volunteers. Eur J Clin Pharmacol. 2009;65:281–5. doi: 10.1007/s00228-008-0574-7. [DOI] [PubMed] [Google Scholar]
- 24.Goldstein JA, Faletto MB, Romkes-Sparks M, Sullivan T, Kitareewan S, Raucy JL, et al. Evidence that CYP2C19 is the major (S)-mephenytoin 4′-hydroxylase in humans. Biochemistry. 1994;33:1743–52. doi: 10.1021/bi00173a017. [DOI] [PubMed] [Google Scholar]
- 25.Gawronska-Szklarz B, Adamiak-Giera U, Wyska E, Kurzawski M, Gornik W, Kaldonska M, et al. CYP2C19 polymorphism affects single-dose pharmacokinetics of oral pantoprazole in healthy volunteers. Eur J Clin Pharmacol. 2012;68:1267–74. doi: 10.1007/s00228-012-1252-3. [DOI] [PMC free article] [PubMed] [Google Scholar]
- 26.Bauer T, Bouman HJ, van Werkum JW, Ford NF, ten Berg JM, Taubert D. Impact of CYP2C19 variant genotypes on clinical efficacy of antiplatelet treatment with clopidogrel: systematic review and meta-analysis. Br Med J. 2011;343:d4588. doi: 10.1136/bmj.d4588. [DOI] [PMC free article] [PubMed] [Google Scholar]
- 27.Li Y, Tang HL, Hu YF, Xie HG. The gain-of-function variant allele CYP2C19*17: a double-edged sword between thrombosis and bleeding in clopidogrel-treated patients. J Thromb Haemost. 2012;10:199–206. doi: 10.1111/j.1538-7836.2011.04570.x. [DOI] [PubMed] [Google Scholar]
- 28.Jang JS, Cho KI, Jin HY, Seo JS, Yang TH, Kim DK, et al. Meta-analysis of cytochrome P450 2C19 polymorphism and risk of adverse clinical outcomes among coronary artery disease patients of different ethnic groups treated with clopidogrel. Am J Cardiol. 2012;110:502–8. doi: 10.1016/j.amjcard.2012.04.020. [DOI] [PubMed] [Google Scholar]
- 29.Li-Wan-Po A, Girard T, Farndon P, Cooley C, Lithgow J. Pharmacogenetics of CYP2C19: functional and clinical implications of a new variant CYP2C19*17. Br J Clin Pharmaco. 2010;69:222–30. doi: 10.1111/j.1365-2125.2009.03578.x. [DOI] [PMC free article] [PubMed] [Google Scholar]
- 30.Satyanarayana Chakradhara Rao U, Devendran A, Satyamoorthy K, Shewade DG, Krishnamoorthy R, Chandrasekaran A. Functional characterization of promoter region polymorphisms of human CYP2C19 gene. Mol Biol Rep. 2011;38:4171–9. doi: 10.1007/s11033-010-0537-9. [DOI] [PubMed] [Google Scholar]
- 31.Fukushima-Uesaka H, Saito Y, Maekawa K, Ozawa S, Hasegawa R, Kajio H, et al. Genetic variations and haplotypes of CYP2C19 in a Japanese population. Drug Metab Pharmacok. 2005;20:300–7. doi: 10.2133/dmpk.20.300. [DOI] [PubMed] [Google Scholar]
- 32.Pedersen RS, Brasch-Andersen C, Sim SC, Bergmann TK, Halling J, Petersen MS, et al. Linkage disequilibrium between the CYP2C19*17 allele and wildtype CYP2C8 and CYP2C9 alleles: identification of CYP2C haplotypes in healthy Nordic populations. Eur J Clin Pharmacol. 2010;66:1199–205. doi: 10.1007/s00228-010-0864-8. [DOI] [PubMed] [Google Scholar]
- 33.Lim JE, Pinsonneault J, Sadee W, Saffen D. Tryptophan hydroxylase 2 (TPH2) haplotypes predict levels of TPH2 mRNA expression in human pons. Mol Psychiatr. 2007;12:491–501. doi: 10.1038/sj.mp.4001923. [DOI] [PubMed] [Google Scholar]
- 34.van der Hoeven TA, Coon MJ. Preparation and properties of partially purified cytochrome P-450 and reduced nicotinamide adenine dinucleotide phosphate-cytochrome P-450 reductase from rabbit liver microsomes. J Biol Chem. 1974;249:6302–10. [PubMed] [Google Scholar]
- 35.Lowry OH, Rosebrough NJ, Farr AL, Randall RJ. Protein measurement with the Folin phenol reagent. J Biol Chem. 1951;193:265–75. [PubMed] [Google Scholar]
- 36.Wang D, Guo Y, Wrighton SA, Cooke GE, Sadee W. Intronic polymorphism in CYP3A4 affects hepatic expression and response to statin drugs. Pharmacogenomics J. 2011;11:274–86. doi: 10.1038/tpj.2010.28. [DOI] [PMC free article] [PubMed] [Google Scholar]
- 37.Wang D, Johnson AD, Papp AC, Kroetz DL, Sadee W. Multidrug resistance polypeptide 1 (MDR1, ABCB1) variant 3435C>T affects mRNA stability. Pharmacogenet Genom. 2005;15:693–704. [PubMed] [Google Scholar]
- 38.Pinsonneault J, Nielsen CU, Sadee W. Genetic variants of the human H+/dipeptide transporter PEPT2: analysis of haplotype functions. J Pharmacol Exp Ther. 2004;311:1088–96. doi: 10.1124/jpet.104.073098. [DOI] [PubMed] [Google Scholar]
- 39.Blaisdell J, Mohrenweiser H, Jackson J, Ferguson S, Coulter S, Chanas B, et al. Identification and functional characterization of new potentially defective alleles of human CYP2C19. Pharmacogenet Genom. 2002;12:703–11. doi: 10.1097/00008571-200212000-00004. [DOI] [PubMed] [Google Scholar]
- 40.Barber RD, Harmer DW, Coleman RA, Clark BJ. GAPDH as a housekeeping gene: analysis of GAPDH mRNA expression in a panel of 72 human tissues. Physiol Genomics. 2005;21:389–95. doi: 10.1152/physiolgenomics.00025.2005. [DOI] [PubMed] [Google Scholar]
- 41.Baker JA, Weber J, Felke E, Price R, Hall SD, Hillgren K, et al. Characterization of a human liver bank as a tool for research in pharmacogenetics (PGx) Clin Pharmacol Ther. 2011;89(Supp1):S75. [Google Scholar]
- 42.Mwinyi J, Hofmann Y, Pedersen RS, Nekvindova J, Cavaco I, Mkrtchian S, et al. The transcription factor GATA-4 regulates cytochrome P450 2C19 gene expression. Life Sci. 2010;86:699–706. doi: 10.1016/j.lfs.2010.02.021. [DOI] [PubMed] [Google Scholar]
- 43.Chen Y, Ferguson SS, Negishi M, Goldstein JA. Identification of constitutive androstane receptor and glucocorticoid receptor binding sites in the CYP2C19 promoter. Mol Pharmacol. 2003;64:316–24. doi: 10.1124/mol.64.2.316. [DOI] [PubMed] [Google Scholar]
- 44.Furukawa M, Nishimura M, Ogino D, Chiba R, Ikai I, Ueda N, et al. Cytochrome p450 gene expression levels in peripheral blood mononuclear cells in comparison with the liver. Cancer Sci. 2004;95:520–9. doi: 10.1111/j.1349-7006.2004.tb03243.x. [DOI] [PMC free article] [PubMed] [Google Scholar]
Associated Data
This section collects any data citations, data availability statements, or supplementary materials included in this article.