

Abstract
Background
There are limited data about the role of gender on the relationship between sleep duration and blood pressure (BP) from rural populations.
Methods
We conducted a cross-sectional rural population-based study. This report includes 1,033 men and 783 women aged 18–65 years from a cohort of twins enrolled in Anhui, China, between 2005 and 2008. Sleep duration was derived from typical bedtime, wake-up time, and sleep latency as reported on a standard sleep questionnaire. Primary outcomes included measured systolic blood pressure (SBP) and diastolic blood pressure (DBP). High blood pressure (HBP) was defined as SBP≥130 mmHg, DBP ≥85 mmHg, or physician diagnosed hypertension. Linear and logistic regression models were used to assess gender-specific associations between sleep duration and BP or HBP, respectively, with adjustment for known risk factors including adiposity and sleep-related disorder risk from the questionnaires. Generalized estimating equations were used to account for intra-twin pair correlations.
Results
Compared with those sleeping 7 to less than 9 hours, women sleeping <7 hours had a higher risk of HBP (odds ratios [ORs] 3.0, 95% confidence interval [CI], 1.4–6.6); men sleeping ≥9 hours had a higher risk of HBP (ORs=1.5, 95%CI: 1.1–2.2).
Conclusions
Among rural Chinese adults, a gender-specific association of sleep duration with BP exists such that HBP is associated with short sleep duration in women and long sleep duration in men. Longitudinal studies are needed to further examine the temporal relationship and biological mechanisms underlying sleep duration and BP in this population. Our findings underscore the potential importance of appropriate sleep duration for optimal blood pressure.
Keywords: sleep duration, high blood pressure, gender difference, rural Chinese
Introduction
Increasing evidence suggests that adequate duration and quality of sleep are important for overall health. Studies that have examined the relationship between sleep duration and blood pressure (BP) have had mixed results.1–4 For example, Gottlieb et al 3 found that usual sleep duration above or below the median of 7–8 hours per night was associated with an increased prevalence of hypertension in a population aged 40–100 years. In contrast, another study 4 reported that sleep duration was not associated with hypertension in the elderly (58–98 years).
A few studies examined the role of gender on these relationships in groups at particular risk for poor cardio-metabolic outcomes. 5, 6 There are prominent gender differences in sleep with women showing longer sleep duration, longer sleep latency, lower rates of sleep apnea, and higher rates of insomnia in comparison to men.7 Furthermore, some evidence suggests that short sleep duration may be associated with more detrimental effects on cardiovascular outcomes among women than men. 8, 9 These findings, together with well-known gender differences in the prevalence of hypertension, 10 led us to explore gender-specific associations between sleep duration and BP.
Most sleep studies to date were conducted in western urban populations. Residents of rural areas constitute a large segment of the world’s total population, particularly in developing countries. In China, 57% of the population lived in rural agricultural regions in 2005. 11 Compared with urban and suburban dwellers, rural populations are more commonly employed in agriculture and small business, are more physically active, and potentially have a higher prevalence of risky health behaviors (eg, smoking, poor diet). However, limited data on sleep duration and health outcomes are available from rural populations. In a rural U.S. sample, one study 6 found an association between short sleep duration and higher body mass index (BMI). In a rural Japanese population, Amagai et al 5 found that males with short sleep and females with long sleep were at an elevated risk of death. Besides the lower prevalence of obesity in rural China compared to western/developed countries, 12, 13 lifestyle patterns that affect nutrition, physical activity, work hours, and sleep in China may differ from those of other countries.
In this report, we examined gender-specific associations between sleep duration and blood pressure in a rural Chinese population aged 18–65 years. We also assessed whether sleep-related disorders and adiposity influence the association between sleep duration and BP.
Methods
Study Population
This study is part of a community-based prospective twin cohort enrolled in 1998–2000 (baseline study) in the rural area of the Anqing region in Anhui province, China. From 2005 to 2008, twins who participated in the baseline study were followed to identify precursors to metabolic syndrome (follow-up study). Detailed information on the enrollment criteria of twins at the baseline and follow-up study has been described previously.14 Sleep-related data were collected at the follow-up visit only. Written informed consent was obtained from each participant. This study was approved by the Institutional Review Boards of Children’s Memorial Hospital, Northwestern University and the Ethics Committee of Anhui Medical University.
Epidemiological Information
At both the baseline and follow up study, a comprehensive questionnaire was used to collect the participants’ demographic, occupational, lifestyle, and dietary information, as well as medical history. In addition, physical activity was assessed using the short version of the International Physical Activity Questionnaire (IPAQ-short, http://www.ipaq.ki.se), and classified as low, moderate or high physical activity as described elsewhere. 15
Blood Pressure Measurements and Definition of High Blood Pressure
BP and heart rate (HR) were assessed in subjects who were seated and rested for at least 10 minutes as previously described.16 The mean of three measurements was used in the final analysis. Pulse Pressure (PP) was calculated as systolic BP (SBP) minus diastolic BP (DBP). Based on the observation that the risk of developing hypertension and cardiovascular disease is reported to be higher in subjects with a high-normal BP (130-139/85-89mmHg) compared to those with a normal BP (120-129/80-84mmHg), 17 high BP (HBP) was defined as SBP ≥ 130 mmHg and/or DBP≥85 mmHg or physician diagnosed hypertension. Further, subjects with HBP were divided into 3 sub-categories: isolated high SBP (IHSBP, SBP≥130 and DBP<85mmHg), isolated high DBP (IHDBP, SBP<130 and DBP≥85mmHg) and high systolic-diastolic BP (HSDBP, SBP≥130 and DBP≥85mmHg). Five subjects with a reported history of hypertension were found to have normal measured BP and were excluded in sub-category analysis.
Sleep Duration and Sleep-Related Variables
We used the following standard sleep questionnaires for measures of sleep duration, sleep quality, risk of sleep apnea, and daytime sleepiness. The Pittsburgh Sleep Quality Index (PSQI), for which a Chinese version has proven to have excellent sensitivity and reliability, 18, 19 was used to assess sleeping habits in the last month, including bedtime, wake-up time, and sleep latency. We calculated total sleep time (TST) as sleep duration from bedtime to wake-up time minus sleep latency. The PSQI consists of nineteen individual items that generate seven “component” scores: subjective sleep quality, sleep latency, sleep duration, habitual sleep efficiency, sleep disturbance, use of sleeping medication, and daytime dysfunction. A global PSQI score >5 indicates a “poor” sleeper.20 The Epworth sleepiness scale (ESS) and the Berlin questionnaire are two screening tools that are widely used in the clinical evaluation of the risk of sleep disorders. The content of the ESS and Berlin questionnaires have been described in detail and used previously with reasonable sensitivity and reliability for subjective sleepiness and obstructive sleep apnea. 21, 22 In brief, determination of high risk and low risk for sleep apnea was based on responses in three symptom categories from the Berlin questionnaire. In category 1, high risk was defined as persistent symptoms (>3 to 4 times/week) in two or more questions about snoring. In category 2, high risk was defined as persistent (>3 to 4 times/week) wake-time sleepiness, drowsiness while riding a bicycle (item modified to fit Chinese rural conditions), or both. In category 3, high risk was defined as a history of hypertension or a BMI ≥25 kg/m2 (obesity has been defined as BMI ≥25.0 kg/m2 in Asian populations 23). Considering that BP is the primary outcome in the current study, a positive response in category 3 was based only on the presence of a BMI ≥25.0 kg/m2. To be considered at high risk for sleep apnea, a patient had to qualify for at least two symptom categories.21 For the ESS, subjects were asked to rate on a scale of 0–3 how likely they would be to doze off or fall asleep in the eight situations, based on their usual way of life in recent times. The scale ranges from 0 to 24 and scores >10 were considered to reflect a high level of daytime sleepiness.22
Anthropometric and Body Fat Measurements
Height and weight were measured using standard protocols without shoes or outerwear.14 Final anthropometric values used in the analysis were the mean of two measures. BMI was calculated as weight (Kg)/height squared (m2). A standard whole-body scan was performed by dual-energy x-ray absorptiometry (DEXA) including total body and three regional fat measures: trunk (chest, abdomen, and pelvis), arms, and legs. Standard software (Lunar V4.6 DPX; GE Medical Systems, Madison, WI, USA) was used to calculate total body fat (TBF).24 Percent body fat (%BF) was calculated by dividing TBF by body weight and multiplying by 100.
Statistical Methods
This report includes a total of 1,816 adults aged 18–65 years who completed the follow-up study. The central focus of the analyses was to examine the gender-specific relationship between sleep duration and BP in rural Chinese adults. The relationships between sleep duration and BP adjusted for age were first explored by gender using a non-parametric SAS procedure, LOESS. 25 The crude relationships were further assessed by multiple linear regression analysis with adjustment for age, smoking (active+passive), alcohol intake, physical activity (low/moderate/high/missing), occupation (physical labor/no), and menopause in females. Next, we used multiple-logistic regression analysis to evaluate the associations between sleep duration and the odds of HBP (SBP ≥ 130 mmHg, DBP ≥ 85 mmHg, or diagnosed hypertension), with adjustment for the above listed covariates. In addition, we evaluated whether BMI and direct adiposity measures, and sleep-related variables—risk of sleep apnea (Berlin questionnaire), daytime sleepiness (ESS), or sleep quality (PSQI)—influence the relationship of sleep duration with BP.
Due to the U-shape relationship between sleep duration and BP, we also analyzed sleep as a categorical variable. Sleep duration was divided into three categories for all of the regression analyses: short (<7 hours), median (7 to less than 9 hours), and long (≥9 hours). The cutoff value of TST was based on two considerations: 1) previous articles have suggested that sleep duration of 7 to 8 hours confers lowest risk3; and 2) in our cohort, sleep duration is longer (median TST: 8.4 hours), and the lowest SBP appeared in TSTs that ranged from 7 to less than 9 hours (Figure 1). Considering this, we used 7 to less than 9 hours as the reference category in the analysis. For the sleep categories, the regression coefficients reflect differences in BP between short or long sleepers and the reference group (average sleepers). Such analysis addressed the question “Are long or short sleepers associated with higher BP?” We have used two-sided P<0.025 to guard against type I error using Bonferroni correction: 0.05/2 tests.
Figure 1.
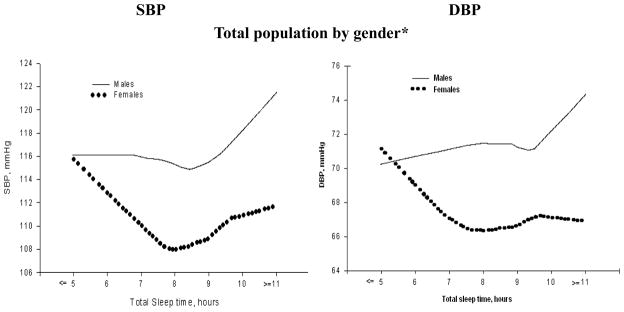
Blood pressure and sleep duration in Chinese population aged 18–65 years by gender adjusted by age
Smoothing plots of systolic blood pressure (SBP)/diastolic blood pressure (DBP) by gender against total sleep time (TST). The X-axis represents total sleep time; the Y-axis displays Systolic/Diastolic Blood pressure, respectively.
All the analyses were conducted separately by gender. All twins were treated as individuals. To account for inter-pair correlation among the twins, robust estimates of the variances were calculated using the generalized estimating equation (GEE) implemented in the SAS Procedure Genmod. Furthermore, we repeated the analyses by including only one twin per family (the first-born twin) (eFigure 1, eTable1–3). Since the results were very similar to those including both twins, this report presented findings using data from all of the twins. To assess if there was any association affected by menopausal status, we repeated regression analysis to evaluate the relationship between sleep duration and BP in women by menopausal status. All of the analyses were performed using SAS V9.1 (SAS Institute Inc., Cary, NC, USA).
Results
This report included 1,816 Chinese adults aged 18–65 years (men: 57%). The prevalence of HBP was 20.2% (209/1033) in men and 9.2% (72/783) in women. Table 1 shows gender-specific characteristics, adiposity measures, BP, HR, and sleep variables for the short-, median-, and long-sleep duration groups. Men with long sleep duration were more likely to have higher BP, and women with short sleep duration had higher BP, %BF and BMI than did individuals in the other same-sex sleep duration groups. In both genders, the short sleep group, in comparison to the other groups, was at higher risk of poor sleep quality.
Table 1.
Epidemiologic and clinical characteristics, sleep variables of 1816 rural Chinese adults aged 18–65 years, Anqing, China.
| TST group | Males | Females | ||||
|---|---|---|---|---|---|---|
| <7H | 7–9H | ≥9H | <7H | 7–9H | ≥9H | |
|
|
||||||
| Number | 159 | 543 | 331 | 107 | 418 | 258 |
| Primary outcome | ||||||
| SBP, mmHg | 117±17 | 116±16 | 118±17 | 114±18 | 108±14 | 110±17* |
| DBP, mmHg | 72±12 | 72±11 | 72±10 | 69±11 | 66±10 | 67±9* |
| PP, mmHg | 45±12 | 44±12 | 46±13 | 45±12 | 42±9 | 43±12* |
| HBP, n(%) | 38(23.9) | 95(17.5) | 76(23.0) | 18(16.8) | 28(6.7) | 26(10.1)* |
| IHSBP, n(%) | 17(10.7) | 46(8.5) | 46(13.9)* | 10(9.4) | 8(1.9) | 10(3.9)* |
| IHDBP, n(%) | 2(1.3) | 13(2.4) | 9(2.7) | 1(0.9) | 5(1.2) | 3(1.2) |
| HSDBP, n(%) | 19(12.0) | 35(6.5) | 20(6.0) | 7(6.5) | 13(3.1) | 12(4.7) |
| Clinical Characteristics | ||||||
| BMI, Kg/m2 | 21.4±2.5 | 21.5±2.7 | 21.5±2.7 | 22.4±2.9 | 21.8±2.6 | 21.7±2.5 |
| %BF, % | 13.6±6.8 | 13.6±7.3 | 13.5±7.2 | 30.3±6.1 | 28.5±6.0 | 28.4±5.7* |
| HR, bpm | 74±9 | 74±9 | 75±10 | 75±8 | 74±8 | 74±7 |
| Obesity (BMI≥25), n(%) | 9(5.7) | 60(11.1) | 34(10.3) | 22(20.6) | 47(11.2) | 26(10.1)* |
| High risk of sleep apnea, n(%) | 7(4.4) | 29(5.3) | 16(4.8) | 2(1.9) | 20(4.8) | 6(2.3) |
| Sleepiness(Epworth>10), n(%) | 8(5.0) | 11(2.0) | 8(2.4) | 5(4.7) | 26(6.2) | 15(5.8) |
| Poor sleep quality, n(%) | 88(55.4) | 118(21.7) | 55(16.6)* | 41(38.3) | 110(26.3) | 58(22.5)* |
| Epidemiologic Characteristics | ||||||
| Age, years | 37.5±14.5 | 36.2±14 | 34.5±13.4 | 34.2±13.0 | 34.6±11.2 | 33.3±11.9 |
| Smoking, n(%) | 136(85.5) | 480(88.4) | 290(87.6) | 85(79.4) | 307(73.4) | 200(77.5) |
| Alcohol, n(%) | 58(36.5) | 201(37.1) | 116(35.3) | 2(1.9) | 10(2.4) | 9(3.5) |
| PA, n(%)I | 24(15.1) | 81(14.9) | 74(22.4)* | 20(18.7) | 85(20.3) | 61(23.6) |
| II | 45(28.3) | 135(24.9) | 58(17.5) | 17(15.9) | 88(21.1) | 56(21.7) |
| III | 64(40.3) | 241(44.4) | 158(47.7) | 51(47.7) | 186(44.5) | 113(43.8) |
| Missing | 26(16.4) | 86(15.8) | 41(12.4) | 19(17.8) | 59(14.1) | 28(10.9) |
| Physical Labor, n(%) | 96(60.4) | 315(58.0) | 202(61.0) | 76(71.0) | 339(81.1) | 198(76.7) |
| Menopause in females, n(%) | 16(15.0) | 47(11.2) | 31(12.0) | |||
Results are mean±SD or n(%)
TST: total sleep time; SBP: systolic blood pressure; DBP: diastolic blood pressure; PP: pulse pressure; HBP: High Blood pressure-defined as SBP≥130 and/or DBP≥85 mmHg or diagnosed hypertension; IHSBP: Isolated High systolic blood pressure-defined as SBP≥130 mmHg and DBP<85mmHg; IHDBP: Isolated High diastolic blood pressure-defined as DBP≥85mmHg and SBP<130mmHg; HSDBP: high systolic-diastolic BP-defined as SBP≥130 and DBP≥85mmHg; BMI: body mass index; %BF: percent body fat; HR: heart rate; PA: physical activity;
p<0.05, P is a 2-sided comparison among three TST groups in both gender.
Figure 1 shows the association between sleep duration and BP in this cohort. The lowest SBP appeared in the subjects who slept from 7 to less than 9 hours, and BP levels were higher with longer sleep duration in men and with shorter sleep duration in women.
Table 2 shows the association between sleep duration categories and BP by multiple linear regression analysis with adjustment for common covariates. Among men, subjects in the long sleep duration group (≥9hours) as compared to the reference group had higher SBP (β(se): 2.5(1.2), p=0.037). Among women, a U-shaped relationship was observed between sleep duration and SBP: subjects with sleep duration above or below the reference group per night had higher SBP [β(se): 6.6(1.9) for short sleep duration, and 3.3(1.2) for long sleep duration, respectively, p<0.025]. The relationships between sleep duration and SBP in both genders did not change after adjustment for adiposity and sleep-related disorders including risk of sleep apnea, daytime sleepiness and sleep quality as assessed by the questionnaires.
Table 2.
Linear regression analysis# on SBP, DBP in relationship to sleep duration (TST) by gender in rural Chinese adults aged 18–65 years.
| TST | Males | Females | ||||||
|---|---|---|---|---|---|---|---|---|
| SBP | DBP | SBP | DBP | |||||
| B(SE) | P | B(SE) | P | B(SE) | P | B(SE) | P | |
|
|
||||||||
| <7H | 0.8(1.6) | 0.613 | −0.1(1.0) | 0.932 | 6.6(1.9) | <0.001 | 3.5(1.2) | 0.003 |
| 7–9H | - | - | - | - | ||||
| ≥9H | 2.5(1.2) | 0.037 | 0.8(0.7) | 0.314 | 3.3(1.2) | 0.007 | 1.2(0.7) | 0.104 |
|
|
||||||||
| Adjustment for Adiposity | ||||||||
| --BMI | ||||||||
| <7H | 1.0(1.5) | 0.522 | 0.1(1.0) | 0.934 | 5.5(1.8) | 0.002 | 2.7(1.1) | 0.012 |
| 7–9H | - | |||||||
| ≥9H | 2.4(1.2) | 0.038 | 0.7(0.7) | 0.318 | 3.3(1.2) | 0.006 | 1.2(0.7) | 0.085 |
| --%BF | ||||||||
| <7H | 0.8(1.5) | 0.587 | −0.1(1.0) | 0.958 | 5.8(1.9) | 0.002 | 2.8(1.1) | 0.011 |
| 7–9H | - | |||||||
| ≥9H | 2.5(1.2) | 0.035 | 0.7(0.7) | 0.295 | 3.4(1.2) | 0.006 | 1.3(0.7) | 0.084 |
| Adjustment for sleep related disorder | ||||||||
| --sleep quality from PSQI | ||||||||
| <7H | 1.1(1.6) | 0.494 | 0.0(1.1) | 0.983 | 6.6(1.9) | <0.001 | 3.6(1.2) | 0.002 |
| 7–9H | - | - | - | |||||
| ≥9H | 2.4(1.2) | 0.040 | 0.7(0.7) | 0.323 | 3.3(1.2) | 0.007 | 1.2(0.7) | 0.110 |
| --risk of sleep apnea from Berlin questionnaire | ||||||||
| <7H | 0.9(1.6) | 0.563 | 0.0(1.0) | 0.997 | 6.8(1.9) | <0.001 | 3.7(1.1) | 0.001 |
| 7–9H | - | - | - | |||||
| ≥9H | 2.4 1.2 | 0.038 | 0.7(0.7) | 0.319 | 3.5(1.2) | 0.004 | 1.4(0.7) | 0.066 |
| --sleepiness from Epworth sleepiness scale | ||||||||
| <7H | 0.8(1.6) | 0.625 | −0.1(1.0) | 0.885 | 6.6(1.9) | <0.001 | 3.6(1.2) | 0.002 |
| 7–9H | - | - | - | |||||
| ≥9H | 2.5(1.2) | 0.038 | 0.7(0.7) | 0.319 | 3.3(1.2) | 0.007 | 1.2(0.7) | 0.100 |
Adjusted by age, smoking(active+passive), alcohol intake, physical activity, occupation, menopause in females. TST: Total sleep time; SBP: systolic blood pressure; DBP: diastolic blood pressure; BMI: body mass index; %BF: percent body fat; A two-sided P<0.025 was used to guard against type I error using Bonferroni correction: 0.05/2 tests
A similar analysis was performed for a binary BP outcome (HBP, yes or no) with results shown in Table 3. Compared to the reference group, males with long sleep duration and females with short sleep duration showed increased odds of HBP (odds ratios [ORs]: 1.5, 95% confidence interval [CI]: 1.1–2.2 in males with sleep duration ≥9hours; ORs: 3.0, 95%CI: 1.4–6.6 in females with sleep duration<7hours). These associations appeared to be independent of sleep disorders and were slightly attenuated after adjustment for adiposity in women. The logistic regression analysis was performed for three BP sub-categories and a significant association was observed between sleep duration and IHSBP (data not shown).
Table 3.
Logistic regression analysis# on HBP in relation to sleep duration by gender in rural Chinese adults aged 18–65 years.
| TST | Males | Females | ||||
|---|---|---|---|---|---|---|
| ORs | 95%CI | P-value | ORs | 95%CI | P-value | |
|
|
||||||
| HBP | ||||||
| <7H | 1.4 | 0.9,2.2 | 0.127 | 3.0 | 1.4,6.6 | 0.005 |
| 7–9H | - | - | ||||
| ≥9H | 1.5 | 1.1,2.2 | 0.021 | 1.8 | 1.0,3.2 | 0.063 |
|
|
||||||
| Adjustment for Adiposity | ||||||
| --BMI | ||||||
| <7H | 1.4 | 0.9,2.2 | 0.114 | 2.4 | 1.1,5.0 | 0.027 |
| 7–9H | - | - | ||||
| ≥9H | 1.5 | 1.1,2.2 | 0.025 | 1.8 | 0.9,3.3 | 0.080 |
| --%BF | ||||||
| <7H | 1.4 | 0.9,2.2 | 0.107 | 2.5 | 1.2,5.2 | 0.019 |
| 7–9H | - | - | ||||
| ≥9H | 1.6 | 1.1,2.3 | 0.019 | 1.8 | 1.0,3.4 | 0.057 |
| Adjustment for sleep related disorder | ||||||
| --sleep quality from PSQI | ||||||
| <7H | 1.4 | 0.9,2.3 | 0.133 | 3.3 | 1.5,7.3 | 0.003 |
| 7–9H | - | - | ||||
| ≥9H | 1.5 | 1.1,2.2 | 0.022 | 1.7 | 0.9,3.1 | 0.075 |
| --risk of sleep apnea from Berlin questionnaire | ||||||
| <7H | 1.5 | 0.9,2.3 | 0.101 | 3.3 | 1.5,7.2 | 0.003 |
| 7–9H | - | - | ||||
| ≥9H | 1.6 | 1.1,2.3 | 0.020 | 1.8 | 1.0,3.5 | 0.050 |
| --sleepiness from Epworth sleepiness scale | ||||||
| <7H | 1.4 | 0.9,2.1 | 0.126 | 3.0 | 1.4,6.6 | 0.005 |
| 7–9H | - | - | ||||
| ≥9H | 1.6 | 1.1,2.3 | 0.017 | 1.8 | 1.0,3.2 | 0.064 |
Adjusted by age, smoking (active+passive), alcohol intake, physical activity, occupation, menopause in females.; HBP: High blood pressure-defined as SBP≥130 and/or DBP≥85 mmHg or diagnosed hypertension. TST: Total sleep time; BMI: body mass index; %BF: percent body fat; ORs: odd ratio; CI: confidence interval; A two-sided P<0.025 was used to guard against type I error using Bonferroni correction: 0.05/2 tests
We also performed additional analyses to ensure that our findings were not affected by potential confounders. Our above analyses treated all twins as individuals. We also explored the relationship between sleep and blood pressure in the same manner with a single twin per family. As shown in the online figure (eFigure 1) and tables (eTable 1–3), the results from a single twin per family are similar to those including both twins. Our study included subjects both before and after menopause. We examined if the association varies by menopause and found that the strongest association between short sleep and BP in women is in pre-menopausal women (ORs : 4.8, 95%CI: 2.1–10.9; eTable 4). There were 19 subjects with high BP requiring drug therapy, and 5 subjects (1 man and 4 women) used hypnotics>1/week. The relationship between sleep duration and BP did not change after we removed these subjects from the analysis or adjusted for the treatment of hypertension/use of hypnotics (data not shown).
Discussion
This is the first study to explore gender-specific associations of sleep duration with BP in a large sample of rural Chinese adults. This report complements and builds upon previous research examining sleep duration, sleep disorders, adiposity and BP in adults.3 Like other groups, we found that sleep duration was associated with HBP in this population. Interestingly, however, high blood pressure was associated with short sleep durations among women, in contrast to long sleep durations among men.
Of note, on average the subjects in this study had longer sleep duration as compared to their counterparts in developed countries (the Gottlieb study3 reported a median of 7 hours of sleep and only 7.6% of the subjects slept ≥ 9 hours, as opposed to this study in which about 30% of the subjects slept ≥ 9 hours). This could be due to differences in lifestyle wherein those who live in Chinese rural areas tend to have higher levels of physical activity, and less stressful lifestyles. This is a relatively lean sample which provides a unique opportunity to investigate the sleep duration-BP relationship in a study population less confounded by obesity.
Gender difference in the relationship between sleep duration and BP
Gender differences in the relationship between sleep duration and cardiovascular risk factors have been reported before. In a previous study, Cappuccio et al26 found that short sleep duration (≤ 5 hour per night) was associated with a higher risk of hypertension in women but not in men. Similarly, another study reported an association between short sleep duration and incident myocardial infarction in middle-aged women, but not men.27 In the Nurse Health Study, 8, 9 a U-shape curve described the association between sleep duration and an increased risk of diabetes and death in women, but was less so among men.28 Consistent with these past results within diverse ethnicities, our study found a U-shape relationship between sleep duration and SBP in Chinese women. We found that high blood pressure was associated with short sleep durations among women, in contrast to long sleep durations among men.
Potential explanations for the observed gender differences
Though the mechanism underlying the gender-specific association between sleep duration and BP is unclear, it has been suggested that certain gender differences in sleep habits could be influenced by environmental (psychosocial) and/or biological (sex hormone) factors. 29 First, we suspect that in the cultural context of rural China, women’s roles/expectations (i.e. childcare), education, and access to health care, as compared to men,30 may affect the gender-specific association between sleep duration and BP. Second, for women, perimenopause and menopause were associated with major hormonal fluctuations. In our female participants with HBP, the mean age of 46 years coincides with the perimenopausal-menopausal period, supporting a potential role for sex hormone changes. We speculate that sex hormone changes may help to explain the gender-specific relationship between sleep duration and BP. Consistent with a previous study,31 we found that the strongest association between short sleep and BP in women was in pre-menopausal women. Of note, the sample size of menopausal women in our study was small. As such, this finding needs to be confirmed in a larger sample. On the other hand, we found that short sleep duration also had a significant positive relationship with adiposity in females. This is consistent with the results of our previous study of adolescents, among whom short sleep duration also was significantly associated with higher adiposity in girls.15 Our current study showed that the relationship between sleep duration and HBP was slightly attenuated after adjustment for adiposity in women. It may be reasonable to speculate that the association between short sleep duration and BP is partly due to the strong relationship between sleep duration and the degree of adiposity in women.
In contrast to the women in our study, men with sleep duration ≥ 9 hours per night had an increased risk of HBP. Long sleep duration also has been associated with hypertension and mortality in previous studies. 3, 9, 32 Few data exist to explain biological mechanisms that may link long sleep duration and BP in men. As men are at a higher risk than women for obstructive sleep apnea,7 potential explanations33 for an association between long sleep duration and cardiovascular risk can include sleep apnea that could increase sleep duration to compensate for sleep fragmentation. However, in our study, the association of long TST with BP was independent of sleep apnea risk, and no significant relationship between sleep apnea risk and sleep duration was noted in men (data not shown). This may be due to the fact that, in this population, the number of individuals who are at high risk of sleep apnea (men: 5.0%, women: 3.6%) was low compared to other populations. 21, 34, 35 Furthermore, it also is possible that worsening physical conditions in men might contribute to increases in both sleep duration and BP. Although men had a higher prevalence of chronic disease than women (data not shown), the history of chronic obstructive pulmonary disease, heart diseases and arthritis showed no significant differences between the three TST groups.
Our data suggest that the association between sleep duration and HBP is mainly driven by the strong relationship between sleep duration and isolated high SBP. In a past experimental study, sleep deprivation increased SBP more than DBP.36 However, recent studies found self-reported/objectively measured sleep durations were more likely associated with SBP than DBP. 1, 37 Factors including study population, nutritional status, and environmental and demographic characteristics could contribute to these different findings.
We also explored other sleep variables (subjective sleep quality, daytime sleepiness and sleep apnea risk) as partial mediators in the relationship of sleep duration and BP. This is supported by findings that these other sleep variables may affect sleep duration and are linked with hypertension.38 However, in the current study the association between sleep duration and HBP remains significant after adjustment for these sleep variables, and these sleep variables have no relationship with HBP. Therefore, our observed sleep-BP relationship appears to be independent of these other sleep variables.
Limitations
This cross-sectional analysis only allows for the establishment of associations and cannot identify causal relationships between sleep duration and high blood pressure. In addition, sleep duration was determined from self-reported sleep measures, although good correlation exists between questionnaire results and sleep diary data. 15 While self-reported data may introduce measurement error, neither the study subjects nor the field staff were aware of the relationship between sleep duration and BP at the time of data collection. Thus, recall bias should be non-differential and therefore might bias results toward the null. A unique aspect of this study is that the population under investigation (Chinese rural cohort) had a relatively low BMI (mean 21.6 kg/m2) compared to that of other similar studies,3, 26 which provides a unique opportunity to investigate the sleep duration-BP relationship in a relatively lean population. However, this also may reduce the generalization of our findings to other populations. Finally, mental health and depression were not assessed in detail. However, in this population, only one person responded “yes” when asked whether “you often feel depressed”.
In summary, the relationship between HBP and short or long sleep duration is gender-specific among rural Chinese adults: HBP is associated with short sleep duration in women, but part of the relationship is adiposity dependent, whereas HBP is associated with longer sleep duration in men. While reverse causality is a possibility to explain cross-sectional associations, one prospective analysis26 found that sleep deprivation may produce detrimental cardiovascular effects among women. This rural Chinese population, in comparison to American rural6 and urban populations, is relatively lean, has a lower incidence of sleep disorders, is more physically active, and has, on average, longer sleep duration. Longitudinal studies are needed to determine how much sleep per night will be optimal for health in this rural Chinese cohort.
Supplementary Material
Acknowledgments
This study is supported in part by grant R01 HD049059 from the National Institute of Child Health and Human Development; R01 HL0864619 from the National Heart, Lung, and Blood Institute; and R01 AG032227 from the National Institute of Aging. We acknowledge the assistance and cooperation of the faculty and staff of the Anhui Institute of Biomedicine, Anhui Medical University, and thank all study participants for their support. We thank Tami Bartell for English editing.
Footnotes
Conflict of interest: none
Publisher's Disclaimer: This is a PDF file of an unedited manuscript that has been accepted for publication. As a service to our customers we are providing this early version of the manuscript. The manuscript will undergo copyediting, typesetting, and review of the resulting proof before it is published in its final citable form. Please note that during the production process errors may be discovered which could affect the content, and all legal disclaimers that apply to the journal pertain.
References
- 1.Knutson KL, Van Cauter E, Rathouz PJ, et al. Association Between Sleep and Blood Pressure in Midlife: The CARDIA Sleep Study. Arch Intern Med. 2009;169(11):1055–61. doi: 10.1001/archinternmed.2009.119. [DOI] [PMC free article] [PubMed] [Google Scholar]
- 2.Eguchi K, Pickering TG, Schwartz JE, et al. Short sleep duration as an independent predictor of cardiovascular events in Japanese patients with hypertension. Arch Intern Med. 2008;168(20):2225–31. doi: 10.1001/archinte.168.20.2225. [DOI] [PMC free article] [PubMed] [Google Scholar]
- 3.Gottlieb DJ, Redline S, Nieto FJ, et al. Association of usual sleep duration with hypertension: the Sleep Heart Health Study. Sleep. 2006;29(8):1009–14. doi: 10.1093/sleep/29.8.1009. [DOI] [PubMed] [Google Scholar]
- 4.van den Berg JF, Tulen JH, Neven AK, et al. Sleep duration and hypertension are not associated in the elderly. Hypertension. 2007;50(3):585–9. doi: 10.1161/HYPERTENSIONAHA.107.092585. [DOI] [PubMed] [Google Scholar]
- 5.Amagai Y, Ishikawa S, Gotoh T, et al. Sleep duration and mortality in Japan: the Jichi Medical School Cohort Study. J Epidemiol. 2004;14(4):124–8. doi: 10.2188/jea.14.124. [DOI] [PMC free article] [PubMed] [Google Scholar]
- 6.Kohatsu ND, Tsai R, Young T, et al. Sleep duration and body mass index in a rural population. Arch Intern Med. 2006;166(16):1701–5. doi: 10.1001/archinte.166.16.1701. [DOI] [PubMed] [Google Scholar]
- 7.Ram S, Seirawan H, Kumar SK, Clark GT. Prevalence and impact of sleep disorders and sleep habits in the United States. Sleep Breath. 2009 doi: 10.1007/s11325-009-0281-3. [DOI] [PubMed] [Google Scholar]
- 8.Ayas NT, White DP, Al-Delaimy WK, et al. A prospective study of self-reported sleep duration and incident diabetes in women. Diabetes Care. 2003;26(2):380–4. doi: 10.2337/diacare.26.2.380. [DOI] [PubMed] [Google Scholar]
- 9.Patel SR, Ayas NT, Malhotra MR, et al. A prospective study of sleep duration and mortality risk in women. Sleep. 2004;27(3):440–4. doi: 10.1093/sleep/27.3.440. [DOI] [PubMed] [Google Scholar]
- 10.Cutler JA, Sorlie PD, Wolz M, et al. Trends in hypertension prevalence, awareness, treatment, and control rates in United States adults between 1988–1994 and 1999–2004. Hypertension. 2008;52(5):818–27. doi: 10.1161/HYPERTENSIONAHA.108.113357. [DOI] [PubMed] [Google Scholar]
- 11.National Bureau of Statistics of China. Series Books of the 2005 National Sample Survey of 1% of Population. China Statistics Press; 2006. [Google Scholar]
- 12.Ma GS, Li YP, Wu YF, et al. The prevalence of body overweight and obesity and its changes among Chinese people during 1992 to 2002. Zhonghua Yu Fang Yi Xue Za Zhi. 2005;39(5):311–5. [PubMed] [Google Scholar]
- 13.Jackson JE, Doescher MP, Jerant AF, Hart LG. A national study of obesity prevalence and trends by type of rural county. J Rural Health. 2005;21(2):140–8. doi: 10.1111/j.1748-0361.2005.tb00074.x. [DOI] [PubMed] [Google Scholar]
- 14.Wang B, Necheles J, Ouyang F, et al. Monozygotic co-twin analyses of body composition measurements and serum lipids. Prev Med. 2007;45(5):358–65. doi: 10.1016/j.ypmed.2007.07.014. [DOI] [PubMed] [Google Scholar]
- 15.Yu Y, Lu BS, Wang B, et al. Short sleep duration and adiposity in Chinese adolescents. Sleep. 2007;30(12):1688–97. doi: 10.1093/sleep/30.12.1688. [DOI] [PMC free article] [PubMed] [Google Scholar]
- 16.Xu X, Niu T, Christiani DC, et al. Environmental and occupational determinants of blood pressure in rural communities in China. Ann Epidemiol. 1997;7(2):95–106. doi: 10.1016/s1047-2797(96)00126-3. [DOI] [PubMed] [Google Scholar]
- 17.Vasan RS, Larson MG, Leip EP, et al. Impact of high-normal blood pressure on the risk of cardiovascular disease. N Engl J Med. 2001;345(18):1291–7. doi: 10.1056/NEJMoa003417. [DOI] [PubMed] [Google Scholar]
- 18.Liu X, Liu L. Sleep habits and insomnia in a sample of elderly persons in China. Sleep. 2005;28(12):1579–87. [PubMed] [Google Scholar]
- 19.Liu X, Tang M, et al. Reliability and validity of the Pittsburgh Sleep Quality Index. Chin J Psychiatry. 1996:29103–7. [Google Scholar]
- 20.Buysse DJ, Reynolds CF, 3rd, Monk TH, Berman SR, Kupfer DJ. The Pittsburgh Sleep Quality Index: a new instrument for psychiatric practice and research. Psychiatry Res. 1989;28(2):193–213. doi: 10.1016/0165-1781(89)90047-4. [DOI] [PubMed] [Google Scholar]
- 21.Netzer NC, Stoohs RA, Netzer CM, Clark K, Strohl KP. Using the Berlin Questionnaire to identify patients at risk for the sleep apnea syndrome. Ann Intern Med. 1999;131(7):485–91. doi: 10.7326/0003-4819-131-7-199910050-00002. [DOI] [PubMed] [Google Scholar]
- 22.Johns MW. A new method for measuring daytime sleepiness: the Epworth sleepiness scale. Sleep. 1991;14(6):540–5. doi: 10.1093/sleep/14.6.540. [DOI] [PubMed] [Google Scholar]
- 23.Appropriate body-mass index for Asian populations and its implications for policy and intervention strategies. Lancet. 2004;363(9403):157–63. doi: 10.1016/S0140-6736(03)15268-3. [DOI] [PubMed] [Google Scholar]
- 24.Pietrobelli A, Formica C, Wang Z, Heymsfield SB. Dual-energy X-ray absorptiometry body composition model: review of physical concepts. Am J Physiol. 1996;271(6 Pt 1):E941–51. doi: 10.1152/ajpendo.1996.271.6.E941. [DOI] [PubMed] [Google Scholar]
- 25.Cleveland WS. Robust locally weighted regression and smoothing scatterplots. J Am Stat Assoc. 1979:74829–36. [Google Scholar]
- 26.Cappuccio FP, Stranges S, Kandala NB, et al. Gender-specific associations of short sleep duration with prevalent and incident hypertension: the Whitehall II Study. Hypertension. 2007;50(4):693–700. doi: 10.1161/HYPERTENSIONAHA.107.095471. [DOI] [PMC free article] [PubMed] [Google Scholar]
- 27.Meisinger C, Heier M, Lowel H, Schneider A, Doring A. Sleep duration and sleep complaints and risk of myocardial infarction in middle-aged men and women from the general population: the MONICA/KORA Augsburg cohort study. Sleep. 2007;30(9):1121–7. doi: 10.1093/sleep/30.9.1121. [DOI] [PMC free article] [PubMed] [Google Scholar]
- 28.Ikehara S, Iso H, Date C, et al. Association of sleep duration with mortality from cardiovascular disease and other causes for Japanese men and women: the JACC study. Sleep. 2009;32(3):295–301. doi: 10.1093/sleep/32.3.295. [DOI] [PMC free article] [PubMed] [Google Scholar]
- 29.Antonijevic IA, Murck H, Frieboes R, Holsboer F, Steiger A. On the gender differences in sleep-endocrine regulation in young normal humans. Neuroendocrinology. 1999;70(4):280–7. doi: 10.1159/000054487. [DOI] [PubMed] [Google Scholar]
- 30.Wu J, Liu Y, Rao K, et al. Education-related gender differences in health in rural China. Am J Public Health. 2004;94(10):1713–6. doi: 10.2105/ajph.94.10.1713. [DOI] [PMC free article] [PubMed] [Google Scholar]
- 31.Stranges S, Dorn JM, Cappuccio FP, et al. A population-based study of reduced sleep duration and hypertension: the strongest association may be in premenopausal women. J Hypertens. 2010;28(5):896–902. doi: 10.1097/HJH.0b013e328335d076. [DOI] [PubMed] [Google Scholar]
- 32.Tamakoshi A, Ohno Y. Self-reported sleep duration as a predictor of all-cause mortality: results from the JACC study, Japan. Sleep. 2004;27(1):51–4. [PubMed] [Google Scholar]
- 33.Youngstedt SD, Kripke DF. Long sleep and mortality: rationale for sleep restriction. Sleep Med Rev. 2004;8(3):159–74. doi: 10.1016/j.smrv.2003.10.002. [DOI] [PubMed] [Google Scholar]
- 34.Taj F, Aly Z, Arif O, Khealani B, Ahmed M. Risk for sleep apnea syndrome in Pakistan: a cross-sectional survey utilizing the Berlin questionnaire. Sleep Breath. 2009;13(1):103–6. doi: 10.1007/s11325-008-0220-8. [DOI] [PubMed] [Google Scholar]
- 35.Bouscoulet LT, Vazquez-Garcia JC, Muino A, et al. Prevalence of sleep related symptoms in four Latin American cities. J Clin Sleep Med. 2008;4(6):579–85. [PMC free article] [PubMed] [Google Scholar]
- 36.Kato M, Phillips BG, Sigurdsson G, et al. Effects of sleep deprivation on neural circulatory control. Hypertension. 2000;35(5):1173–5. doi: 10.1161/01.hyp.35.5.1173. [DOI] [PubMed] [Google Scholar]
- 37.Kotani K, Saiga K, Sakane N, Mu H, Kurozawa Y. Sleep status and blood pressure in a healthy normotensive female population. Int J Cardiol. 2008;125(3):425–7. doi: 10.1016/j.ijcard.2007.01.047. [DOI] [PubMed] [Google Scholar]
- 38.Chobanian AV, Bakris GL, Black HR, et al. Seventh report of the Joint National Committee on Prevention, Detection, Evaluation, and Treatment of High Blood Pressure. Hypertension. 2003;42(6):1206–52. doi: 10.1161/01.HYP.0000107251.49515.c2. [DOI] [PubMed] [Google Scholar]
Associated Data
This section collects any data citations, data availability statements, or supplementary materials included in this article.