Abstract
Disease activity in multiple sclerosis (MS) is strongly linked to the formation of new lesions, which involves a complex sequence of inflammatory, degenerative, and reparative processes. Conventional magnetic resonance imaging (MRI) techniques, such as T2-weighted and gadolinium-enhanced T1-weighted sequences, are highly sensitive in demonstrating the spatial and temporal dissemination of demyelinating plaques in the brain and spinal cord. Hence, these techniques can provide quantitative assessment of disease activity in patients with MS, and they are commonly used in monitoring treatment efficacy in clinical trials and in individual cases. However, the correlation between conventional MRI measures of disease activity and the clinical manifestations of the disease, particularly irreversible disability, is weak. This has been explained by a process of exhaustion of both structural and functional redundancies that increasingly prevents repair and recovery, and by the fact that these imaging techniques do not suffice to explain the entire spectrum of the disease process and lesion development. Nonconventional MRI techniques, such as magnetization transfer imaging, diffusion-weighted imaging, and proton magnetic resonance spectroscopy, which can selectively measure the more destructive aspects of MS pathology and monitor the reparative mechanisms of this disease, are increasingly being used for serial analysis of new lesion formation and provide a better approximation of the pathological substrate of MS plaques. These nonconventional MRI-based measures better assess the serial changes in newly forming lesions and improve our understanding of the relationship between the damaging and reparative mechanisms that occur in MS.
Keywords: diffusion-weighted imaging, lesion development, magnetic resonance imaging, magnetization transfer imaging, multiple sclerosis, proton magnetic resonance spectroscopy
Introduction
Multiple sclerosis (MS), the most common neurological disorder in young white adults, is characterized pathologically by areas of inflammation, demyelination, axonal loss, and gliosis scattered throughout the brain and spinal cord [Confavreux et al. 2000]. MS has been classically considered a white matter disease, but recent pathology and imaging studies have reinforced the notion that the grey matter is also affected by these pathological changes [Kutzelnigg et al. 2005].
The clinical course of MS can follow different patterns over time, but is usually characterized by acute episodes of worsening neurologic function (relapses, bouts), followed by variably complete recovery [relapsing–remitting (RR) course]. Clinical activity and subclinical activity (new lesion formation), demonstrated by magnetic resonance imaging (MRI), are frequent in the RR form of MS, which accounts for 85% of all cases of the disease. After approximately 15 years of the RR course, more than 50% of untreated patients will develop progressive disability with or without occasional relapses, minor remissions, and plateaus [secondary progressive (SP) course] [Lublin and Reingold, 1996; Tremlett et al. 2008].
In a relatively small percentage of patients, the disease has a progressive course from onset without acute relapses [primary progressive (PP) course]. Compared with patients with the more frequent relapsing forms of MS, patients with PP MS have smaller lesion loads, and slower rates of new lesion formation on brain MRI, despite their progressive disability [Miller and Leary, 2007].
As long as the etiology of MS remains unknown, causal therapy and effective prevention are not possible. Immunomodulatory drugs such as β interferon, glatiramer acetate, mitoxantrone, natalizumab, and fingolimod can alter the course of the disease, particularly in the RR form, by reducing the number of relapses and accumulation of lesions as seen on MRI, and by influencing the impact of the disease on disability [Graves et al. 2012]. Patients with the SP form of MS may also benefit from immunomodulatory or immunosuppressive therapy, if presenting relapses [Kappos et al. 2004].
Disease activity in MS is strongly linked to the formation of new lesions, which involves a complex sequence of inflammatory, degenerative and reparative processes. Serial analysis of new lesion formation by means of conventional and advanced magnetic resonance (MR) techniques provides relevant data related to inflammatory activity and repair mechanisms, changes occurring in the evolution of individual lesions, and the relationship between damaging and reparative mechanisms, starting from the early stages of lesion formation. All this information could be highly useful in the assessment of the specific effects of new treatments (neuroprotective or regenerative).
Conventional magnetic resonance imaging
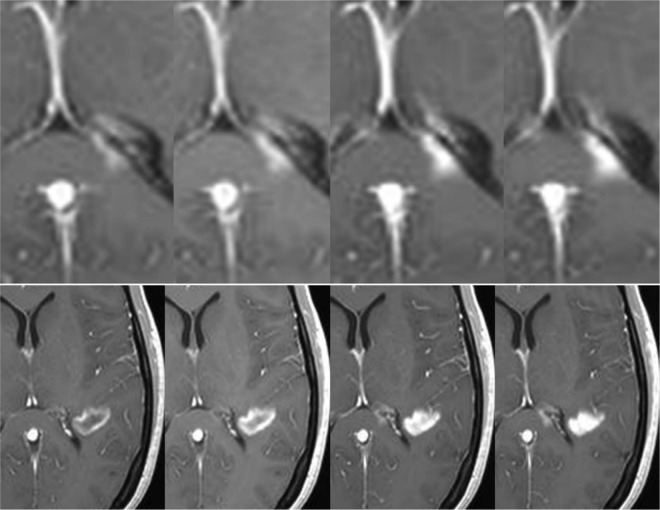
Longitudinal and cross-sectional MRI studies have shown that the formation of new MS plaques is nearly always associated with a focal area of contrast enhancement on T1-weighted images obtained after gadolinium injection, at least in patients with RR or SP MS [Lassmann, 2008]. This enhancement correlates with altered blood–brain barrier permeability in the setting of acute perivascular inflammation and enables differentiation between acute, active lesions and chronic, inactive ones (Figure 1). The gadolinium enhancement varies in size and shape, and usually lasts from a few days to weeks, with an average duration of 3 weeks (97% of lesions enhance during less than 2 months) [Cotton et al. 2003], although this period is shortened by steroid treatment. According to their pattern of contrast uptake on static MRI, lesions have been classified as nodular or ring like (closed and open), although there are no clear histological differences between these two types [Davis et al. 2010; Gaitán et al. 2011]. In fact, these distinct enhancement patterns seem to be simply a consequence of the lesion size and timing of scanning after gadolinium administration, reflecting the capability of gadolinium to fill the lesion, but not the surrounding normal tissue (Figure 2).
Figure 1.
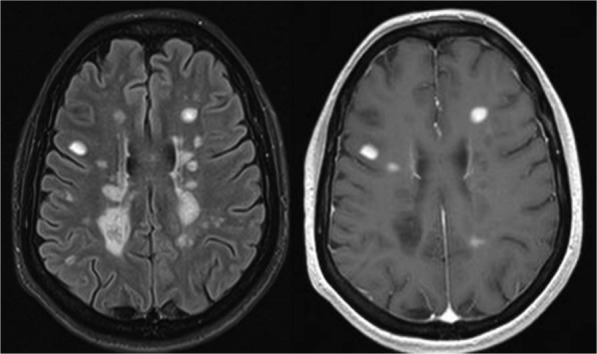
Conventional magnetic resonance imaging in multiple sclerosis. T2-FLAIR (left) and gadolinium-enhanced T1-weighted (right) sequences. T2-FLAIR image shows multiple focal demyelinating lesions that are hyperintense relative to the normal appearing brain tissue. After contrast administration, some of the lesions are hyperintense on T1-weighted images, indicating increased permeability of the blood–brain barrier, a feature that distinguishes acute from chronic demyelinating lesions.
FLAIR, fluid attenuation inversion recovery.
Figure 2.
Evolution of contrast uptake in a newly formed lesion. Serial contrast-enhanced T1-weighted images obtained 5, 10, 15, and 20 min after gadolinium injection. A nodular-enhanced lesion located in the splenium of the corpus callosum (upper row) increases in size over time (centrifugal pattern), while an initial ring-enhanced lesion (lower row) becomes nodular (centripetal pattern).
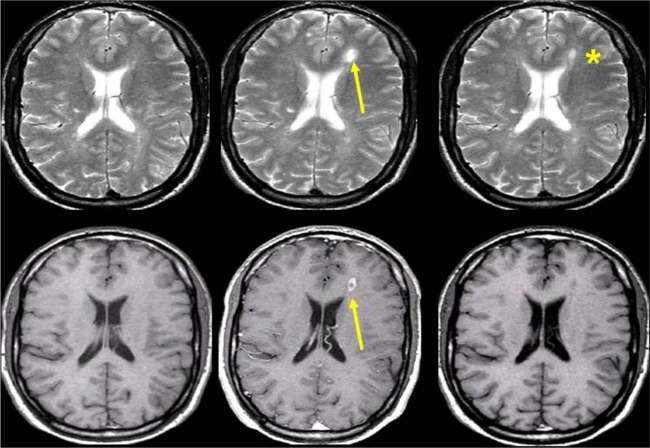
New contrast-enhanced lesions are almost invariably associated with a hyperintense lesion in the same location on T2-weighted images. Nonetheless, they can also be detected before abnormalities appear on T2-weighted scans, and can reappear in chronic lesions, with or without a concomitant increase in size [Filippi, 2000] (Figure 3). These new T2 hyperintense lesions usually shrink in size over time (3–5 months) and their intensity decreases as edema resolves and some tissue repair occurs (extensive or partial remyelination), leaving a much smaller T2 permanent ‘footprint’ of the prior inflammatory event [Meier and Guttmann, 2003; Meier et al. 2007a, 2007b].
Figure 3.
Transverse T2-weighted (upper row) and contrast-enhanced T1-weighted (lower row) brain magnetic resonance imaging scans obtained serially at monthly intervals in a patient with multiple sclerosis. Observe formation of a new plaque in the left frontal white matter showing transient contrast uptake (arrow). With cessation of inflammatory activity, the T2 lesion decreased in size, but left a persistent hyperintense footprint on the T2-weighted image (asterisk).
On unenhanced T1-weighted images, the newly formed lesions with contrast uptake show different signal patterns: 20% of the lesions appear isointense, while 80% appear hypointense in comparison with the normal appearing white matter (wet black holes). Once contrast enhancement ends, more than 40% of these wet or acute black holes become isointense. This change mainly reflects a progressive repair process (remyelination), although resorption of edema may also play a part, at least during the early phases of lesion evolution. Finally, less than 40% of these lesions evolve into persistent or chronic black holes over a 6-month period, which correlate pathologically with permanent demyelination and severe axonal loss (Figures 4 and 5) [Sahraian et al. 2010].
Figure 4.

Serial magnetic resonance imaging (MRI) scans obtained in a patient with relapsing–remitting multiple sclerosis. T2-weighted (upper row), unenhanced T1-weighted (middle row), and contrast-enhanced T1-weighted (lower row) MRI scans obtained at baseline (left) and 1 year later (right). Observe the active ‘black hole’ (nodular enhancement) in the subcortical white matter of the right frontal lobe (arrow), which becomes isointense on T1-weighted imaging with cessation of inflammatory activity (no enhancement).
Figure 5.
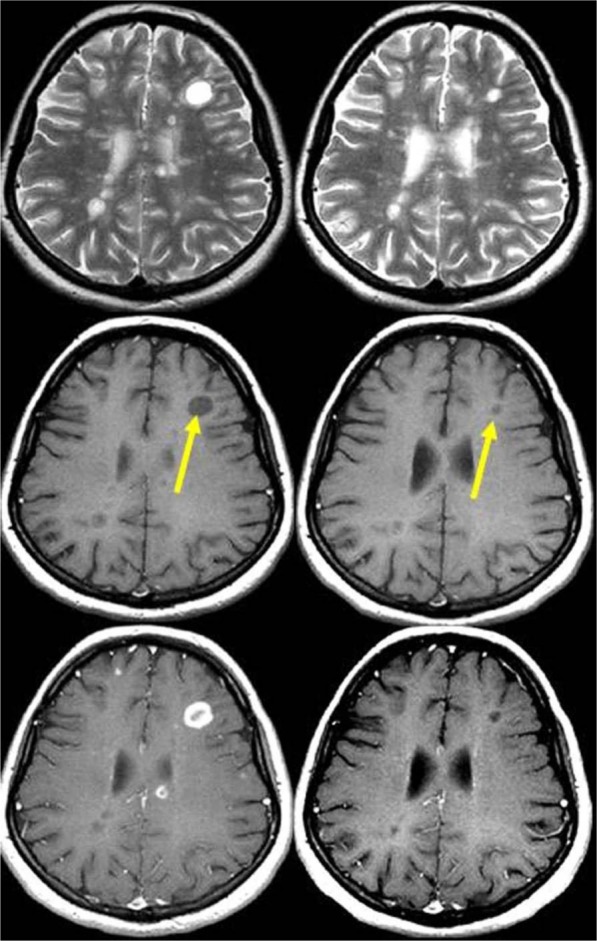
Serial magnetic resonance imaging (MRI) scans obtained in a patient with relapsing–remitting multiple sclerosis. T2-weighted (upper row), unenhanced T1-weighted (middle row), and contrast-enhanced T1-weighted (lower row) MRI scans obtained at baseline (left) and 1 year later (right). Observe the active ‘black hole’ in the subcortical white matter of the left frontal lobe (arrow), which shows a ring-enhancement pattern of contrast uptake. After 1 year, the lesion decreased in size (arrow), but remained hypointense on T1-weighted images, indicating an irreversible black hole.
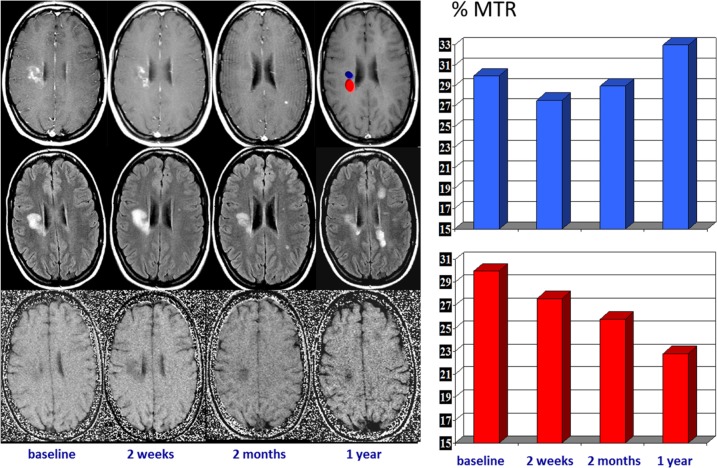
Serial changes in lesion intensity and size on contrast-enhanced T1-weighted imaging and unenhanced T1- and T2-weighted sequences are two related, but temporally disconnected processes. After cessation of gadolinium uptake, significant transient T1/T2 changes persist over a 3- to 6-month period. Based on these changes, MS lesion formation and activity can be divided into two phases: an acute phase characterized by contrast uptake and reflecting blood–brain barrier disruption, and a subacute phase characterized by changes in lesion signal intensity and size on unenhanced T1- and T2-weighted images. This subacute phase can be further divided into early and late periods. In the early period, which is observed within the first weeks after cessation of contrast uptake, T2 lesion shrinkage is commonly interpreted as a result of resorption of inflammatory edema (80% of the initial T2 burden resolves within the initial 10-week period). However, in the late period, the extended size decrease on T2-weighted images that occurs over 3–5 months likely reflects noninflammatory processes such as degeneration and repair (gliosis and remyelination). The characteristics of the subacute phase of lesion formation reflect the balance between injury and repair capacity, and changes in this pattern may represent a shift from inflammatory disease activity toward degenerative activity and closer proximity to a progressive stage of the disease [Meier and Guttmann, 2003; Meier et al. 2007a, 2007b] (Figure 6). This pronounced variability in the appearance of lesions over the first months after their development should be taken into account in cross-sectional and longitudinal studies, which commonly use global T2 lesion volume as a surrogate for disease activity and progression. This net change in overall T2 lesion burden cannot separate the percentage of stable burden from the potentially transient new lesion burden.
Figure 6.
Serial magnetic resonance imaging changes occurring in an acute multiple sclerosis plaque located in the right centrum ovale. Contrast-enhanced T1-weighted images (upper row), T2-FLAIR images (middle row), and magnetization transfer (MTR) maps (lower row) obtained at baseline and at 7 days, 1 month, and 1 year later. The acute enhanced plaque shows the typical waxing and waning characteristics on T2-weighted images. The initial T2 lesion shrinkage observed after cessation of contrast uptake can be interpreted as a consequence of resorption of inflammatory edema, but the subsequent extended size decrease likely reflects a repair process. The serial MTR maps show two different components within the lesion, one with partial MTR recovery, likely reflecting remyelination, and the other with a progressive MTR decrease, likely reflecting ongoing demyelination (on the right, a plot of the serial MTR values obtained at the two locations).
FLAIR, fluid attenuation inversion recovery.
Nonconventional magnetic resonance techniques
Because of the high sensitivity of conventional MRI (cMRI)-derived metrics for detecting MS plaques, these techniques are now the most important paraclinical tool for diagnosing MS, for understanding the natural history of the disease, and for monitoring the efficacy of experimental treatments with a predominantly anti-inflammatory effect. However, the correlation between the extension of lesions observed on cMRI and the clinical manifestations of the disease is weak and underlines the fact that cMRI techniques do not suffice to explain the entire spectrum of the disease process. This clinical–radiological mismatch or paradox may be partially explained by several limitations of cMRI: limited specificity for the various pathological substrates of MS; inability to quantify the extent of damage in normal appearing white matter; inability to detect and quantify the extent of gray matter damage; variability in the clinical expression of MS plaques in different anatomical locations (e.g. spinal cord and optic nerve); and inability to assess the effectiveness of reparative mechanisms in MS [Barkhof, 2002].
In recent years, considerable effort has been made to overcome these limitations with nonconventional MR-derived metrics that can selectively measure the more destructive aspects of MS pathology and monitor the reparative mechanisms [Giacomini and Arnold, 2008; Barkhof et al. 2009]. These nonconventional metrics, which include magnetization transfer (MT) MRI, diffusion-weighted imaging, and proton MR spectroscopy (1H-MRS), among others, have been used to assess the microstructural and metabolic changes that occur in newly formed lesions, and have led to a better understanding of the processes that occur in lesion development.
Proton magnetic resonance spectroscopy
1H-MRS allows noninvasive characterization of metabolic abnormalities in the central nervous system. 1H-MRS provides important insights into the chemical–pathological changes that take place in patients with MS, not only within focal lesions visible on conventional MRI, but also within the normal appearing brain tissue, thereby increasing our knowledge about the pathological processes occurring in this disease. This method is particularly valuable for assessing the neurodegenerative component of MS, which is known to start in the early phases, through quantitative assessment of the amino acid N-acetylaspartate (NAA), considered a marker of neuronal/axonal function and density. Other metabolites, such as choline (Cho), myo-inositol (mIns), creatine (Cr), glutamate (Glu), lipids, and lactate (Lac) which play a significant role in the pathophysiology of the inflammatory component and repair mechanisms of MS, can also be detected with 1H-MRS.
The aim of the first 1H-MRS studies was to characterize MS lesions in their different stages of evolution. Acute gadolinium-enhanced MS lesions typically show increases in Cho and Lac resonances during the first 6–10 weeks following their appearance on cMRI. Increased Cho concentration can be interpreted as a measure of membrane phospholipids released during active myelin breakdown and of increased cell density due to the presence of inflammatory cells. Lac increases mainly reflect the metabolism of inflammatory cells or neuronal mitochondrial dysfunction. The NAA pattern in the acute phase of lesion development is highly variable, ranging from almost no change with respect to normal brain tissue to significant decreases. Since NAA is detected almost exclusively in neurons in the healthy adult brain, decreases in this metabolite are interpreted as a measure of neuronal/axonal dysfunction or loss [Arnold et al. 2000; Sajja et al. 2009]. This initial NAA decrease may persist over time, indicating irreversible neuroaxonal injury, or show partial recovery starting a few weeks after the onset of lesion development and continuing for several months [Davie et al. 1994; De Stefano et al. 1995]. Few 1H-MRS studies have focused on the changes that take place in other metabolites, and the results are sometimes contradictory. Of particular relevance in MS plaques is the behavior of Cr, a metabolite present in both neurons and glial cells, with higher concentrations in glia than in neurons [Urenjak et al. 1993]. Cr, which commonly remains stable, can show significant increases [Srinivasan et al. 2005] or decreases [De Stefano et al. 1995; Zaaraoui et al. 2010]. These changes may be related to varying amounts of neuroaxonal and oligodendroglial loss, and astrocytic proliferation.
Short echo time spectra provide evidence of transient increases in visible lipids in some lesions, probably released during myelin breakdown [Narayana et al. 1998]. These lipid peaks have been identified in prelesional areas [areas of normal appearing white matter (NAWM) that subsequently developed an MRI-visible plaque]. A localized increase in Cho has also been described in areas of NAWM months before subsequent development of an MRI-visible plaque [Narayan et al. 1998; Tartaglia et al. 2002], which is consistent with focal prelesional myelin membrane disease. These observations suggest that demyelination can occur months before acute inflammatory changes become evident. Other nonconventional MR techniques, such as MT imaging, diffusion-weighted imaging, and dynamic susceptibility-weighted sequences have also shown abnormalities in this prelesional stage, further supporting the presence of subtle progressive alterations in tissue integrity prior to focal leakage of the blood–brain barrier as part of plaque formation in MS [Silver et al. 1998; Filippi et al. 1998; Rocca et al. 2000; Werring et al. 2000; Wuerfel et al. 2004].
Increases have been reported in mIns, a proposed glial marker likely related to microglial proliferation [Hattingen et al. 2011], and in Glu [Srinavasan et al. 2005], which is consistent with active inflammatory infiltrates (large quantities of glutamate are produced and released by activated leucocytes, macrophages and microglial cells) [Piani et al. 1991]. In addition, application of metabolite-nulling techniques that differentiate between macromolecular resonances and metabolites have shown elevated macromolecule resonances in the range of 0.9–1.3 ppm in acute lesions, whereas in chronic lesions, the values are similar to those of healthy controls. These macromolecules do not fit the spectral pattern of lipids, and may be interpreted as markers of myelin fragments [Mader et al. 2001].
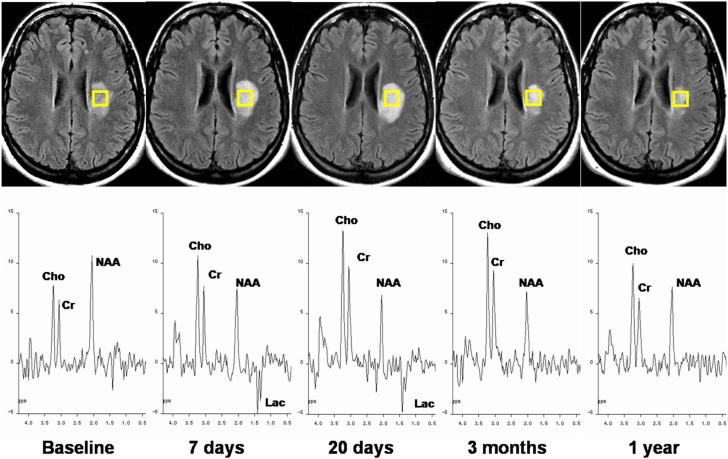
Acute MS plaques usually progress to chronic irreversible plaques (with varying degrees of neuronal/axonal loss) as inflammatory activity abates, edema resolves, and reparative mechanisms such as remyelination become active. These pathologic changes, which can be partially assessed with cMRI techniques as described above, can also be demonstrated using 1H-MRS, and are seen as changes in the spectral pattern [Arnold et al. 1992; Mader et al. 2000; Rovira et al. 2002]. Among the more generally recognized changes, there is a progressive return of Lac to normal levels within weeks, while Cho and lipids decrease for some months, but do not always return to normal values. A moderate increase in Cr may also be detected, likely resulting from gliosis and remyelination [Mader et al. 2000]. NAA may further decrease, indicating progressive neuronal/axonal damage, or show partial recovery over several months without reaching normality. This recovery cannot be explained simply by resolution of edema and inflammation; other processes, such as increases in the diameter of previously shrunken axons secondary to remyelination, and reversible metabolic changes in neuronal mitochondria, also seem to have an important role [Arnold et al. 2000; Sajja et al. 2009] (Figure 7 and Table 1).
Figure 7.
Serial magnetic resonance imaging and spin-echo spectra recorded at an echo time of 135 ms from an acute multiple sclerosis plaque. T2-FLAIR images show an initial progressive lesion size increase followed by a decrease over 1 year of follow up. 1H-MRS during the acute stage shows the presence of Lac, a slight decrease in NAA, and an increase in Cho. The longitudinal study demonstrates Lac disappearance at 3 months, persistent low levels of NAA, a progressive Cho increase during the first weeks followed by partial recovery, and relatively stable Cr at all time points.
1H-MRS, proton magnetic resonance spectroscopy; Cho, choline; Cr, creatine; FLAIR, fluid attenuation inversion recovery; Lac, lactate; NAA, N-acetylaspartate.
Table 1.
Summary of the changes in the main metabolites of the proton magnetic resonance spectrum that may be present in multiple sclerosis brain lesions.
| Metabolite | Acute stage | Evolution | Chronic |
|---|---|---|---|
| Macromolecules | ↑ | tendency to ↓ | not present |
| Lipid | ↑ | tendency to ↓ | ↓ or not present |
| Lactate | ↑ | tendency to ↓ | not present |
| N-acetylaspartate | ↓ | further ↓ partial ↑ | ↓ |
| Glutamic/glutamine | ↑ | tendency to ↓ | |
| Creatine/phosphocreatine | ↓, stable or ↑ | further ↑ partial ↓ | ↑ |
| Choline compounds | ↑ | further ↑partial ↓ | ↑ |
| Myo-inositol | ↑ | remain or further ↑ | ↑ |
Despite the possibilities of 1H-MRS in the assessment of metabolic changes occurring in lesion development, this technique remains a research tool with limited value as a biomarker of disease progression and treatment response in clinical practice and therapeutic trials. The technical demands of 1H-MRS and its low reproducibility across centers have limited its use to single-center trials, and usually in small patient cohorts [Sarchielli et al. 1998; Schubert et al. 2002; Khan et al. 2008; Wolinsky et al. 2007; Sajja et al. 2008].
Diffusion tensor magnetic resonance imaging
Diffusion tensor imaging (DTI) is sensitive to the random translational motion of water molecules in tissue. This movement (diffusion) can be quantified by applying magnetic field gradients in different directions, thus enabling calculation of various metrics that measure the interaction of water molecules with cell membranes, myelin sheaths, and macromolecules, and providing information on tissue integrity at a microscopic scale well beyond the typical MRI resolution. Tissue has physical structures that limit diffusion in different directions, so diffusion is typically described as a three-dimensional ellipsoid through a 3 × 3 matrix. In nerve tissue, the directional diffusivity derived from DTI measurements describes microscopic water movement parallel to (λ||, axial diffusivity) and perpendicular to (λ⊥, radial diffusivity) axonal tracts. Studies using experimental models of white matter injury have shown that decreased λ|| is associated with acute axonal injury, and increased λ⊥ is associated with myelin injury [Budde et al. 2007]. Diffusion ellipsoids in highly organized fiber tracts (e.g. pyramidal tracts and the corpus callosum) are very elongated. Fractional anisotropy (FA) is a common metric to describe the degree of diffusion directionality or elongation. A high FA within a single voxel indicates that diffusion occurs predominantly along a single axis, while a low FA signifies that diffusion occurs along all three cardinal axes. An overall measure of diffusion magnitude is described by the mean diffusivity (MD), which ignores anisotropy and simply describes the overall magnitude of diffusion [Pagani et al. 2007].
DTI has demonstrated an increased MD and decreased FA in areas of normal appearing brain tissue from patients with MS, indicating subtle, diffuse injury with increasing mobility of water molecules and disruption of tissue architecture.
DTI has also been used to characterize the pathological substrate of focal demyelinating plaques. Typically, these lesions show increased MD values and decreased FA compared with the contralateral normal-appearing white matter, which are especially high in acute contrast-enhanced lesions and in chronic T1-hypointense lesions [Rovaris et al. 2005]. These abnormalities persist to a variable extent in lesions that have the most severely altered tissue matrix [Castriota-Scanderbeg et al. 2003]. Fox and colleagues serially analyzed the FA of new enhanced MS lesions and observed that after an initial FA decrease, there is a subsequent increase that is most prominent during the first 2 months [Fox et al. 2011]. This increase was mainly driven by changes in radial diffusivity, a feature that may represent remyelination. These authors also found that a higher decrease in radial diffusivity within gadolinium-enhanced lesions at baseline, but not changes in this or other DTI metrics during 1 year of follow up, predicted conversion of these lesions to T1 black holes at 12 months. These findings support the notion that this type of evolution is predominantly influenced by the degree of initial injury and not by the amount of later recovery. All these findings support the use of DTI as a quantitative measure of the degree of brain tissue in MS.
Acute MS plaques may show a transient decrease in MD values soon after the onset of new symptoms, with subsequent pseudonormalization and signs of developing vasogenic edema (Figure 8). Although the pathological substrate of this transient, early MD reduction in a subgroup of newly forming MS plaques has not been demonstrated, it could reflect swelling of the myelin sheaths, a decrease in vascular supply leading to cytotoxic edema, or dense inflammatory cell infiltration [Rovira et al. 2002; Eisele et al. 2012].
Figure 8.
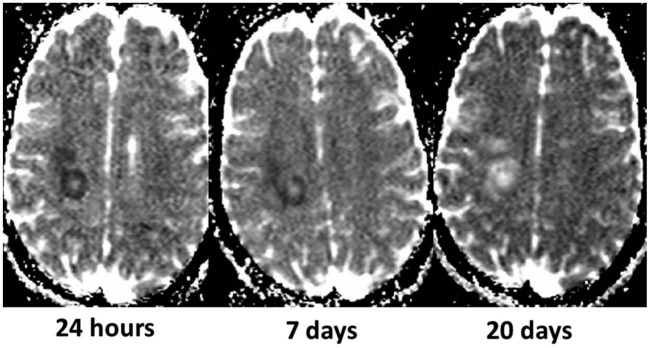
Transient reduced diffusivity of an acute multiple sclerosis plaque (same lesion as in Figure 7) in a 22-year-old woman who was admitted to the hospital for sudden dysarthria, numbness of the right hand, and ensuing right hemiparesis. The apparent diffusion coefficient (ADC) maps obtained serially after onset of symptoms show an initially low ADC, likely reflecting cytotoxic edema or dense inflammatory cell infiltration, followed by a progressive ADC increase paralleling the development of vasogenic edema.
Some studies have also shown that an MD increase in areas of normal appearing white matter may precede the appearance of a new lesion on cMRI [Rocca et al. 2000; Werring et al. 2000] by several weeks, suggesting that focal inflammatoryblood–brain barrier leakage is not necessarily the initiating event in MS plaque formation.
Although diffusion MR measures appear sensitive to dynamic disease-related changes, and some studies have shown moderate to strong correlations between overall DTI measures and neurological disability and cognitive impairment [Rovaris et al. 2002], the existing data do not suffice to support the use of DTI-derived metrics as a marker of tissue integrity for studies of neuroprotective therapies in MS.
Magnetization transfer imaging
MT is a quantitative MRI technique based on interactions and exchanges between mobile protons in a free water pool and those bound to macromolecules. By using MR sequences with and without an off-resonance saturation pulse, MT allows calculation of an index, the magnetization transfer ratio (MTR). Decreases in the MTR indicate that protons bound to the brain tissue matrix have a diminished capacity to exchange magnetization with the surrounding free water. Thus, this index provides an estimate of the extent of tissue structure disruption and affords a potential window into the macromolecular environment that is not directly visible using cMRI techniques [Horsfield et al. 2003].
In MS, MTR can be used to quantify the integrity of myelinated white matter in large areas of the brain [Filippi and Agosta, 2007]. Changes in the MTR of cerebral white matter are highly weighted by changes in myelin content because of the overwhelming contribution of myelin to the macromolecules involved in the magnetization transfer phenomenon [Schmierer et al. 2004].
Decreased MTRs have been reported in acute gadolinium-enhanced lesions and chronic MS lesions, with the most prominent changes found in T1-hypointense lesions [Filippi and Agosta, 2007]. The MTR decrease in acute lesions, consistent with demyelination, can be followed by a variable recovery over the subsequent months that probably reflects remyelination (Figure 6). Partial or complete recovery of MTR values is more likely to occur when the initial decrease is only modest, whereas a high initial MTR decline predicts whether the lesion will evolve into a T1-hypointense lesion (chronic black hole) [Dousset et al. 1992; Deloire-Grassin et al. 2000]; hence, the degree of MTR change has been proposed as a marker of overall lesion severity.
At least in some lesions dramatic changes in normal appearing white matter areas can be seen months before the formation of new T2 lesions [Filippi et al, 1998; Fazekas et al. 2002; Pike et al. 2000]. This observation further supports the notion that in a subgroup of MS lesions, primary myelin damage precedes the inflammatory mediated blood–brain barrier disruption.
Chen and colleagues recently developed a voxelwise analysis method to monitor longitudinal MTR changes in individual newly formed MS lesions [Chen et al. 2008]. This method could be of value to assess the neuroprotective (slowing degeneration of neural tissue) or reparative (restoring tissue integrity and function) effects of new treatments in MS. Some lesion regions were seen to exhibit significant increases in MTR, consistent with remyelination, that were ongoing for approximately 7 months after enhancement and then stabilized. The same study showed that decreases in MTR consistent with demyelination were ongoing for approximately 33 months after enhancement. These observations of continuing demyelination and remyelination for months and years after lesion formation indicate that the window of opportunity for a therapeutic intervention may be longer than is usually assumed.
Conclusion
cMRI is highly sensitive in detecting disease activity in MS, and is commonly used for monitoring and predicting treatment response in clinical trials and in clinical practice. Although changes in total T2 lesion burden or enhanced lesion number are generally used to evaluate treatment response, a specific therapeutic effect (neuroprotective, reparative) may be more readily apparent when changes in lesion dynamics are assessed using nonconventional MRI-based metrics. These measures can better show the relationship between damaging and reparative mechanisms that occur since the early stages of lesion formation. Among all the nonconventional MRI techniques able to track the longitudinal changes in newly formed lesions, MTR is likely the most practicable for this purpose. It has shown capability for detecting myelin concentration, and can be considered a predictive index of disease progression [Fazekas et al. 2002] and an outcome measure in clinical trials evaluating the potential neuroprotective or reparative effects of new treatments.
Footnotes
Funding: This research received no specific grant from any funding agency in the public, commercial, or not-for-profit sectors.
Conflict of interest statement: The authors declare no conflicts of interest in preparing this article.
Contributor Information
Àlex Rovira, Magnetic Resonance Unit (IDI), Department of Radiology, Hospital Universitari Vall d’Hebron, Passeig Vall d’Hebron 119-129, 08035 Barcelona, Spain.
Cristina Auger, Magnetic Resonance Unit (IDI), Department of Radiology, Hospital Universitari Vall d’Hebron, Barcelona, Spain.
Juli Alonso, Magnetic Resonance Unit (IDI), Department of Radiology, Hospital Universitari Vall d’Hebron, Barcelona, Spain.
References
- Arnold D., De Stefano N., Narayanan S., Matthews P. (2000) Proton MR spectroscopy in multiple sclerosis. Neuroimaging Clin N Am 10: 789–798 [PubMed] [Google Scholar]
- Arnold D., Matthews P., Francis G., O’Connor J., Antel J. (1992) Proton magnetic resonance spectroscopic imaging for metabolic characterization of demyelinating plaques. Ann Neurol 31: 235–241 [DOI] [PubMed] [Google Scholar]
- Barkhof F. (2002) The clinico-radiological paradox in multiple sclerosis revisited. Curr Opin Neurol 15: 239–245 [DOI] [PubMed] [Google Scholar]
- Barkhof F., Calabresi P., Miller D., Reingold S.(2009) Imaging outcomes for neuroprotection and repair in multiple sclerosis trials. Nat Rev Neurol 5: 256–266 [DOI] [PubMed] [Google Scholar]
- Budde M., Kim J., Liang H., Schmidt R., Russell J., Cross A., et al. (2007) Toward accurate diagnosis of white matter pathology using diffusion tensor imaging. Magn Reson Med 57: 688–695 [DOI] [PubMed] [Google Scholar]
- Castriota-Scanderbeg A., Fasano F., Hagberg G., Nocentini U., Filippi M., Caltagirone C. (2003) Coefficient D(av) is more sensitive than fractional anisotropy in monitoring progression of irreversible tissue damage in focal nonactive multiple sclerosis lesions. AJNR Am J Neuroradiol 24: 663–670 [PMC free article] [PubMed] [Google Scholar]
- Chen J., Collins D., Atkins H., Freedman M., Arnold D. for the Canadian MS/BMT Study Group (2008) Magnetization transfer ratio evolution with demyelination and remyelination in multiple sclerosis lesions. Ann Neurol 63: 254–262 [DOI] [PubMed] [Google Scholar]
- Confavreux C., Vukusic S., Moreau T., Adeleine P. (2000) Relapses and progression of disability in multiple sclerosis. N Engl J Med 343: 1430–1438 [DOI] [PubMed] [Google Scholar]
- Cotton F., Weiner H., Jolesz F., Guttmann C.(2003) MRI contrast uptake in new lesions in relapsing-remitting MS followed at weekly intervals. Neurology 60: 640–646 [DOI] [PubMed] [Google Scholar]
- Davie C., Hawkins C., Barker G., Brennan A., Tofts P., Miller D., et al. (1994) Serial proton magnetic resonance spectroscopy in acute multiple sclerosis lesions. Brain 117: 49–58 [DOI] [PubMed] [Google Scholar]
- Davis M., Auh S., Riva M., Richert N., Frank J., McFarland H., et al. (2010) Ring and nodular multiple sclerosis lesions: a retrospective natural history study. Neurology 74: 851–856 [DOI] [PMC free article] [PubMed] [Google Scholar]
- Deloire-Grassin M., Brochet B., Quesson B., Delalande C., Dousset V., Canioni P., et al. (2000) In vivo evaluation of remyelination in rat brain by magnetization transfer imaging. J Neurol Sci 178: 10–16 [DOI] [PubMed] [Google Scholar]
- De Stefano N., Matthews P., Antel J., Preul M., Francis G., Arnold D. (1995) Chemical pathology of acute demyelinating lesions and its correlation with disability. Ann Neurol 38: 901–909 [DOI] [PubMed] [Google Scholar]
- De Stefano N., Matthews P., Arnold D. (1995) Reversible decreases in N-acetylaspartate after acute brain injury. Magn Reson Med 34: 721–727 [DOI] [PubMed] [Google Scholar]
- Dousset V., Grossman R., Ramer K., Schnall M., Young L., Gonzalez-Scarano F., et al. (1992) Experimental allergic encephalomyelitis and multiple sclerosis: lesion characterization with magnetization transfer imaging. Radiology 182: 483–491 [DOI] [PubMed] [Google Scholar]
- Eisele P., Szabo K., Griebe M., Rossmanith C., Förster A., Hennerici M., et al. (2012) Reduced diffusion in a subset of acute MS lesions: a serial multiparametric MRI study. AJNR Am J Neuroradiol 33: 1369–1373 [DOI] [PMC free article] [PubMed] [Google Scholar]
- Fazekas F., Ropele S., Enzinger C., Seifert T., Strasser-Fuchs S. (2002) Quantitative magnetization transfer imaging of pre-lesional white-matter changes in multiple sclerosis. Mult Scler 8: 479–484 [DOI] [PubMed] [Google Scholar]
- Filippi M. (2000) Enhanced magnetic resonance imaging in multiple sclerosis. Mult Scler 6: 320–326 [DOI] [PubMed] [Google Scholar]
- Filippi M., Agosta F. (2007) Magnetization transfer MRI in multiple sclerosis. J Neuroimaging 17: 22S–26S [DOI] [PubMed] [Google Scholar]
- Filippi M., Rocca M., Martino G., Horsfield M., Comi G. (1998) Magnetization transfer changes in the normal appearing white matter precede the appearance of enhancing lesions in patients with multiple sclerosis. Ann Neurol 43: 809–814 [DOI] [PubMed] [Google Scholar]
- Fox R., Cronin T., Lin J., Wang X., Sakaie K., Ontaneda D., et al. (2011) Measuring myelin repair and axonal loss with diffusion tensor imaging. AJNR Am J Neuroradiol 32: 85–91 [DOI] [PMC free article] [PubMed] [Google Scholar]
- Gaitán M., Shea C., Evangelou I., Stone R., Fenton K., Bielekova B., et al. (2011) Evolution of the blood–brain barrier in newly forming multiple sclerosis lesions. Ann Neurol 70: 22–29 [DOI] [PMC free article] [PubMed] [Google Scholar]
- Giacomini P., Arnold D. (2008) Non-conventional MRI techniques for measuring neuroprotection, repair and plasticity in multiple sclerosis. Curr Opin Neurol 21: 272–277 [DOI] [PubMed] [Google Scholar]
- Graves D., Frohman T., Flores A., Hardeman P., Logan D., et al. (2012) Current and emerging therapies in multiple sclerosis: a systematic review. Ther Adv Neurol Disord 5: 205–220 [DOI] [PMC free article] [PubMed] [Google Scholar]
- Hattingen E., Magerkurth J., Pilatus U., Hübers A., Wahl M., Ziemann U. (2011) Combined (1) H and (31) P spectroscopy provides new insights into the pathobiochemistry of brain damage in multiple sclerosis. NMR Biomed 24: 536–546 [DOI] [PubMed] [Google Scholar]
- Horsfield M., Barker G., Barkhof F., Miller D., Thompson A., Filippi M. (2003) Guidelines for using quantitative magnetization transfer magnetic resonance imaging for monitoring treatment of multiple sclerosis. J Magn Reson Imaging 17: 389–397 [DOI] [PubMed] [Google Scholar]
- Kappos L., Weinshenker B., Pozzilli C., Thompson A., Dahlke F., Beckmann K., et al. (2004) European (EU-SPMS) Interferon beta-1b in Secondary Progressive Multiple Sclerosis Trial Steering Committee and Independent Advisory Board; North American (NA-SPMS) Interferon beta-1b in Secondary Progressive Multiple Sclerosis Trial Steering Committee and Independent Advisory Board. Interferon beta-1b in secondary progressive MS: a combined analysis of the two trials. Neurology 63: 1779–1787 [DOI] [PubMed] [Google Scholar]
- Khan O., Shen Y., Bao F., Caon C., Tselis A., Latif Z., et al. (2008) Long-term study of brain 1H-MRS study in multiple sclerosis: effect of glatiramer acetate therapy on axonal metabolic function and feasibility of long-term H-MRS monitoring in multiple sclerosis. J Neuroimaging 18: 314–319 [DOI] [PubMed] [Google Scholar]
- Kutzelnigg A., Lucchinetti C., Stadelmann C., Brück W., Rauschka H., Bergmann M., et al. (2005) Cortical demyelination and diffuse white matter injury in multiple sclerosis. Brain 128: 2705–2712 [DOI] [PubMed] [Google Scholar]
- Lassmann H. (2008) The pathologic substrate of magnetic resonance alterations in multiple sclerosis. Neuroimaging Clin N Am 18: 563–576 [DOI] [PubMed] [Google Scholar]
- Lublin F., Reingold S. (1996) Defining the clinical course of multiple sclerosis: results of an international survey. National Multiple Sclerosis Society (USA) Advisory Committee on Clinical Trials of New Agents in Multiple Sclerosis. Neurology 46: 907–911 [DOI] [PubMed] [Google Scholar]
- Mader I., Roser W., Kappos L., Hagberg G., Seelig J., Radue E., et al. (2000) Serial proton MR spectroscopy of contrast-enhancing multiple sclerosis plaques: absolute metabolic values over 2 years during a clinical pharmacological study. AJNR Am J Neuroradiol 21: 1220–1227 [PMC free article] [PubMed] [Google Scholar]
- Mader I., Seeger U., Weissert R., Klose U., Naegele T., Melms A., et al. (2001) Proton MR spectroscopy with metabolite-nulling reveals elevated macromolecules in acute multiple sclerosis. Brain 124: 953–961 [DOI] [PubMed] [Google Scholar]
- Meier D., Guttmann C. (2003) Time-series analysis of MRI intensity patterns in multiple sclerosis. Neuroimage 20: 1193–1209 [DOI] [PubMed] [Google Scholar]
- Meier D., Weiner H., Guttmann C. (2007a) MR imaging intensity modeling of damage and repair in multiple sclerosis: relationship of short-term lesion recovery to progression and disability. AJNR Am J Neuroradiol 28: 1956–1963 [DOI] [PMC free article] [PubMed] [Google Scholar]
- Meier D., Weiner H., Guttmann C. (2007b) Time-series modeling of multiple sclerosis disease activity: a promising window on disease progression and repair potential? Neurotherapeutics 4: 485–498 [DOI] [PMC free article] [PubMed] [Google Scholar]
- Miller D., Leary S. (2007) Primary-progressive multiple sclerosis. Lancet Neurol 6: 903–912 [DOI] [PubMed] [Google Scholar]
- Narayana P., Doyle T., Lai D., Wolinsky J. (1998) Serial proton magnetic resonance spectroscopic imaging, contrast-enhanced magnetic resonance imaging, and quantitative lesion volumetry in multiple sclerosis. Ann Neurol 43: 56–71 [DOI] [PubMed] [Google Scholar]
- Pagani E., Bammer R., Horsfield M., Rovaris M., Gass A., Ciccarelli O., et al. (2007) Diffusion MR imaging in multiple sclerosis: technical aspects and challenges. AJNR Am J Neuroradiol 28: 411–420 [PMC free article] [PubMed] [Google Scholar]
- Piani D., Frei K., Do K., Cuénod M., Fontana A. (1991) Murine brain macrophages induced NMDA receptor mediated neurotoxicity in vitro by secreting glutamate. Neurosci Lett 133: 159–162 [DOI] [PubMed] [Google Scholar]
- Pike G., De Stefano N., Narayanan S., Worsley K., Pelletier D., Francis G., et al. (2000) Multiple sclerosis: magnetization transfer MR imaging of white matter before lesion appearance on T2-weighted images. Radiology 215: 824–883 [DOI] [PubMed] [Google Scholar]
- Rocca M., Cercignani M., Iannucci G., Comi G., Filippi M. (2000) Weekly diffusion-weighted imaging of normal-appearing white matter in MS. Neurology 55: 882–884 [DOI] [PubMed] [Google Scholar]
- Rovaris M., Gass A., Bammer R., Hickman S., Ciccarelli O., Miller D., et al. (2005) Diffusion MRI in multiple sclerosis. Neurology 65: 1526–1532 [DOI] [PubMed] [Google Scholar]
- Rovaris M., Iannucci G., Falautano M., Possa F., Martinelli V., Comi G., et al. (2002) Cognitive dysfunction in patients with mildly disabling relapsing-remitting multiple sclerosis: an exploratory study with diffusion tensor MR imaging. J Neurol Sci 195: 103–109 [DOI] [PubMed] [Google Scholar]
- Rovira A., Pericot I., Alonso J., Rio J., Grivé E., Montalban X. (2002) Serial diffusion-weighted MR imaging and proton MR. AJNR Am J Neuroradiol 23: 989–994 [PMC free article] [PubMed] [Google Scholar]
- Sahraian M., Radue E., Haller S., Kappos L. (2010) Black holes in multiple sclerosis: definition, evolution, and clinical correlations. Acta Neurol Scand 122: 1–8 [DOI] [PubMed] [Google Scholar]
- Sajja B., Narayana P., Wolinsky J., Ahn C. for the PROMiSe Trial MRSI Group (2008) Longitudinal magnetic resonance spectroscopic imaging of primary progressive multiple sclerosis patients treated with glatiramer acetate: multicenter study. Mult Scler 14: 73–80 [DOI] [PubMed] [Google Scholar]
- Sajja B., Wolinsky J., Narayana P. (2009) Proton magnetic resonance spectroscopy in multiple sclerosis. Neuroimaging Clin N Am 19: 45–58 [DOI] [PMC free article] [PubMed] [Google Scholar]
- Sarchielli P., Presciutti O., Tarducci R., Gobbi G., Alberti A., Pelliccioli G., et al. (1998) 1H-MRS in patients with multiple sclerosis undergoing treatment with interferon beta-1a: results of a preliminary study. J Neurol Neurosurg Psychiatry 64: 204–212 [DOI] [PMC free article] [PubMed] [Google Scholar]
- Schmierer K., Scaravilli F., Altman D., Barker G., Miller D. (2004) Magnetization transfer ratio and myelin in postmortem multiple sclerosis brain. Ann Neurol 56: 407–415 [DOI] [PubMed] [Google Scholar]
- Schubert F., Seifert F., Elster C., Link A., Walzel M., Mientus S., et al. (2002) Serial 1H-MRS in relapsing-remitting multiple sclerosis: effects of interferon-beta therapy on absolute metabolite concentrations. MAGMA 14: 213–222 [DOI] [PubMed] [Google Scholar]
- Silver N., Lai M., Symms M., Barker G., McDonald W., Miller D. (1998) Serial magnetization transfer imaging to characterize the early evolution of new MS lesions. Neurology 51: 758–764 [DOI] [PubMed] [Google Scholar]
- Srinivasan R., Sailasuta N., Hurd R., Nelson S., Pelletier D. (2005) Evidence of elevated glutamate in multiple sclerosis using magnetic resonance spectroscopy at 3 T. Brain 128: 1016–1025 [DOI] [PubMed] [Google Scholar]
- Tartaglia M., Narayanan S., De Stefano N., Arnaoutelis R., Antel S., Francis S., et al. (2002) Choline is increased in pre-lesional normal appearing white matter in multiple sclerosis. J Neurol 249: 1382–1390 [DOI] [PubMed] [Google Scholar]
- Tremlett H., Yinshan Z., Devonshire V. (2008) Natural history of secondary-progressive multiple sclerosis. Mult Scler 14: 314–324 [DOI] [PubMed] [Google Scholar]
- Urenjak J., Williams S., Gadian D., Noble M. (1993) Proton nuclear magnetic resonance spectroscopy unambiguously identifies different neural cell types. J Neurosci 13: 981–989 [DOI] [PMC free article] [PubMed] [Google Scholar]
- Werring D., Brassat D., Droogan A., Clark C., Symms M., Barker G., et al. (2000) The pathogenesis of lesions and normal-appearing white matter changes in multiple sclerosis: a serial diffusion MRI study. Brain 123: 1667–1676 [DOI] [PubMed] [Google Scholar]
- Wolinsky J., Narayana P., O’Connor P., Coyle P., Ford C., Johnson K., et al. (2007) Glatiramer acetate in primary progressive multiple sclerosis: results of a multinational, multicenter, double-blind, placebo-controlled trial. Ann Neurol 61: 14–24 [DOI] [PubMed] [Google Scholar]
- Wuerfel J., Bellmann-Strobl J., Brunecker P., Aktas O., McFarland H., Villringer A., et al. (2004) Changes in cerebral perfusion precede plaque formation in multiple sclerosis: a longitudinal perfusion MRI study. Brain 127: 111–119 [DOI] [PubMed] [Google Scholar]
- Zaaraoui W., Rico A., Audoin B., Reuter F., Malikova I., Soulier E., et al. (2010) Unfolding the long-term pathophysiological processes following an acute inflammatory demyelinating lesion of multiple sclerosis. Magn Reson Imaging 28: 477–486 [DOI] [PubMed] [Google Scholar]


