

Abstract
In this paper, we demonstrate how public opinion surveys can be designed to collect information pertinent to computational behavior modeling, and we present the results of a public opinion and behavior survey conducted during the 2009–2010 H1N1 influenza pandemic. The results are used to parameterize the Health Belief Model of individual health-protective decision making. Survey subjects were asked questions about their perceptions of the then-circulating influenza and attitudes towards two personal protective behaviors: vaccination and avoidance of crowds. We empirically address two important issues in applying the Health Belief Model of behavior to computational infectious disease simulation: (1) the factors dynamically influencing the states of the Health Belief Model variables and (2) the appropriateness of the Health Belief Model in describing self-protective behavior in the context of pandemic influenza.
Keywords: Health Belief Model, Mathematical modeling, H1N1, opinion survey, behavior change
1 BACKGROUND
It is well established in the epidemiological literature that individual and group behavior influences the outcome of contagious disease outbreaks (1–4). Agent-based models that explicitly incorporate individual behavioral decision-making into computational epidemic simulations are increasingly being recognized as the next generation of epidemiological models (5–7). However, the core relationships between the simulated epidemics and the process of decision-making by individual agents have not been well-established. Here, we build upon a mathematical framework we previously proposed for incorporating behavioral response into agent-based epidemic models (7). We present data collected both to enhance the understanding of health behavior decision-making by individuals and to develop empirically-based dynamic models of this decision-making.
A number of psychological models have been proposed that describe health related decision-making(8). One of the first such models, the Health Belief Model (HBM), specifies four factors that determine an individual’s decision to adopt a health-promoting behavior: (1) the Perceived Severity of the adverse health condition being avoided, (2) the individual’s Perceived Susceptibility to the adverse condition, (3) the Perceived Benefits the person associates with the behavior, and (4) the individual’s Perceived Barriers to adopting the protective behavior (9,10).
Later revisions to the HBM added additional factors such as (5) Self-efficacy, an individual’s confidence in his or her ability to take action, and (6) external Cues to Action that promote individual awareness. For this exploratory analysis, we restrict our focus to the original four factors in order to represent a well-structured and readily parameterized survey framework (7,11). Our methodology could also be applied to other versions of the HBM and to other behavior models.
Surveys with questions concerning the HBM variables and the adoption of health-promoting behaviors are a staple of the health perception literature (12−23). These have a largely unexplored potential for parameterizing computational behavior-adoption models. Despite the rather extensive literature on correlations between health beliefs and behavior, there has been very little work that empirically explores the drivers that cause those health beliefs to change over the course of an outbreak. For example, to properly model an individual’s perception of the severity of a disease, a theory of what new information makes an individual’s perceived severity change between low and high is necessary. Some candidate “drivers” are the instantaneous prevalence of the disease, the geographic or social proximity of the individual to publicized outbreaks, and the intensity of media attention being placed upon the epidemic. A mechanistic understanding of the relationships between external drivers and health beliefs is crucial for a well-structured computational model. For this reason, in addition to collecting data on the variables of the HBM, we collected data on their hypothesized drivers.
In this paper, we use our public survey to address three aims: 1) to provide a structured framework demonstrating how to parameterize a computational behavior model from survey data, 2) to use the survey responses to evaluate the Health Belief Model, and 3) to identify drivers of the HBM variables appropriate for computational modeling.
2 METHODS
In this paper we report the results of a public opinion survey that was conducted in Allegheny County, Pennsylvania during the 2009–2010 Influenza A (H1N1) outbreak (referred to as ‘H1N1’ in the rest of the paper, and as ‘swine flu’ in the survey text). Questions were asked regarding the respondents’ perceptions of and experiences with H1N1 influenza, in particular with respect to the variables of the Health Belief Model. Respondents were asked about their Perceived Susceptibility to the disease and about two separate measures of Perceived Severity, perceived chance of death following contracting swine flu and perceived hardship of H1N1 relative to seasonal flu. Respondents were asked their opinion of the amount of media coverage of the outbreak and the governmental response to the pandemic as well as their opinions of the efficacy of two protective personal health behaviors, vaccination and avoidance of crowded public areas (Perceived Benefits), and their adherence to these practices. They were also asked the perceived difficulty of avoiding crowds and concern about side effects of vaccination (Perceived Barriers). Respondents were asked whether they intended to be vaccinated and whether they had already received immunization. The full text of the survey is provided as Supplemental Information.
The survey was divided into two phases as illustrated in Figure 1. Sixty-three responses were gathered from October 27, 2009 to December 5, 2009, reflecting a time when H1N1 incidence was peaking (24) Two hundred thirty responses were collected from January 7, 2010 to April 1, 2010, coinciding with the epidemic’s conclusion.
Figure 1.
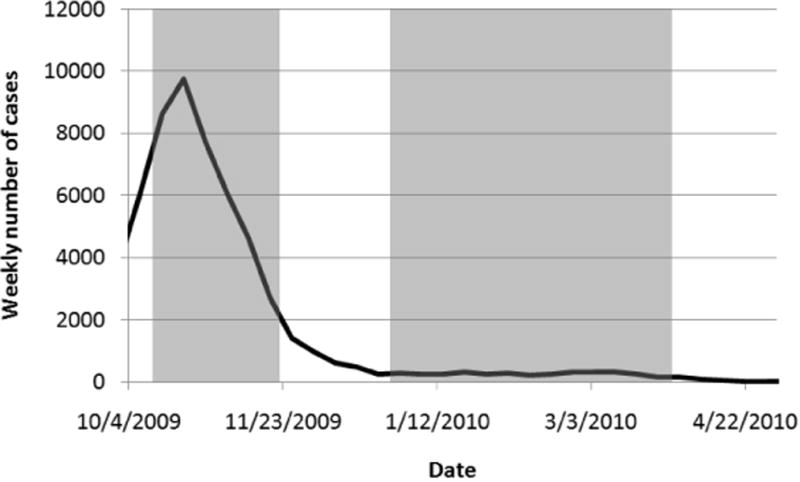
Periods in which the survey was conducted (shaded regions), relative to weekly confirmed US H1N1 cases reported by the CDC.
The survey was conducted by a trained interviewer who made telephone calls during the late afternoon and evening. Telephone numbers were selected from a directory of Allegheny County, Pennsylvania by using random number generators to first select a page within the phonebook and then select a phone number from the page. Respondents who indicated willingness to participate in the survey (34% of those reached) were screened for current residence within the county. The demographics of the respondents are summarized in Table I.
Table I.
Survey respondents’ demographics
| Survey Period 1 | Survey Period 2 | |
|---|---|---|
| (10/27/2009 – 12/5/2009) | (1/7/2010 – 4/1/2010) | |
| 63 responses | 230 responses | |
|
| ||
| Variable | n (fraction) | n (fraction) |
| Age | ||
| Under 25 | 10 (0.16) | 3 (0.013) |
| 25–49 | 15 (0.24) | 53 (0.23) |
| 50–64 | 19 (0.30) | 62 (0.27) |
| Over 65 | 19 (0.30) | 110 (0.48) |
| No answer given | 2 (0.0087) | |
| Gender | ||
| Female | 44 (0.70) | 154 (0.67) |
| Male | 19 (0.30) | 74 (0.32) |
| No answer given | 2 (0.0087) | |
| Ethnicity | ||
| Caucasian | 56 (0.89) | 207 (0.90) |
| African American/Black | 7 (0.11) | 13 (0.057) |
| Asian | 3 (0.013) | |
| No answer given | 4 (0.017) | |
| Other | 3 (0.013) | |
| Education | ||
| Some high school, High school, or Associate’s degree | 35 (0.56) | 122 (0.53) |
| 4-year college degree or Higher | 27 (0.43) | 104 (0.45) |
| No answer given | 1 (0.016) | 4 (0.017) |
3 Results
Many of our questions were posed on a 5-point Likert scale: “Strongly disagree”, “Disagree”, “Neutral/Moderate”, “Agree”, and “Strongly agree”. We dichotomized the 5-point responses into binary categories for our analysis. As the ‘neutral’ and ‘moderate’ responses were ambiguous with respect to the binary classification, we grouped them depending on which characterization produced the strongest correlations with the health promoting behavior. In the following tables the dichotomization for each independent variable is indicated.
3.1 Change in responses over time
A two-sided mean difference t-test was conducted for each question to measure the change between the survey periods (Table II). The perceived likelihood of contracting H1N1, the perceived force of the epidemic (improving or worsening), and the reported frequency of news coverage decreased significantly across the two survey periods. Some variables did not significantly change: perceived likelihood of death, perceived hardship of H1N1, opinion of the government response, opinion of media coverage, benefits of protective behaviors, and barriers to performing the protective behaviors. Repeating analyses with nonparametric tests (Mann Whitney U, Wilcoxon W) showed a similar pattern of change across the two survey periods.
Table II.
Aggregate responses for the two time-periods. The text following the questions indicates how the responses were dichotomized. The significance of differences between answers in the two survey periods are indicated:
| Survey 1 | Survey 2 | |
|---|---|---|
| (10/27/2009 – 12/5/2009) | (1/7/2010 – 4/1/2010) | |
| fraction (N = 63) | fraction (N = 230) | |
| Do you plan to be, or have you been, vaccinated against the swine flu? | ||
| Yes | 0.36 | 0.28 |
|
| ||
| How concerned are you about potential side effects of a vaccine? | ||
| Indifferent or Concerned (vs. Not concerned) | 0.60 | 0.59 |
|
| ||
| How effective do you think a vaccine is in protecting you from catching the swine flu? | ||
| Effective or Very effective (vs. Very ineffective, Ineffective, or Moderately effective) | 0.44 | 0.50 |
|
| ||
| Avoiding crowded places reduces my likelihood of contracting the swine flu. | ||
| Agree or Strongly Agree (vs. Strongly disagree, Disagree, or Neutral) | 0.59 | 0.65 |
|
| ||
| It is difficult to avoid crowded environments. | ||
| Neutral, Agree, or Strongly agree (vs. Strongly disagree or Disagree) | 0.91 | 0.90 |
|
| ||
| How much news coverage of the swine flu have you seen in the past few weeks? | ||
| A lot (vs. Very little or Some) | 0.75 | 0.11*** |
|
| ||
| How would you classify the media’s coverage of the swine flu, in general? | ||
| Somewhat overblown or Very overblown (vs. Not reported at all, Under-reported, or Fair) | 0.68 | 0.62 |
|
| ||
| How prepared do you believe the government is for swine flu? | ||
| Too much or Completely overblown (vs. Not nearly enough, Adequate but could have done more, or Just right) | 0.13 | 0.17 |
|
| ||
| Would you say the general state of the epidemic in the US is: | ||
| Improving (vs. Worsening) | 0.66 | 0.95*** |
|
| ||
| If you were to catch the swine flu, what do you think the level of hardship would be relative to a regular cold or flu? | ||
| Worse or Much worse (vs. Not as bad or Same) | 0.58 | 0.66 |
|
| ||
| How frequently have you made a conscious effort to avoid crowded places to avoid possibly being exposed to swine flu? | ||
| Occasionally, Frequently, or Very frequently (vs. Never or Infrequently) | 0.29 | 0.42* |
|
| ||
| Do you personally know anybody who has fallen ill with swine flu, or suspects they may have it? | ||
| Yes | 0.46 | 0.34 |
|
| ||
| Do you believe you have had the swine flu? | ||
| Yes | 0.12 | 0.039 |
|
| ||
| How likely do you think you are to contract the swine flu? | ||
| Neutral, Likely, or Very likely (vs. Very unlikely or Unlikely) | 0.48 | 0.24*** |
|
| ||
| If you were to catch the swine flu, how likely would you be to die as a result? | ||
| Neutral, Likely, or Very likely (vs. Very unlikely or Unlikely) | 0.27 | 0.18 |
p ≤ 0.05,
p ≤ 0.01,
p ≤ 0.001
3.2 Correlations of attitudes with behaviors
For our correlational analyses (Tables III–IX), survey responses from both time periods were grouped together to compensate for the small number of responses during the early period. To test for potential influence of this aggregation on our analysis we introduced a dummy variable, “Survey Period”, coded 0 for surveys conducted on or before December 5, 2009 and 1 for surveys conducted on or after January 7, 2010. “Survey Period” was not found to be a significant variable in any of our regressions.
Table III.
Univariate logistic correlations with the health promoting variables (1) planning to or having been vaccinated against H1N1 and (2) making an effort to avoid crowded places.
| Have been or plan to be vaccinated | Avoiding crowds | |
|---|---|---|
| Odds Ratio (95% CI) | Odds Ratio (95% CI) | |
| How effective do you think a vaccine is in protecting you from catching the swine flu? (Perceived Benefits) | ||
| Very ineffective, Ineffective, or Moderately effective | 1 | |
| Effective or Very effective | 2.3 (1.4, 3.8)** | NS |
|
| ||
| Avoiding crowded places reduces my likelihood of contracting the swine flu. (Perceived Benefits) | ||
| Strongly disagree, Disagree, or Neutral | 1 | |
| Agree or Strongly agree | NA | 4.2 (2.4, 7.3)*** |
|
| ||
| How concerned are you about potential side effects of a vaccine? (Perceived Barriers) | ||
| Not Concerned | 1 | |
| Indifferent or Very concerned | 0.30 (0.18, 0.50)*** | NA |
|
| ||
| How would you classify the media’s coverage of the swine flu, in general? | ||
| Not reported at all, Underreported, or Fairly reported | 1 | 1 |
| Somewhat overblown or Very overblown | 0.54 (0.31, 0.91)* | 0.48 (0.29, 0.81)** |
|
| ||
| How prepared do you believe the government is for swine flu? | ||
| Not nearly enough, Adequate but could have done more, or Just right | 1 | |
| Too much or Completely overblown | 0.13 (0.038, 0.42)*** | NS |
|
| ||
| If you were to catch the swine flu, what do you think the level of hardship would be relative to a regular cold or flu? (Perceived Severity) | ||
| Not as bad or Same | 1 | |
| Worse or Much worse | 2.2 (1.2, 3.8)** | NS |
|
| ||
| If you were to catch the swine flu, how likely would you be to die as a result? | ||
| Very unlikely or Unlikely | 1 | |
| Moderately likely, Likely, or Very likely | NS | 1.9 (1.1, 3.5)* |
|
| ||
| Do you personally know anybody who has fallen ill with swine flu, or suspects they may have it? | ||
| No | 1 | |
| Yes | NS | 0.57 (0.34, 0.94)* |
|
| ||
| Gender | ||
| Female | 1 | |
| Male | NS | 0.42 (0.24, 0.72)** |
|
| ||
| Education | ||
| Some high school, High school, or Associate’s degree | 1 | |
| 4-year college degree or Higher | NS | 0.50 (0.31, 0.81)** |
|
| ||
| Age | ||
| 65 or younger | 1 | |
| Over 65 | NS | 1.6 (1.0, 2.6)* |
p ≤ 0.05,
p ≤ 0.01,
p ≤ 0.001. NA (Not Applicable), NS (Not Significant at p ≤ 0.05)
Table IX.
Variables correlated with avoiding crowded places Perceived Benefits and Perceived Barriers at p ≤ 0.05
| Avoiding crowded places reduces my likelihood of contracting the swine flu. (Perceived Benefits) | Odds Ratio (95% CI) | p-value |
|---|---|---|
| Agree or Strongly agree (vs. Strongly disagree, Disagree, or Neutral) | ||
|
| ||
| How likely do you think you are to contract the swine flu? | ||
| Very unlikely or Unlikely | 1 | 0.011 |
| Moderately likely, Likely, or Very likely | 2.1 (1.2, 3.7) | |
|
| ||
| It is difficult to avoid crowded environments. | Odds Ratio (95% CI) | p-value |
| Neutral, Agree or Strongly agree (vs. Strongly disagree, Disagree) | ||
|
| ||
| Education | ||
| Some high school, High school, or Associate’s degree | 1 | 0.015 |
| 4-year college degree or Higher | 3.0 (1.2, 7.2) | |
Table III presents univariate correlations between behavior and survey responses significant at the p ≤ 0.05 level (insignificant correlations are not shown). Vaccination was correlated with perceiving the effectiveness of vaccine to be high (Perceived Benefits), perceiving the chance of side effects to be low (Perceived Barriers), perceiving the hardship of the disease to be severe (Perceived Severity), and not believing the media coverage or government response to be excessive. The Perceived Susceptibility to contracting H1N1 was not correlated with intention to be vaccinated.
Avoiding crowded places was significantly correlated with perceiving such behavior as being effective at preventing H1N1 (Perceived Benefits), believing oneself to be likely to die following contracting H1N1 (Perceived Severity), believing the media coverage to not be excessive, and being female. However, neither the difficulty of avoiding crowded places (Perceived Barriers) nor one’s Perceived Susceptibility to H1N1 were significantly correlated with avoiding crowded places.
3.3 Models of behavior
Table IV shows the multivariate logistic relationship between the Health Belief Model variables and the two health behaviors of our study. For vaccination, the standard components of the HBM were correlated with behavior, although Perceived Susceptibility was not significant. Avoiding crowded places was correlated only with Perceived Benefits. Difficulty of crowd avoidance (Perceived Barriers), hardship (Perceived Severity), and likelihood of contracting H1N1 (Perceived Susceptibility) were not correlated with this behavior.
Table IV.
Multivariate regressions of behavior adoption with variables of the HBM.
| A. Intention to be Vaccinated | OR (95% CI) | p-value | AIC 310.8 |
|---|---|---|---|
| Intercept (OR0) | 0.35 (0.18, 0.69) | 0.0026 | |
|
| |||
| How effective do you think a vaccine is in protecting you from catching the swine flu? (Perceived Benefits) (ORben) | |||
| Very ineffective, Ineffective or Moderately neffective | 1.0 | ||
| Effective or Very effective | 1.9 (1.1, 3.2) | 0.033* | |
|
| |||
| How concerned are you about potential side effects of a vaccine? (Perceived Barriers) (ORbar) | |||
| Not concerned | 1.0 | ||
| Indifferent or Concerned | 0.27 (0.15, 0.48) | 6.5 * 10−6* | |
|
| |||
| If you were to catch the swine flu, what do you think the level of hardship would be relative to a regular cold or flu? (Perceived Severity) (ORsev) | |||
| Not as bad or About the same | 1.0 | ||
| Worse or Much worse | 2.7 (1.5, 5.0) | 0.0013* | |
|
| |||
| How likely do you think you are to contract the swine flu? (Perceived Susceptibility) (ORsus) | |||
| Very unlikely or Unlikely | 1.0 | ||
| Moderately likely, Likely, or Very likely | 1.3 (0.71, 2.3) | 0.40 | |
| B. Avoids crowded places – Moderately often, Frequently, or Very frequently (vs. Very infrequently or Infrequently) | OR (95% CI) | p-value | AIC 363.83 |
|---|---|---|---|
| Intercept (OR0) | 0.28 (0.12, 0.67) | 0.0040 | |
|
| |||
| Avoiding crowded places reduces my likelihood of contracting the swine flu. (Perceived Benefits) (ORben) | |||
| Strongly disagree, Disagree, or Neutral | 1.0 | ||
| Agree or Strongly agree | 3.8 (2.2, 6.8) | 3.5 * 10−6* | |
|
| |||
| It is difficult to avoid crowded environments? (Perceived Barriers) (ORbar) | |||
| Strongly disagree or Disagree | 1.0 | ||
| Neutral, Agree, or Strongly agree | 0.74 (0.33, 1.7) | 0.46 | |
|
| |||
| If you were to catch the swine flu, how likely would you be to die as a result? (Perceived Severity) (ORsev) | |||
| Very unlikely or Unlikely | 1.0 | ||
| Moderately likely, Likely, or Very likely | 1.7 (0.93, 3.1) | 0.084 | |
|
| |||
| How likely do you think you are to contract the swine flu? (Perceived Susceptibility) (ORsus) | |||
| Very unlikely or Unlikely | 1.0 | ||
| Moderately likely, Likely, or Very likely | 1.3 (0.76, 2.3) | 0.33 | |
p ≤ 0.05
Equation 1, the standard logistic regression equation expressed in terms of odds ratios, is parameterized by the odds ratios in Table IV and can be used as a model of decision making in agent-based simulations (7). The HBM variables are in one of two states: xi = 0 (low) or 1 (high) for each i ∈ (Sus, Sev, Ben, Bar) (abbreviations of Susceptibility, Severity, Benefits, and Barriers).
| (1) |
In a fully implemented agent-based model, the probability that an agent adopts a particular behavior could be calculated by this equation. For example, an individual with ‘high’ Perceived Benefits, and ‘low’ Perceived Severity, Susceptibility, and Barriers for vaccination would have exponents xBen = 1 and xSev = xSus = xBar = 0, with a probability of vaccination of 0.399 as shown in Equation 2. Individual heterogeneity could be incorporated by allowing agents to sample their parameters from a distribution defined across the 95% confidence intervals for the odds ratios given in Table IV.
| (2) |
This approach can be extended to incorporate demographic heterogeneity at the individual agent level. Equation 3 shows the multivariate regression of crowd avoidance on the HBM plus gender and age, parameterized from Table V. In Equation 3 we have included those variables with odds ratios statistically different from 1; xGen = 1 corresponds to males, and xAge = 1 corresponds to > 65 years of age, in accordance with Table V. Equation 4 shows the probability of avoiding crowds for a male below the age of 65 who perceives the benefits of avoiding crowds to be high.
Table V.
Multivariate regressions of avoiding crowded places with variables of the HBM, age, and gender of respondents.
| Avoids crowded places – Moderately often, Frequently, or Very frequently (vs. Very infrequently or Infrequently) | OR (95% CI) | p-value | AIC 348.942 |
|---|---|---|---|
| Intercept (OR0) | 0.149 (0.0460, 0.485) | 0.00156 * | |
|
| |||
| Avoiding crowded places reduces my likelihood of contracting the swine flu. (Perceived Benefits) (ORben) | |||
| Strongly disagree, Disagree, or Neutral | 1.0 | ||
| Agree or Strongly agree | 3.90 (2.17, 7.03) | 5.64 * 10−6 * | |
|
| |||
| It is difficult to avoid crowded environments? (Perceived Barriers) (ORbar) | |||
| Strongly disagree or Disagree | 1.0 | ||
| Neutral, Agree, or Strongly agree | 0.778 (0.341, 1.78) | 0.551 | |
|
| |||
| If you were to catch the swine flu, how likely would you be to die as a result? (Perceived Severity) (ORsev) | |||
| Very unlikely or Unlikely | 1.0 | ||
| Moderately likely, Likely, or Very likely | 1.42 (0.744, 2.70) | 0.290 | |
|
| |||
| How likely do you think you are to contract the swine flu? (Perceived Susceptibility) (ORsus) | |||
| Very unlikely or Unlikely | 1.0 | ||
| Moderately likely, Likely, or Very likely | 1.54 (0.849, 2.78) | 0.156 | |
|
| |||
| Gender (ORgen) | |||
| Female | 1.0 | ||
| Male | 0.497 (0.277, 0.892) | 0.0191 * | |
|
| |||
| Age (ORage) | |||
| ≤ 65 | 1.0 | ||
| > 65 | 1.43 (1.04, 1.96) | 0.0262 * | |
p ≤ 0.05
| (3) |
| (4) |
4 Dynamic updating of HBM variables
To fully implement Equation 1 in dynamic computational simulations, the factors that influence the HBM variables must be quantitatively established. In Tables VI–IX we explore correlations between these factors and the HBM variables.
Table VI.
Variables correlated with two measures of the Perceived Severity of H1N1: (1) the likelihood of H1N1 infection being fatal, (2) the relative hardship caused by H1N1 compared to seasonal influenza.
| If you were to catch the swine flu, how likely would you be to die as a result? | If you were to catch the swine flu, what do you think the level of hardship would be relative to a regular cold or flu? | |
|---|---|---|
| Neutral, Likely, or Very likely (vs. Very unlikely or Unlikely) | Worse or Much worse (vs. Not as bad or Same) | |
| Odds Ratio (95% CI) | Odds Ratio (95% CI) | |
| How much news coverage of the swine flu have you seen in the past few weeks? | ||
| Very little or Some | 1 | |
| A lot | 2.4 (1.29, 4.37)** | NS |
|
| ||
| How would you classify the media’s coverage of the swine flu, in general? | ||
| Not reported at all, Underreported, or Fair | 1 | |
| Somewhat overblown or Very overblown | NS | 0.45 (0.26, 0.78)** |
|
| ||
| How prepared do you believe the government is for swine flu? | ||
| Not nearly enough, Adequate but could have done more, or Just right | 1 | |
| Too much or Completely overblown | NS | 0.30 (0.15, 0.58)*** |
|
| ||
| Do you personally know anybody who has fallen ill with swine flu, or suspects they may have it? | ||
| No | 1 | |
| Yes | 0.46 (0.24, 0.88)* | NS |
|
| ||
| Age | ||
| Under 50 | 1 | |
| 50 or over | 3.5 (1.5, 8.0)** | NS |
|
| ||
| Gender | ||
| Female | 1 | 1 |
| Male | 0.50 (0.25, 1.0)* | 0.48 (0.29, 0.81)** |
|
| ||
| Education | ||
| Some high school, High school, or Associate’s degree | 1 | |
| 4-year college degree or Higher | 0.21 (0.11, 0.43)*** | NS |
|
| ||
| If you were to catch the swine flu, how likely would you be to die as a result? | ||
| Very unlikely or Unlikely | 1 | |
| Moderately likely, Likely, or Very likely | 2.0 (1.0, 3.9)* | |
|
| ||
| If you were to catch the swine flu, what do you think the level of hardship would be relative to a regular cold or flu? | ||
| Not as bad or Same | 1 | |
| Worse or Much worse | 2.0 (1.0, 3.9)* | |
p < 0.05,
p < 0.01,
p < 0.001
4.1 Perceived Severity
The two measures of Perceived Severity in Table VI (perceived personal chance of death from H1N1 and anticipated hardship of H1N1 relative to seasonal flu) were unsurprisingly correlated with one another. Gender was strongly correlated with both variables, with males having relative odds of half that of females of reporting a high score on either of the severity variables.
A primary correlate of perceived lethality (Perceived Severity) of H1N1 was reported perception of media coverage. Respondents who reported observing more H1N1 coverage also reported a higher perceived likelihood of dying should they contract the disease. Although the direction of causality can be debated, this finding is entirely consistent with other research in risk perception (25–30) and suggests a mechanism (observed quantity of news coverage) from which perceived lethality might be modeled within a computational simulation (7,31).
4.2 Perceived Susceptibility
The determinants of Perceived Susceptibility are shown in Table VII. Younger respondents and those who believed they had contracted H1N1 were more likely to judge themselves to be at greater risk of contracting the disease. Men viewed themselves as less likely than women to contract the disease, a frequently-observed disparity in health questionnaires (12,15,25,32,33). Perceived Susceptibility to catching H1N1 was additionally influenced by level of media consumption, and was correlated with the general sense of whether the epidemic in the US was improving or worsening.
Table VII.
Variables correlated with Perceived Susceptibility to H1N1 : Odds ratios of believing oneself likely to contract H1N1 infection given the responses to other survey questions.
| How likely do you think you are to contract the swine flu? | |
|---|---|
| Neutral, Likely, or Very likely (vs. Very unlikely or Unlikely) | |
| Odds Ratio (95% CI) | |
| How much news coverage of the swine flu have you seen in the past few weeks? | |
| Very little or Some | 1 |
| A lot | 2.2 (1.3, 3.8)** |
|
| |
| Would you say the general state of the epidemic in the US is: | |
| Worsening | 1 |
| Improving | 0.22 (0.096, 0.48)*** |
|
| |
| Do you believe you have had the swine flu? | |
| No | 1 |
| Yes | 3.6 (1.2, 11)* |
|
| |
| Age | |
| Under 50 | 1 |
| 50 or over | 0.44 (0.25, 0.76)** |
|
| |
| Gender | |
| Female | 1 |
| Male | 0.53 (0.30, 0.95)* |
p ≤ 0.05,
p ≤ 0.01,
p ≤ 0.001
4.3 Perceived Benefits and Perceived Barriers
Perceived Benefits and Perceived Barriers of vaccination were negatively correlated with each other, suggesting that respondents confounded these variables (Table VIII). Both of these variables were correlated with opinion of the media coverage, and Perceived Benefits was correlated with opinion of government response. Male gender was not correlated with Perceived Benefits of vaccine, but was correlated with lower concern about vaccine side effects.
Table VIII.
Variables correlated with vaccine Perceived Benefits and Perceived Barriers at p ≤ 0.05
| How effective do you think a vaccine is in protecting you from catching the swine flu? | ||
|---|---|---|
| (Effective or Very effective) | ||
| Odds Ratio (95% CI) | p-value | |
| How concerned are you about potential side effects of a vaccine? | ||
| Not Concerned | 1 | 2.2 * 10−5 |
| Indifferent or Concerned | 0.34 (0.21, 0.56) | |
|
| ||
| How would you classify the media’s coverage of the swine flu, in general? | ||
| Not reported at all, Underreported, or Fair | 1 | 0.00017 |
| Somewhat overblown or Very overblown | 0.36 (0.21, 0.62) | |
|
| ||
| How prepared do you believe the government is for swine flu? | ||
| Not nearly enough, Adequate but could have done more, or Just right | 1 | 0.00065 |
| Too much or Completely overblown | 0.28 (0.14, 0.58) | |
| How concerned are you about potential side effects of a vaccine? | ||
|---|---|---|
| (Indifferent or Concerned) | ||
| Odds Ratio (95% CI) | p-value | |
| How effective do you think a vaccine is in protecting you from catching the swine flu? | ||
| Very ineffective, Ineffective, or Moderately ineffective | 1 | 2.2 * 10−5 |
| Effective or Very effective | 0.34 (0.21, 0.56) | |
|
| ||
| How would you classify the media’s coverage of the swine flu, in general? | ||
| Not nearly enough, Adequate but could have done more, or Just right | 1 | 0.032 |
| Too much or Completely overblown | 2.2 (1.1, 4.4) | |
|
| ||
| Gender | ||
| Female | 1 | 0.029 |
| Male | 0.57 (0.35, 0.94) | |
Perceived Benefits of avoiding crowded places, shown in Table IX, was correlated only with believing oneself susceptible to the disease. This reveals a fundamental colinearity among the factors of the Health Belief Model: the Perceived Benefits of a behavior such as avoiding crowded places are intrinsically dependent on the perceived likelihood of contracting the disease (Perceived Susceptibility); there is no benefit to the behavior if there is no risk of disease. Perceived difficulty of avoiding crowded places was correlated only with level of education, with those of a higher educational background reporting increased difficulty.
4.4 Candidate drivers of the HBM variables
Table X summarizes key insights gained through this survey about possible situational influences upon individual beliefs of the HBM. Although causal connections can’t be established between these factors and variables on the basis of our survey results, they represent plausible candidates for further research into the drivers of the Health Belief Model.
Table X.
Possible drivers for updating HBM variables during a simulation. Drivers that were observed to change over the course of the outbreak (Table II) are indicated by a *.
| Variable | Candidate drivers for HBM |
|---|---|
| (Benefits) Vaccine effectiveness | Opinion of the adequacy of media coverage |
| Opinion of the adequacy of government response | |
| (Barriers) Vaccine side effects | Opinion of the adequacy of media coverage |
| (Severity) Perceived likelihood of death following H1N1 contraction | Observed frequency of news coverage * Personally know anybody who has had H1N1 |
| (Severity) Perceived hardship of H1N1 relative to seasonal flu | Opinion of the adequacy of media coverage |
| Opinion of the adequacy of government response | |
| (Susceptibility) Perceived likelihood of contracting H1N1 | Observed frequency of news coverage * |
| Overall status of the epidemic in US * | |
| Individual believes they have had H1N1 |
5 DISCUSSION
The factors that cause the belief variables of the HBM to change states during an epidemic had not previously been studied. Our survey provides data in support of a variety of possible situational cues that could influence these variables. The survey framework used in this paper was tailored specifically to address the questions raised in computational behavior and epidemic modeling. Our comparison across survey periods in Table II revealed a significant decrease in Perceived Susceptibility of contracting H1N1 in the later months of the pandemic. Over this same period, the Perceived Severity of H1N1 and the Perceived Benefits and Perceived Barriers of both protective behaviors did not significantly change. We observed that Perceived Susceptibility fell during the waning epidemic, while the other variables appeared insensitive to the prevalence of disease. Although we cannot establish a robust relationship from our limited sample size, a comprehensive longitudinal survey measuring the variables discussed in this paper over the course of an epidemic would allow for significant insight to be gained into the dynamic response of these variables.
Our univariate regressions of the HBM variables against possible drivers (Tables VI – IX) revealed the utility of the various drivers. Table X summarizes these relationships, and indicates those candidate drivers that were observed in Table II to dynamically change over the course of the epidemic.
Our analysis identified certain weaknesses of the Health Belief Model in describing behavior during epidemic disease. Not all components of the HBM were correlated with participation in the specific health behaviors studied. Perceived Severity of H1N1 and concern about side effects (Barriers) were significantly correlated with vaccination both in our survey and in previous studies (34–37). Perceived Susceptibility was not significantly correlated with either vaccination or avoiding crowded places. Two core variables of the Health Belief Model for avoiding crowded places (Perceived Benefits and Perceived Susceptibility) were correlated with one another, as were Perceived Benefits and Perceived Barriers of vaccination. These findings cast doubt on the adequacy of the 4-variable incarnation of the HBM for describing behavioral response to epidemic disease.
There are several limitations to our study. We were unable to fully explore the influences of demographic covariates due to the small sample size and insufficient demographic heterogeneity. These population demographics may represent significant predictors of behavior and intention, as attitude and beliefs may be stratified along ethnic or socio-economic lines (20,35,38,39). We were not able to explore these influences in our study, but acknowledge their importance for representing agent heterogeneity in initial HBM variable settings. Additionally, all of our data were collected in the downward portion of the epidemic curve. Surveys covering an entire epidemic should provide additional insights.
For our survey we intentionally measured self-reported behavior and self-reported perceptions. We acknowledge the possibility of bias and error arising from these responses, either from subjective assessments of beliefs or from varying interpretations of our questions(40,41). Nevertheless, our approach remains useful for parameterizing computational behavior models, as it provides direct correlations between modelable external factors and beliefs/behavior. For example, a modeler might first define an objective quantity of media coverage, and then give each individual agent in the model a subjective level of coverage, possibly influenced by demographic parameters. This subjective level of coverage would in turn influence individual behavior (7).
An approach to modeling behavior during an epidemic that we did not explore in this research is to drive behavior by individual fear or by imitation dynamics. Studies conducted during H1N1 and SARS documented the importance of fear and emotion in driving epidemics (20,23,32). Theoretical and modeling research has demonstrated the dynamic effect that imitation dynamics can have in driving group behavior (42,43).
Another possible approach to modeling behavior from Survey data, removing the intermediary Health Belief Model and searching for direct correlations between drivers and behavior, might provide stronger relationships between the drivers and behavior at the expense of a well-structured theoretical foundation. Here and in our previous work (7) we narrowly framed behavior change within the Health Belief Model to provide a well-structured starting point for a comprehensive computational model of behavior change.
Supplementary Material
Acknowledgments
We thank Benoit Morel and Joshua Epstein for comments and feedback. Funding was provided by the NSF Graduate Research Fellowship Program, by the University of Pittsburgh School of Public Health, and by the NIH grant U54GM088491, Computational Models of Infectious Disease Threats. Survey data collection was supported by Public Health Adaptive Systems Studies Cooperative Agreement #1P01TP000304-01.
Contributor Information
David P. Durham, Email: ddurham@alumni.cmu.edu.
Elizabeth A. Casman, Email: casman@andrew.cmu.edu.
Steven M. Albert, Email: smalbert@pitt.edu.
References
- 1.Cowling BJ, et al. Facemasks and hand hygiene to prevent influenza transmission in households. Annals of Internal Medicine. 2009;151(7):437–446. doi: 10.7326/0003-4819-151-7-200910060-00142. [DOI] [PubMed] [Google Scholar]
- 2.Bell D, Nicoll A, Fukuda K, Horby P, Monto A, World Health Organization Writing Group Nonpharmaceutical interventions for pandemic influenza, international measures. Emerging Infectious Diseases. 2006;12(1):81–87. doi: 10.3201/eid1201.051370. [DOI] [PMC free article] [PubMed] [Google Scholar]
- 3.Lau JTF, Tsui H, Lau M, Yang XL. SARS transmission, risk factors, and prevention in Hong Kong. Emerging Infectious Diseases. 2004;10(4):587–592. doi: 10.3201/eid1004.030628. [DOI] [PMC free article] [PubMed] [Google Scholar]
- 4.Grayson ML, Melvani S, Druce J, Barr IJ, Ballard SA, Johnson PDR, Mastorakos T, Birch C. Efficacy of soap and water and alcohol-based hand-rub preparations against live H1N1 influenza virus on the hands of human volunteers. Clinical Infectious Diseases. 2009;48(3):285–291. doi: 10.1086/595845. [DOI] [PubMed] [Google Scholar]
- 5.Ferguson N. Capturing human behaviour. Nature. 2007;446(7137):733. doi: 10.1038/446733a. [DOI] [PubMed] [Google Scholar]
- 6.Funk S, Salathé M, Jansen VAA. Modelling the influence of human behaviour on the spread of infectious diseases: a review. Journal of the Royal Society Interface. 2010;7(50):1247–1256. doi: 10.1098/rsif.2010.0142. [DOI] [PMC free article] [PubMed] [Google Scholar]
- 7.Durham DP, Casman EA. Incorporating individual health-protective decisions into disease transmission models: a mathematical framework. Journal of the Royal Society Interface. 2012;9(68):562–570. doi: 10.1098/rsif.2011.0325. [DOI] [PMC free article] [PubMed] [Google Scholar]
- 8.Glanz K, Rimer BK, Viswanath K, editors. Health Behavior and Health Education: Theory, Research, and Practice. San Francisco: John Wiley & Sons; 2008. [Google Scholar]
- 9.Rosenstock IM. The Health Belief Model and preventive health behavior. Health Education Monographs. 1974;2:354–386. [Google Scholar]
- 10.Champion VL, Skinner CS. The Health Belief Model. In: Glanz K, editor. Health Behavior and Health Education: Theory, Research, and Practice. San Francisco: John Wiley & Sons; 2008. pp. 45–62. [Google Scholar]
- 11.Glanz K, Bishop DB. The role of behavioral science theory in development and implementation of public health interventions. Annual Review of Public Health. 2010;31:399–418. doi: 10.1146/annurev.publhealth.012809.103604. [DOI] [PubMed] [Google Scholar]
- 12.Tang CSK, Wong CY. Factors influencing the wearing of facemasks to prevent the Severe Acute Respiratory Syndrome among adult Chinese in Hong Kong. Preventive Medicine. 2004;39(6):1187–1193. doi: 10.1016/j.ypmed.2004.04.032. [DOI] [PMC free article] [PubMed] [Google Scholar]
- 13.Tang CSK, Wong CY. An outbreak of the Severe Acute Respiratory Syndrome: predictors of health behaviors and effect of community prevention measures in Hong Kong, China. American Journal of Public Health. 2003;93(11):1887–1888. doi: 10.2105/ajph.93.11.1887. [DOI] [PMC free article] [PubMed] [Google Scholar]
- 14.Lau JTF, Yang X, Tsui H, Kim JH. Monitoring community responses to the SARS epidemic in Hong Kong: from day 10 to day 62. Journal of Epidemiology and Community Health. 2003;57(11):864–870. doi: 10.1136/jech.57.11.864. [DOI] [PMC free article] [PubMed] [Google Scholar]
- 15.Lau JTF, Yang XL, Tsui HY, Pang E. SARS related preventive and risk behaviours practiced by Hong Kong-mainland China cross border travellers during the outbreak of the SARS epidemic in Hong Kong. Journal of Epidemiology and Community Health. 2004;58(12):988–996. doi: 10.1136/jech.2003.017483. [DOI] [PMC free article] [PubMed] [Google Scholar]
- 16.Lau JTF, Yang XL, Tsui HY, Pang E, Kim JH. SARS preventive and risk behaviours of Hong Kong air travellers. Epidemiology and Infection. 2004;132(4):727–736. doi: 10.1017/s0950268804002225. [DOI] [PMC free article] [PubMed] [Google Scholar]
- 17.Lau JTF, Yeung NCY, Choi KC, Cheng MYM, Tsui HY, Griffiths S. Acceptability of A/H1N1 vaccination during pandemic phase of influenza A/H1N1 in Hong Kong: population based cross sectional survey. British Medical Journal. 2009;339(b4164) doi: 10.1136/bmj.b4164. [DOI] [PMC free article] [PubMed] [Google Scholar]
- 18.Lau JTF, Kim JH, Yang X, Tsui HY. Cross-sectional and longitudinal factors predicting influenza vaccination in Hong Kong Chinese elderly aged 65 and above. Journal of Infection. 2008;56(6):460–468. doi: 10.1016/j.jinf.2008.03.008. [DOI] [PubMed] [Google Scholar]
- 19.Brewer NT, Chapman GB, Gibbons FX, Gerrard M, McCaul KD. Metaanalysis of the relationship between risk perception and health behavior: the example of vaccination. Health Psychology. 2007;26(2):136–145. doi: 10.1037/0278-6133.26.2.136. [DOI] [PubMed] [Google Scholar]
- 20.Rubin GJ, Amlôt R, Page L, Wessely S. Public perceptions, anxiety, and behaviour change in relation to the swine flu outbreak: cross sectional telephone survey. British Medical Journal. 2009:339. doi: 10.1136/bmj.b2651. [DOI] [PMC free article] [PubMed] [Google Scholar]
- 21.Leung GM, Ho LM, Chan SKK, Ho SY, Bacon-Shone J, Choy RYL, Hedley AJ, Lam TH, Fielding R. Longitudinal assessment of community psychobehavioral responses during and after the 2003 outbreak of Severe Acute Respiratory Syndrome in Hong Kong. Clinical Infectious Diseases. 2005;40(12):1713–1720. doi: 10.1086/429923. [DOI] [PubMed] [Google Scholar]
- 22.Quinn SC, Kumar S, Freimuth VS, Kidwell K, Musa D. Public willingness to take a vaccine or drug under emergency use authorization during the 2009 H1N1 pandemic. Biosecurity and Bioterrorism: Biodefense Strategy, Practice, and Science. 2009;7(3):275–290. doi: 10.1089/bsp.2009.0041. [DOI] [PMC free article] [PubMed] [Google Scholar]
- 23.Rubin GJ, Potts HWW, Michie S. The impact of communications about swine flu (influenza A HINlv) on public responses to the outbreak: results from 36 national telephone surveys in the UK. Health Technol Assess. 2010;14(34):183–266. doi: 10.3310/hta14340-03. [DOI] [PubMed] [Google Scholar]
- 24.Center for Disease Control and Prevention. Updated CDC Estimates of 2009 H1N1 Influenza Cases, Hospitalizations and Deaths in the United States, April 2009 – April 10, 2010. Available at: http://www.cdc.gov/hlnlflu/estimates_2009_hlnl.htm/, Accessed on March 19, 2012.
- 25.Jones JH, Salathé M. Early assessment of anxiety and behavioral response to Novel Swine-Origin Influenza A(H1N1) PLoS ONE. 2009;4(12) doi: 10.1371/journal.pone.0008032. [DOI] [PMC free article] [PubMed] [Google Scholar]
- 26.Loewenstein G, Mather J. Dynamic processes in risk perception. Journal of Risk and Uncertainty. 1990;3(2):155–175. [Google Scholar]
- 27.Young ME, Norman GR, Humphreys KR. Medicine in the popular press: the influence of the media on perceptions of disease. PLoS ONE. 2008;3(10) doi: 10.1371/journal.pone.0003552. [DOI] [PMC free article] [PubMed] [Google Scholar]
- 28.Combs B, Slovic P. Newspaper coverage of causes of death. Journalism Quarterly. 1979;56(4):837–843. [Google Scholar]
- 29.den Bulck JV, Custers K. Television exposure is related to fear of avian flu, an Ecological Study across 23 member states of the European Union. European Journal of Public Health. 2009;19(4):370–374. doi: 10.1093/eurpub/ckp061. [DOI] [PMC free article] [PubMed] [Google Scholar]
- 30.Wahlberg A, Sjoberg L. Risk perception and the media. Journal of Risk Research. 2000;3(1):31–50. [Google Scholar]
- 31.Wei JC, Zhao DT, Liang L. Estimating the growth models of news stories on disasters. Journal of the American Society for Information Science and Technology. 2009;60(9):1741–1755. [Google Scholar]
- 32.Leung GM, Quah S, Ho LM, Ho SY, Hedley AJ, Lee HP, Lam TH. A tale of two cities: community psychobehavioral surveillance and related impact on outbreak control in Hong Kong and Singapore during the Severe Acute Respiratory Syndrome epidemic. Infection Control and Hospital Epidemiology. 2004;25(12):1033–1041. doi: 10.1086/502340. [DOI] [PubMed] [Google Scholar]
- 33.Leung GM. The impact of community psychological responses on outbreak control for Severe Acute Respiratory Syndrome in Hong Kong. Journal of Epidemiology and Community Health. 2003;57(12):857–863. doi: 10.1136/jech.57.11.857. [DOI] [PMC free article] [PubMed] [Google Scholar]
- 34.Chapman GB, Coups EJ. Predictors of influenza vaccine acceptance among healthy adults. Preventive Medicine. 1999;29(4):249–262. doi: 10.1006/pmed.1999.0535. [DOI] [PubMed] [Google Scholar]
- 35.Armstrong K, Berlin M, Schwartz JS, Propert K, Ubel PA. Barriers to influenza immunization in a low-income urban population. American Journal of Preventive Medicine. 2001;20(1):21–25. doi: 10.1016/s0749-3797(00)00263-4. [DOI] [PubMed] [Google Scholar]
- 36.Chor JSY, Ngai KLK, Goggins WB, Wong MCS, Wong SYS, Lee N, Leung TF, Rainer TH, Griffiths S, Chan PKS. Willingness of Hong Kong healthcare workers to accept pre-pandemic influenza vaccination at different WHO alert levels: two questionnaire surveys. British Medical Journal. 2009;339(b3391) doi: 10.1136/bmj.b3391. [DOI] [PMC free article] [PubMed] [Google Scholar]
- 37.Rehmet S, Ammon A, Pfaff G, Bocter N, Petersen LR. Cross-sectional study on influenza vaccination, Germany, 1999–2000. Emerging Infectious Diseases. 2002;8(12):1442–1447. doi: 10.3201/eid0812.010497. [DOI] [PMC free article] [PubMed] [Google Scholar]
- 38.Harris KM, Maurer J, Lurie N. Is getting influenza vaccine coverage data out during mid-season feasible? Evidence from a national survey of US adults Vaccine. 2009;27(28):3697–3699. doi: 10.1016/j.vaccine.2009.04.007. [DOI] [PubMed] [Google Scholar]
- 39.Rajakumar K, Thomas S, Musa D, Almario D, Garza M. Racial differences in parents’ distrust of medicine and research. Archives of Pediatrics & Adolescent Medicine. 2009;163(2):108–114. doi: 10.1001/archpediatrics.2008.521. [DOI] [PMC free article] [PubMed] [Google Scholar]
- 40.Lichtenstein S, Slovic PF, Fischoff B. Facts versus fears: understanding perceived risk. Chapter 33. In: Kahneman D, editor. Judgment Under Uncertainty: Heuristics and Biases. Cambridge: Cambridge University Press; 1982. pp. 463–492. [Google Scholar]
- 41.Weinstein ND. Misleading tests of health behavior theories. Annals of Behavioral Medicine. 2007;33(1):1–10. doi: 10.1207/s15324796abm3301_1. [DOI] [PubMed] [Google Scholar]
- 42.Epstein JM, Parker J, Cummings D, Hammond RA. Coupled contagion dynamics of fear and disease: mathematical and computational explorations. PLoS ONE. 3(12):2008. doi: 10.1371/journal.pone.0003955. [DOI] [PMC free article] [PubMed] [Google Scholar]
- 43.Coelho FC, Codeço CT. Dynamic modeling of vaccinating behavior as a function of individual beliefs. PLoS Computational Biology. 2008;5(7) doi: 10.1371/journal.pcbi.1000425. [DOI] [PMC free article] [PubMed] [Google Scholar]
Associated Data
This section collects any data citations, data availability statements, or supplementary materials included in this article.