

Abstract
Background
Myocardial strain is a sensitive measure of ventricular systolic function. Two-dimensional speckle-tracking echocardiography (2DSE) is an angle-independent method for strain measurement but has not been validated in pediatric subjects. We evaluated the accuracy and reproducibility of 2DSE-measured strain against reference tagged MRI-measured strain in pediatric subjects with normal hearts and those with single ventricle (SV) of left ventricle (LV) morphology s/p Fontan procedure.
Methods
Peak systolic circumferential (CS) and longitudinal (LS) strains in segments (n = 16) of LVs in age and BSA matched 20 healthy and 12 pediatric subjects with tricuspid atresia s/p Fontan procedure were measured by 2DSE and tagged MRI. Average (global) and regional segmental strains measured by two methods were compared using Spearman and Bland-Altman analyses.
Results
2DSE and tagged MRI measured global strains demonstrated close agreements, which were better for LS than CS and in normal LVs than in SVs (95% limits of agreement: +0.0% to +3.12%, −2.48 % to +1.08%, −4.6% to +1.8% and −3.6% to +1.8% respectively). There was variability in agreement between regional strains with wider limits in apical than in basal regions in normal LVs and heterogeneous in SVs. The strain values were significantly (p < 0.05) higher in normal LVs than in SVs except for basal LSs, which were similar in both cohorts. The regional strains in normal LVs demonstrated an apico-basal magnitude gradient whereas SVs showed heterogeneity. The reproducibility was the most robust for images obtained with frame rates between 60 and 90 frame/sec; global LS in both cohorts; and basal strains in normal LVs.
Conclusions
2DSE-measured strains agree with MRI-measured strain globally but vary regionally particularly in SVs. Global strain may be more robust tool for the cardiac function evaluation than regional strain in SV physiology. The reliability of 2DSE measured strain is affected by the frame rate, nature of strain, and ventricular geometry.
Keywords: Myocardial Strain, Single Ventricle, Fontan procedure, Left Ventricle
Strain, a dimensionless measure of myocardial deformation, provides quantitative evaluation of ventricular global and regional function. Strain rate, a time derivative of strain, has been shown to correlate linearly with left ventricular (LV) peak elastance, which is a load-independent global measure of ventricular systolic function.1 Both strains and strain rates are less affected by tethering, translational artifacts, and traction and are considered to be more sensitive measures of ventricular function than Doppler measurements of myocardial velocities. Tagged magnetic resonance imaging (MRI) of the heart has been used as the standard method to evaluate myocardial strain and strain rate.2–4 However, the time and labor intensive nature of the tagged MRI method precludes its routine use in clinical pediatric practice.5 A novel echocardiographic method of measurement of myocardial strain in two dimensions determines myocardial deformation from continuous frame-by-frame tracking of speckles.5,6 Speckle within the B-mode images of myocardium results from ultrasonic back scattering from structures smaller than the inherent spatial resolution of the echocardiographic imaging system. The appearance of these “natural acoustic markers” is considered to be relatively stable between subsequent image frames, hence a change in their position follows tissue motion.6 A currently available two-dimensional strain echocardiography (2DSE) (GE Vingmed, Horten, Norway) tracks speckles in a larger number of small regions to measure their motion and compute both global and regional myocardial strains.7,8 Different speckle tracking methods have been also applied in other available 2DSE, but their systematic validation studies in pediatric population are lacking. Systematic validation of 2DSE in pediatric population with congenital heart defects and cardiomyopathy may be particularly pertinent because they have heterogeneity of the myocardial fiber orientation and electrical activation sequence,9,10 which determine the magnitude and distribution of strain,11,12 and can affect regional myocardial backscatter properties, hence speckle pattern.13,14 Furthermore, speckle tracking is partially dependent on frame rate. At present, there is no optimal frame rate for B mode image acquisition for speckle tracking discerned in pediatric age group. A systematic validation of the accuracy and reproducibility of 2DSE in pediatric subjects with normal hearts and with congenital heart defects should be a necessary prerequisite to their use in evaluating pathologic changes in cardiac function in this age group. The aim of this clinical study was to validate the accuracy and reproducibility of 2DSE-measured longitudinal and circumferential systolic strain by comparison with tagged MRI measured strain in a cohort of children and adolescents with normal hearts and those with complex congenital heart defects s/p Fontan procedure.
METHODS
Study Population
A prospective study was undertaken in pediatric cohort of 22 children and adolescents with normal cardiovascular evaluation and 15 children and adolescents with single ventricle (SV) physiology s/p Fontan procedure at St. Louis Children’s Hospital. The children and adolescents representing the normal heart cohort were initially referred by primary care physicians and pediatric cardiologists to have echocardiographic evaluation of a heart murmur, chest pain, or syncope. They were included in the study if they had normal structure and function of the heart on transthoracic echocardiogram. To ensure a homogeneous cohort of subjects with single ventricle physiology and the similarity of their dominant ventricle to the left ventricle (LV) of normal heart, the consecutive subjects with tricuspid atresia s/p Fontan procedure, who were attending outpatient cardiology clinics were identified and included in the study as they had systemic ventricle of LV morphology, which has anatomic and electrical activation sequence similarity to the LV of normal heart.15 In both cohorts, subjects were included in the study if they had normal blood pressure, sinus rhythm, and body mass index (weight in kg. /height in meter2) between the 5th and 85th percentiles) for age and gender. Subjects with contra-indications for MRI (subjects with ferromagnetic metallic devices or with claustrophobia) were excluded. Both the 2DSE and MRI studies of an individual subject were performed within 2 hours of each other, in resting state, and without sedation. The study protocol was approved by the institutional review board of Washington University.
Echocardiographic Evaluation of Myocardial Strain
A standard 2D and spectral/color flow Doppler examination was performed with a commercially available ultrasound imaging system (Vivid 7, GE Medical Systems, Milwaukee, Wis) according to the methods recommended by American Society of Echocardiography.16 Longitudinal strain (LS) was assessed in standard 4-chamber, 3-chamber (apical long axis), and 2-chamber apical views. Circumferential strain (CS) was measured from standard parasternal short-axis images acquired at the apical (no visible papillary muscles), midventricular (at the papillary muscles level), and basal (at the level of mitral valve) levels. The images were obtained at end-expiratory phase utilizing 4 MHz center frequency phased-array probe using second harmonic imaging. The settings were configured to obtain optimum quality images. Frame rate for these studies was kept between 60 and 90 frames/s. They were stored in cineloop format for offline analysis by vendor customized software (EchoPAC PC–2D strain, GE Healthcare, Milwaukee, Wis). The LS and CS were measured in 16 LV segments7 by tracing the endocardial contour on an end-systolic frame that allowed the software to automatically place the contour on subsequent frames by temporally tracking the “natural acoustic speckle” in the B-mode images. Full thickness of myocardium from endocardial to epicardial borders was covered. Adequate tracking for the study was verified in real-time and in segments with poor tracking, the endocardial trace line was readjusted until a better tracking score was achieved. A suboptimally tracked segment was excluded from further analysis (Figure 1). Longitudinal and circumferential strain curves reflected the average value of all of the acoustic markers in each segment. Studies were repeated at 2 different ranges of frame rates: 30–60 frames/sec and 90–120 frames/sec in half of the (randomly selected) healthy subjects and in all the subjects with tricuspid atresia s/p Fontan procedure to evaluate the effect of frame rate on the accuracy of 2DSE measured systolic strain.
Figure 1.

Apical four-chamber view showing longitudinal systolic strain curves with different colors depicting the different myocardial segments and numerical values in table in (top) left ventricle of a normal subject and (bottom) single left ventricle of tricuspid atresia s/p Fontan procedure subject.
MRI Evaluation of Myocardial Strain, Ventricular Volumetric and Functional Indices
Tagged MRI
Tagged MR imaging was performed with 1.5 Tesla MR scanner (Magnetom Vision; Siemens Medical Systems, Iselin, New Jersey) using phased-array cardiac coil by methods previously reported by us.17 Briefly, applying an electrocardiogram-triggered SPAMM (Spatial Modulation of Magnetization) cine fast gradient-echo sequence (TR 58 ms/TE 2.8 ms; FA 30°, acquisition matrix 256×256) 5 to 8 contiguous stacks of short-axis images were prescribed from base to apex, and four long-axis slices were prescribed radially every 45°.4 The images were acquired during breath holds at end-expiration at 29-ms intervals until the completion of the entire cardiac cycle at each imaging plane.
Ventricular Volumes
Cine bright-blood retrogated steady-state precession images (TR 3.1 ms/TE1.5 ms; flip angle 70 degrees) in short axis were acquired with 6 mm contiguous slices from base to the apex of the heart. Endocardial borders of all end-diastolic and end-systolic phases of the cardiac cycles were traced on a standard workstation and the Simpson method was applied to calculate end-diastolic volume (EDV) and end-systolic volume (ESV) of the left ventricle. They were standardized against the body surface area. The ejection fraction (EF) of the left ventricle was calculated as the percentage ratio of (EDV−ESV)/EDV.
Strain Analysis by Finite Element Model Construction
Five to eight short-axis image sets and four radially oriented long-axis image sets were analyzed using custom-designed analysis software developed in our laboratory. An initial spline representation of the tag lines on the end-diastolic images was constructed and located on successive images using a computer-based, automated algorithm based on a method reported by McVeigh and Zerhouni.18 Spline curves from corresponding tag lines were used to construct a spline surface representation of the tag surfaces. Three-dimensional systolic displacements were computed along the intersection curves of individual short- and long-axis tag surfaces using a previously described and validated method.19 Analysis of the displacement data was carried out using the finite element software package, StressCheck (ESRD, St. Louis, Missouri). Predicted displacements at any point within the domain of the model were obtained from a least squares fitting of the measured displacement data using the finite element basis functions.20 The regional LS and CS values were computed from the results of this fitting in 16 LV segments corresponding to segments for which strain were measured by 2DSE. For consistency in temporal analysis, the time sequence was normalized to the end-systole in all modalities. End-systole was determined as the point of time corresponding to the end of T-wave on ECG during the echocardiography examinations and from the smallest cavity observed in the MRI studies.
The precision of measurements of strain components is important to quantify in order to assess measurement variability. We (and others) have previously estimated precision on the basis of the smoothness of strain measurements among consecutive time frames, because the computed strain at each time frame was an independent measurement.3,19 This temporal variability was quantified by taking the root mean squared deviation of the sequential strain measurement about a cubic fit of strain versus time and expressing it as a percentage of maximal value of the fitted curve. This variability measurement was averaged among all hearts. The results of our study had shown that the precision of relative magnitude of the 3-D displacement reconstruction averaged 0.087 +/− 0.002 mm or 2.4 +/− 0.1% of the of the maximum value.19
Statistics
The data were analyzed using statistical software (SPSS version 14.0, SPSS, Inc., Chicago, IL). All values were expressed as mean ± SD. The relationship between the strains measured by two methods was evaluated with linear regression. The agreement between MRI and 2DSE strain measurements was evaluated by Bland-Altman analysis by calculating the bias (mean difference) and the 95% limits of agreement (two SD around the mean difference). The statistical significance of a correlation, r, measured the possibility that r=0. The significance of the biases and differences in myocardial strain, and ventricular ejection fraction were tested by 2-tailed paired t-test. Values of p <0.05 were considered significant.
Interobserver and intraobserver variabilities in strain measurements by the 2DSE method were determined by measurements of LV strain by a second observer and the same observer, respectively, in half of the (randomly selected) normal subjects and in all 12 subjects with tricuspid atresia s/p Fontan subjects and were analyzed by Bland-Altman method.
RESULTS
Demographic Information
Two out of 22 subjects with normal hearts and 3 out of 15 subjects s/p Fontan procedure were excluded from the study because of inadequate echocardiographic images for offline analysis. Subject demographics and hemodynamics are presented in Table 1. Subjects with normal hearts and those s/p Fontan procedure were anthropometrically matched except for gender. The subjects with tricuspid atresia had normally related great arteries in 9 (7 with intact septum and 2 with small muscular ventricular septal defect) and d-transposition of great arteries with paramembranous ventricular septal defect in 3. They had the Fontan procedure (cavo-pulmonary shunt through lateral tunnel in 7 and extracardiac conduit in 5) a mean of 11.7 years prior to the study. They were in New York Heart Association class I (N = 9, median age 13) or class II (N = 3, median age 16). None had cardiac arrhythmias. Hemodynamics were similar between the groups at rest.
Table 1.
Demographics and Hemodynamics of Subjects with Normal Heart and with Single Ventricle (Tricuspid Atresia) s/p Fontan Procedure
| Subjects | Total # | Age (yrs) | M/F | BSA (M2) | HR (bpm) | BP(mmHg) | O2Sat (%) | Rhythm/QR | EF (%) |
|---|---|---|---|---|---|---|---|---|---|
| mean (range) | mean (range) | Mean (range) | Range | Mean (range) | S duration(ms) | ||||
| Normal | 20 | 12.9 (9–17) | 9/11 | 1.22 (1.12 –1.62) | 75 (60 – 104) | 92–110/ 55–68 | 99 (98–100) | NSR/92±5 | 63±2 |
| SV, S/P Fontan | 12 | 14.2 (12–17) | 7/4 | 1.27 (1.14 –1.69) | 85 (72–110) | 98–121/ 60–78 | 94 (91–97) | NSR/102±11 | 55±7 |
BSA, body surface area; BP, blood pressure; EF, ejection fraction; F, female; HR, heart rate; M, male; NSR, normal sinus rhythm; SV, single ventricle of left ventricle morphology.
There were no significant changes in hemodynamics (heart rate, blood pressure and oxygen saturations) between image acquisitions by the two modalities. Eleven out of 320 segments (all apical, 3.4%) in subjects with normal hearts and 17 out of 192 segments (14 apical and 3 mid, 8.9 %) in subjects S/p Fontan procedure were excluded from analysis because of suboptimal echocardiographic images due to reverberations and image drop-outs. Thus, of those included in the study it was feasible to fully analyze 96.6% of the segments of the LVs in normal hearts and 91.1% of segments of the single ventricles in subjects s/p Fontan procedures. A total of 484 out of 512 segmental strain data (94.5 %) measured by 2DSE in both cohorts entered in the analyses. After excluding 20 segments due to inadequate tagging (14 basal and 6 apical, 3.9%), a total of 492 out of 512 segmental strain data (96 %) measured by MRI in both cohorts entered in the analyses.
Validation of Myocardial Strain Measurements by 2DSE in Subjects with Normal Hearts
Strain measurements from 16 segments were averaged to assess a ventricular global parameter. The average of LS and CS values (global strain) measured by 2DSE in all cardiac segments correlated closely (r 0.99, p < 0.001 for both, Table 2) with corresponding strain values measured by MRI (Figure 2a and 2b). Figure 3 shows the results of Bland-Altman analysis of the average values of both strains by the two methods. Bias represents the mean difference. A bias of 0% indicated complete agreement and difference of more than 1.5% strain was considered significant. Measurements of LS by 2DSE resulted in a small but significant overestimation relative to the MRI reference values as reflected by bias of +1.6% and agreement ranging from +0.0% to +3.12% with some measurements falling outside 95% limits of agreement (mean±2SD). The CS measured by 2DSE modestly underestimated circumferential strain values obtained by MRI as reflected by nonsignificant bias of −0.7%. However, compared to LS, the limits of agreement was wider, ranging from −2.48 % to +1.08%, and a significant number of measurements were outside 95% limits of agreement for CS. Thus, a better agreement between the two methods for global strain measurements was obtained for LS than CS.
Table 2.
Average (Global) and Regional Systolic Strains Measured by MRI and 2DSE in the Left Ventricle of Normal Subjects and Left Ventricle of Subjects with Tricuspid Atresia s/p Fontan Procedure
| Strain | LS (mean ±SD%) | CS (mean ±SD%) | ||||||
|---|---|---|---|---|---|---|---|---|
|
| ||||||||
| MRI | 2DSE | r | p-value | MRI | 2DSE | r | p-value | |
| Normal Left Ventricle | ||||||||
| NLV-Average | −17.1±1.4 | −17.7±1.5 | 0.99 | <0.0001 | −21.2±2.2 | −20.5±1.8 | 0.99 | <0.0001 |
| NLV-Basal | −15.1±2.5 | −16.3±3.3 | 0.85−0.99 | <0.0001 | −19.1±4.6 | −18.5±4.8 | 0.81−0.99 | <0.0001 |
| NLV-Mid | −17.5±2.9* | −17.9±2.6* | 0.97−0.98 | <0.0001 | −21.6±3.8* | −20.8±4.0* | 0.97−0.98 | <0.0001 |
| NLV-Apical | −18.8±2.6† | −19.4±3.3† | 0.97–0.98 | <0.0001 | −23.6±3.3† | −23.2±2.0† | 0.96–0.98 | <0.0001 |
|
| ||||||||
| Left Ventricle of Tricuspid Atresia s/p Fontan Procedure | ||||||||
| SV-Average | −15.7±3.2‡ | −14.2±3.3‡ | 0.93 | <0.001 | −18.7±4.5‡ | −17.5±4.4‡ | 0.94 | <0.001 |
| SV-Basal | −15.4±2.8 | −14.8±4.5 | 0.85–0.98 | 0.003 | −15.7±2.2 | −15.2±4.8 | 0.95–0.98 | <0.0001 |
| SV-Mid | −15.0±3.7§ | −13.6±4.7§ | 0.89–0.97 | 0.006 | −16.9±4.8§ | −15.5±5.2§ | 0.90–0.97 | 0.005 |
| SV-Apical | −14.9±2.1Ŧ | −13.8±6.5Ŧ | 0.84–0.95 | 0.001 | −15.3±5.6Ŧ | −16.2±5.9Ŧ | 0.87–0.95 | 0.005 |
CS, circumferential strain, LS, longitudinal strain; NLV, left ventricle in normal heart; SV, single ventricle of left ventricular morphology in tricuspid atresia;
p < 0.05 when mid regional strain compared with basal regional strain in the same group;
p < 0.05 when apical regional strain compared with mid regional strain in the same group;
p < 0.05 when average (global) strain in LV of normal heart compared with those in single ventricle;
p < 0.05 when mid regional strain in LV of normal heart compared with those in single ventricle;,
p < 0.05 when apical regional strain in LV of normal heart compared with those in single ventricle.
Figure 2.
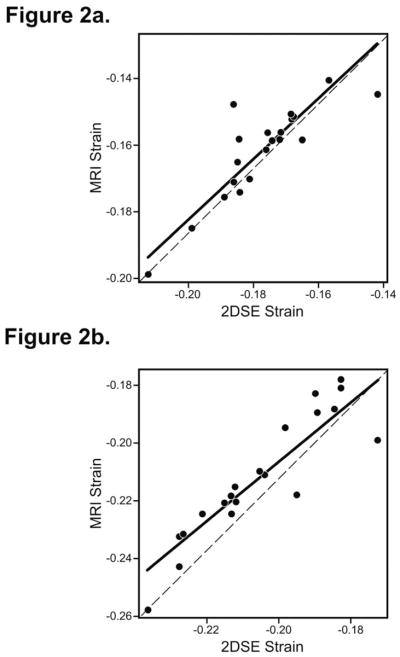
Linear regression plot showing the relation between (2a) longitudinal strain and (2b) circumferential strain by 2D speckle tracking echocardiography (2DSE) and tagged magnetic resonance imaging (MRI) in the left ventricle of normal subjects.
Figure 3.

Bland-Altman plot showing the agreement between tagged magnetic resonance imaging (MRI) and 2D speckle tracking echocardiography (2DSE) measured longitudinal strains (upper panel) and circumferential strains (lower panel) with the mean difference (dotted line) and 95% limits of agreement (solid lines) in all segments (global strain) (3a and 3d), basal regions (3b and 3e), and apical regions (3c and 3f) of the left ventricle of normal subjects. A better agreement for global longitudinal than circumferential strain and larger variability of bias with wider 95% limits of agreement for segmental strains in apical regions than basal regions are demonstrated.
Analysis of regional strains by linear regression showed close correlation between the methods for both longitudinal and circumferential strains (Table 2) in each of 6 segments of basal (n = 6×20, r from 0.81 to 0.99) and mid (n = 6×20, r from 0.97 to 0.98), and 4 apical (n = 4×20 minus 11 excluded segments, r from 0.96 to 0.98) regions (p < 0.001 for all regions). However, there was regional variation in agreement between the values of the measurements of strain by the two methods. Bland-Altman analysis revealed variability of bias was larger for strain in apical segments versus basal segments (2.06±2.72 % vs. +1.25±2.96 for apical vs. basal LS and −1.00±2.60 % vs. −0.60±3.13 for apical vs. basal CS, respectively) and 95% limits of agreement wider (+1.25±2.96 % for LS and −0.60±3.13 % for CS) (Figure 3). Compared to LS, a significant number of regional CS measurements fell outside 95% limits of agreement (Figure 3). Thus, a better agreement in the measured value of strain between the two methods was obtained for regional LS.
Validation of Myocardial Strain Measurements by 2DSE in Subjects with Single Left Ventricle of Tricuspid Atresia S/P Fontan Procedure
In subjects with single LV s/p Fontan procedure, average values of LS and CS (global strain) measured by 2DSE in all cardiac segments correlated closely (r 0.93 and 0.94 respectively, p < 0.001 for both) with MRI measured values (Table 2). However, Bland-Altman analysis of measurements of average strain of all cardiac segments revealed significant (p <0.05) underestimation by 2DSE compared with the MRI values of LS (bias −1.7%) and nonsignificant underestimation of CS (bias −0.9%) with a wide 95% limit of agreement for both (−4.6% to +1.8% and −3.6% to +1.8% respectively) (Figure 4).
Figure 4.

Bland-Altman plot showing the agreement between tagged magnetic resonance imaging (MRI) and 2D speckle tracking echocardiography (2DSE) measured longitudinal strains (upper panel) and circumferential strains (lower panel) with the mean difference (dotted line) and 95% limits of agreement (solid lines) in all segments (global strain) (4a and 4d), basal regions (4b and 4e), and apical regions (4c and 4f) of the single ventricle of left ventricle morphology in s/p Fontan procedure subjects. A negative bias for both global longitudinal and circumferential strains measured by 2DSE and close agreement between the two methods for only apical longitudinal and basal circumferential strains are revealed.
Analysis of regional strain by linear regression showed the correlations between 2DSE and MRI measured 2D strain in each of 6 segments of basal (n = 6×12, r from 0.85 to 0.98), mid (n = 6×12 minus 3 excluded segments, r from 0.87 to 0.97), and apical (n = 4×12 minus 14 excluded segments, r from 0.84 to 0.95) regions were close (p < 0.006 for all regions) (Table 2). However, Bland-Altman analysis of the regional strains measured by the two methods revealed close agreement only for apical segmental LS and basal segmental CS as reflected by small nonsignificant bias (−0.8% and +0.2 respectively) and tighter 95% limits of agreement (−0.45±0.96 % for LS and +0.50±2.21 % for CS) (Figure4). There were significantly (p <0.05) large variability of bias in mid and apical regions for both longitudinal (3.56% and −3.86% respectively) and circumferential (−2.01% and −2.66% respectively) strains with wider 95% limits of agreement (−8.15 to +2.27% and −6.54 to +3.15% respectively) (Figure 4). Compared to LS, more measurements fell outside 95% limits of agreement for CS. Thus, the best agreement between the two methods was obtained in basal longitudinal strain measurements. Overall, 2DSE measured strains underestimated the values obtained by MRI.
Comparison of Morphology and Function between the Normal Left Ventricle and Single Left Ventricle of S/P Fontan Procedure
Subjects with a normal heart had LV EDV-indexed (ml/BSA) 77 +/− 12 ml/m2, LV ESD-indexed 29 +/− 10 ml/m2, stroke volume 48 +/− 5 ml/m2, and ejection fraction of 63±2%. Subjects with tricuspid atresia s/p Fontan procedure had single LV EDV-indexed 96+/− 14 ml/m2, LV ESD-indexed 45 +/− 9 ml/m2, stroke volume 52 +/− 7 ml/m2 and ejection fraction of 55±7%. Thus, volumetric indices were larger and ejection fractions were lower in single LVs than normal LVs but stroke volume indices were not significantly different (p = 0.15) between the two. The LVs of normal hearts were ellipsoidal in shape with minor axis to major axis ratio of 0.4 +/− 0.1, whereas the single LVs of S/p Fontan procedure exhibited spheroidal shape with minor axis to major axis ratio of 0.7 +/− 0.2. The global (average) LS and CS were significantly (p = 0.03) higher in normal LVs than in single LVs of s/p Fontan procedure by both methods of measurement (Table 2). The regional strains in normal LVs demonstrated a decremental apico-basal magnitude gradient for both LS and CS with the highest strains in apical regions (p <0.05 versus mid or basal regions) by both methods whereas single LV of s/p Fontan procedure showed heterogeneity with no apico-basal magnitude gradient. By tagged MRI method, the LS magnitude was the highest in basal regions and the CS magnitude in mid regions of single LVs of s/p Fontan procedure (Table 2). Regional strains measured by both methods were significantly (p < 0.05) higher in normal LVs than in single LVs of s/p Fontan procedure except for basal LSs, which were similar in both cohorts (Table 2).
Reproducibility of Strain Measurements by 2DSE
When echocardiographic images were obtained at frame rates of 60–90frames/sec, reproducibilities for global strains were better for the same observer than different observers in both normal LVs and single LVs of tricuspid atresia s/p Fontan procedure. The intra-observer variability was (bias ± 2SD [95% limit of agreement]) 1.9±3.9% for global LS and 3.5± 6.9% for global CS in LVs of normal LVs (Figure 5a and 5b). It was −2.4±8.5% for global LS and −3.0±8.7% for global CS in single LVs of s/p Fontan procedure (Figure 5c and Figure 5d). Inter-observer variability was 2.3 ±7.5% for global LS and 3.2±9.8% for global CS in normal LVs (Figure 6a and 6b). It was 3.6±12.8% for global LS and −3.9±12.2% for global CS in single LVs s/p Fontan procedure (Figure 6c and Figure 6d). The reproducibility for regional strains were variable and were the highest in basal segments (95% limit of agreement 11.1% –15.8%) and the lowest in the apical segments (95% limit of agreement 12.8% –17.6%) in both cohorts.
Figure 5.

Bland-Altman plot showing the intra-observer variabilities in agreement in 2DSE measured global longitudinal (5a and 5c) and circumferential (5b and 5d) strains in the left ventricles of normal subjects (upper panel) and in the single ventricles of left ventricle morphology in s/p Fontan procedure subjects (lower panel). The agreement is better for the global longitudinal than circumferential strains and for the global strain in normal left ventricles than in single ventricles.
Figure 6.

Bland-Altman plot showing the inter-observer variabilities in agreement in 2DSE measured global longitudinal (6a and 6c) and circumferential (6b and 6d) strains in the left ventricles of normal subjects (upper panel) and in the single ventricles of left ventricle morphology in s/p Fontan procedure subjects (lower panel). The agreement is better for the global longitudinal than circumferential strains in normal left ventricles and for the global circumferential than longitudinal strains in single ventricles.
When echocardiographic images were obtained at frame rates less than 60 frame/sec and greater than 90 frame/sec the inter- and intra-observer variabilities of global LS and CS in normal LVs and in single LVs of s/p Fontan procedure were higher (95% limit of agreement 15.5% – 22.4% for both) compared to when echocardiographic images were obtained at frame rates of 60–90 frame/sec.
DISCUSSION
The present study in children and adolescents with normal hearts demonstrated (1) a high accuracy in 2DSE measurements of strains in two dimensions with higher accuracy for the global longitudinal than circumferential strain and a trend of overestimation of the LS values and underestimation of CS values; and (2) a variability in accuracy of the 2DSE measurement of regional strains with less accuracy and greater bias in the segments of apical regions than in basal regions when compared with the tagged MRI measured values.
Compared to the children and adolescents with normal hearts, 2DSE in those with single LVs of tricuspid atresia s/p Fontan procedure demonstrated (1) a less accuracy for the measurement of global LS and CS with wider limits of agreement and a trend for underestimation of both; and (2) a heterogeneous variability in accuracy for the measurement of regional strains with only comparable accuracy and insignificant bias for LS in segments of apical regions and for CS in basal regions when compared with the tagged MRI measured values.
The reliability for strain measurements by 2DSE in children and adolescents with both normal hearts and single ventricles was high with better reproducibility when the image acquisitions were performed with frame rates between 60 and 90 frame/sec than less than 60 frame/sec and greater than 90frame/sec. With image acquisitions at 60 – 90 frame/sec, the reproducibility was better in normal hearts than in single ventricles and for global than regional strains.
The 2DSE showed higher feasibility of strain measurements in two dimensions in children and adolescents with normal hearts (96.6 %) than in those with single LVs of tricuspid atresia s/p Fontan procedure (91%).
Validation of Two-Dimensional Strain Measurement by Speckle-Tracking Echocardiography
The effect of cardiac growth on strain,21 as well as changing loading conditions and ventricular contractility during childhood,22 and myocardial fiber disarray seen in congenital heart diseases and cardiomyopathies can all affect myocardial strain. A validation of 2DSE measured strain, which has not been done hitherto in pediatric subjects with normal hearts and with congenital heart diseases, may be a necessary prerequisite for its use in evaluating pathologic changes in cardiac function in this age group. Since both 2DSE and tagged MRI measure Lagrangian strain values, we chose to compare 2DSE measurements of strain in LV with the tagged MR imaging using 29 msec temporal resolution and the greatest amount of tagging, which were insensitive to local variation in fiber angle due to its symmetry in the longitudinal-circumferential plane. An overall close correlation and agreement for 2DSE measured global strains was found with reference tagged MRI values, which was in agreement with studies in normal adults comparing LV peak systolic strain measured by 2DSE with those by tagged MRI.5,23 Except for global peak LS, both global peak CS and regional strains were underestimated by 2DSE compared with tagged MRI. This may be accounted for by the fact that in this study peak systolic strain, not peak strain during whole cardiac cycle was measured with echocardiography and by the difference in end-systolic timing between echocardiography and MRI due to relatively low temporal resolution (15–20 frames/s) of MRI, resulting in the discrepancy between the measurements as reported in previous studies in normal adults.23,24
A greater mean difference between strains measured by the two methods was found for global CS compared with global LS and for mid and apical compared with basal segments regional strains. Several explanations might be expounded for these discrepancies. The speckle patterns in echocardiographic images of heart is influenced by different backscattering waves originating from different fiber orientation.6 The anisotropic structure of the LV wall, with fiber directions changing from a right-handed helix in the subendocardium to a left-handed helix in the subepicardium around apex25 and circumferential in midregion may alter the propagation and backscatter of ultrasonic waves and potentially affect the measurements of CS.14,26,27 Further, prominent attenuation of backscatter near the apical region where the myofiber sheets are relatively parallel26 and near field artifacts such as drop outs and reverberations seen in apical echocardiographic 2D images may all impair tracking of the myocardial speckle pattern27 and account for regional differences in agreement between strains measured by two methods.
Less agreement between strain values measured by 2DSE and tagged MRI was observed in the single LVs of tricuspid atresia s/p Fontan procedure compared with those in the LVs of normal hearts. Similar to the LVs of normal hearts, the agreements between 2DSE and tagged MRI measured global strains were better than regional strains. A less accuracy in the measurement of regional strain by 2DSE in single ventricle might be related to the limitation posed by ventricular curvature from remdeling28 and myocardial archtecture9,30 in speckle tracking.31 Indeed, in our study cohort, the single LVs of tricuspid atresia s/p Fontan procedure were dilated and remodeled from normal ellipsoidal to spheroidal shape with altered major and minor axes. Further, the myoarchitectural study in tricuspid atresia has shown that in contrast to the normal LV, the middle layer in single LV in tricuspid atresia is thicker, the fibers are oriented circumferentially; and in both subepicardial and subendocardial layers the fibers are oblique to longitudinal.9 These characteristics of single LV are likely to alter the anisotropic properties of the myocardium, affect speckle tracking, and may account for the differences in strain values reported by the two methods. Amundsen et al. in a validation study involving adult subjects with coronary occlusive disease compared measured 2DSE strain values with tagged MRI values.5 They, too, found an overall accuracy of the 2DSE method with some variability, which they attributed mainly to misalignment of image planes and out-of-plane movement in 2DSE.5 Others have also found the distortion of the image planes from ventricular remodeling making it difficult to reproduce the same imaging planes between the two methods.32
Comparison between Strains and Ejection Fractions in Left Ventricle of Normal Subjects and Single Left Ventricle of Subjects S/P Fontan Procedure
The single LVs in comparison to normal LV had significantly decreased global systolic strain measured by both tagged MRI and 2DSE. Their regional strains did not have the apico-basal gradient pattern as observed in normal LVs. Although studies regarding the apex-to-base strain gradient in normal children and adolescents have not been reported hitherto; MRI and 2DSE studies in healthy adults have reported similar decreasing strain from apex-to-base due to decreased fiber and cross-fiber shortening from apex-to-base.3,28 Such regional contribution of the LV wall to the ejection of blood in the axial direction from the apex toward the base may be necessary to propel the blood from the LV cavity to the outlet during systole. In children and adolescents with single LVs of s/p Fontan procedure, the apex-to-base strain gradient was conspicuous by its absence and by the presence of regional heterogeneity of both LS and CS. In the only other reported study of myocardial strain in single ventricles s/p Fontan procedure by tagged MRI in children and young adults, Fogel et al noted a heterogeneity of CS and radial strain but no significant apex-to-base differences in magnitude in either strain was described, which may be a reflection of smaller sample size of their study.33
Although the ejection fraction in single LVs of s/p Fontan procedure were within normal range for age and similar to those reported by a multicenter study in a subjects with s/p Fontan procedure,34 it was decreased in comparison to those in normal LVs. However, larger size of single LVs increased the stroke volume to values similar to those of normal LVs and maintained a normal cardiac output at rest. Notwithstanding the normal cardiac output at rest, single ventricle hearts usually fail to augment ejection fraction and cardiac output as normal LVs during exercise. We speculate that the heterogeneity of deformation and abnormal remodeling of single ventricles, as seen in our study cohort of single LVs, contribute to decreased ejection fraction and its failure of normal augmentation during situations demanding increased cardiac output.
Reproducibility
The reproducibility of 2DSE measured strain was affected by the frame rate for B-mode image acquisition, global and regional nature of strain, and ventricular remodeling induced change in ventricular geometry. The reproducibility was the most robust for 1) images obtained with frame rates between 60 and 90 frames/sec; 2) the global LS; and 3) the basal regional LS and CS in normal LVs. The reproducibility was the least for apical regional strains in single LVs s/p Fontan procedure. The lower reproducibility at frame rates other than 60 – 90 frames/sec may have been induced by inaccuracy in timing of mechanical events. A too low frame rate relative to high heart rate seen in children and a too high frame rate relative to slow heart rate seen in adolescents may result in poor tracking and timing of mechanical. The prominent attenuation of backscatter from the circumferential myofibers, which are relatively parallel to the insonifying ultrasound beam in the septal and lateral regions of the parasternal short axis views26 may contribute to the lower reproducibility of CS than LS. This may be further aided by changes in ventricular shape resulting from cardiac remodeling.23 In addition, there might be other reasons for this observation that are more intrinsic to the way 2-D speckle tracking estimates regional deformation. The actual algorithm used by the vender (GE EchoPac system [GE Medical Systems], Milwaukee, Wis) is not known or published and it is unclear whether or not global cardiac size or morphology has an influence on the way regional differences are computed. This becomes an issue in pediatric heart disease where both size and geometry are important factors. Also, the pediatric heart is smaller with fewer speckles that can be tracked for each segment, possibly resulting in higher variability.
Limitations of the study
The relatively small study cohort may make generalization of the inference of this study less compelling but may provide a basis for larger study. Misalignment of image planes and segment boarders between MRI tagging and 2DSE, differences in technique in strain computation between 3-D MRI tagging and 2-D speckle tracking methods, and out-of-plane movement in 2DSE5 could all have contributed to the observed discrepancy in agreement between the strain values by two methods and induced bias against 2DSE as less sensitive method for strain imaging. We did not undertake reproducibility test for the tagged MRI method of strain measurement. However, we and others have previously evaluated the precision of tagged MRI measurements of strain components to assess measurement variability and found a very high precision (~2%) value. For this reason, tagged MRI has been used as the standard method for strain measurement and previously to validate strain measurements by echocardiography in adults.5
Conclusions and Clinical Implications
The overall validation of 2DSE method for strain measurements in our study indicates its potential as a clinical tool for quantifying myocardial strain in children and adolescents. However, regional variation in accuracy, the effect of structural anisotropy and cardiac remodeling, and frame rate, which should be kept between 60 and 90 per second during image acquisition, on speckle tracking should be taken in account during its application in pediatric subjects. The spatial heterogeneity and variation in accuracy of regional strain particularly seen in the single LVs in this study suggests that 2DSE measured global strain parameter is more sensitive than regional strain parameter for evaluating ventricular systolic function and can be reliably used to quantify myocardial function.
Acknowledgments
FUNDING SOURCE: None
Footnotes
DISCLOSURES:
Drs. Michael Pasque and Brian Cupps have a financial interest in Cardio1Scan. Cardio1Scan did not support this research.
Publisher's Disclaimer: This is a PDF file of an unedited manuscript that has been accepted for publication. As a service to our customers we are providing this early version of the manuscript. The manuscript will undergo copyediting, typesetting, and review of the resulting proof before it is published in its final citable form. Please note that during the production process errors may be discovered which could affect the content, and all legal disclaimers that apply to the journal pertain.
References
- 1.Greenberg NL, Firstenberg MS, Castro PL, Main M, Travaglini A, Odabashian JA, et al. Doppler-derived myocardial systolic strain rate is a strong index of left ventricular contractility. Circulation. 2002;105(1):99–105. doi: 10.1161/hc0102.101396. [DOI] [PubMed] [Google Scholar]
- 2.Young AA, Axel L, Dougherty L, Bogen DK, Parenteau CS. Validation of tagging with MR imaging to estimate material deformation. Radiology. 1993;188(1):101–8. doi: 10.1148/radiology.188.1.8511281. [DOI] [PubMed] [Google Scholar]
- 3.Moore CC, Lugo-Olivieri CH, McVeigh ER, Zerhouni EA. Three-dimensional systolic strain patterns in the normal human left ventricle: characterization with tagged MR imaging. Radiology. 2000;214(2):453–66. doi: 10.1148/radiology.214.2.r00fe17453. [DOI] [PMC free article] [PubMed] [Google Scholar]
- 4.Zerhouni EA, Parish DM, Rogers WJ, Yang A, Shapiro EP. Human heart: tagging with MR imaging--a method for noninvasive assessment of myocardial motion. Radiology. 1988;169(1):59–63. doi: 10.1148/radiology.169.1.3420283. [DOI] [PubMed] [Google Scholar]
- 5.Amundsen BH, Helle-Valle T, Edvardsen T, Torp H, Crosby J, Lyseggen E, et al. Noninvasive myocardial strain measurement by speckle tracking echocardiography: validation against sonomicrometry and tagged magnetic resonance imaging. J Am Coll Cardiol. 2006;47:789–93. doi: 10.1016/j.jacc.2005.10.040. [DOI] [PubMed] [Google Scholar]
- 6.Korinek J, Wang J, Sengupta PP, Miyazaki C, Kjaergaard J, McMahon E, et al. Two-dimensional strain–a Doppler-independent ultrasound method for quantitation of regional deformation: validation in vitro and in vivo. J Am Soc Echocardiogr. 2005;18:1247–1253. doi: 10.1016/j.echo.2005.03.024. [DOI] [PubMed] [Google Scholar]
- 7.Reisner SA, Lysyansky P, Agmon Y, Mutlak D, Lessick J, Friedman Z. Global longitudinal strain: a novel index of left ventricular systolic function. J Am Soc Echocardiogr. 2004;17:630–3. doi: 10.1016/j.echo.2004.02.011. [DOI] [PubMed] [Google Scholar]
- 8.Leitman M, Lysyansky P, Sidenko S, Shir V, Peleg E, Binenbaum M, et al. Two-dimensional strain—a novel software for real-time quantitative echocardiographic assessment of myocardial function. J Am Soc Echocardiogr. 2004;17:1021–9. doi: 10.1016/j.echo.2004.06.019. [DOI] [PubMed] [Google Scholar]
- 9.Sanchez-Quintana D, Climent V, Ho SY, Anderson RH. Myoarchitecture and connective tissue in hearts with tricuspid atresia. Heart. 1999;81:182–91. doi: 10.1136/hrt.81.2.182. [DOI] [PMC free article] [PubMed] [Google Scholar]
- 10.Delhaas T, Decaluwe W, Rubbens M, Kerckhoffs R, Arts T. Cardiac fiber orientation and the left-right asymmetry determining mechanism. Ann N Y Acad Sci. 2004;1015:190–201. doi: 10.1196/annals.1302.016. [DOI] [PubMed] [Google Scholar]
- 11.Bovendeerd PH, Huyghe JM, Arts T, van Campen DH, Reneman RS. Influence of endocardial-epicardial crossover of muscle fibers on left ventricular wall mechanics. J Biomech. 1994;27:941–51. doi: 10.1016/0021-9290(94)90266-6. [DOI] [PubMed] [Google Scholar]
- 12.Sengupta PP, Khandheria BK, Korinek J, Wang J, Jahangir A, Seward JB, Belohlavek M. Apex-to-base dispersion in regional timing of left ventricular shortening and lengthening. J Am Coll Cardiol. 2006;47:163–72. doi: 10.1016/j.jacc.2005.08.073. [DOI] [PubMed] [Google Scholar]
- 13.Aygen M, Popp RL. Influence of the orientation of myocardial fibers on echocardiographic images. Am J Cardiol. 1987;60:147–52. doi: 10.1016/0002-9149(87)91002-2. [DOI] [PubMed] [Google Scholar]
- 14.Holland MR, Finch-Johnston AE, Wallace KD, Handley SM, Wilkenshoff UM, Pérez JE, et al. Effects of tissue anisotropy and contrast acoustic properties on myocardial scattering in contrast echocardiography. J Am Soc Echocardiogr. 1999;12:564–73. doi: 10.1016/s0894-7317(99)70004-0. [DOI] [PubMed] [Google Scholar]
- 15.Bharati S, Lev M. The Pathology of Congenital Heart Disease. 1. Armonk, NY: Futura Publishing Co; 1996. pp. 403–419. [Google Scholar]
- 16.Lai WW, Geva T, Shirali G, Frommelt PC, Humes RA, Brook MM, et al. Guidelines and standards for performance of a pediatric echocardiogram: a report from the task force of the Pediatric Council of the American Society of Echocardiography. J Am Soc Echocardiogr. 2006;19:1413–1430. doi: 10.1016/j.echo.2006.09.001. [DOI] [PubMed] [Google Scholar]
- 17.Pomerantz BJ, Wollmuth JR, Krock MC, Cupps BP, Moustakidis P, Kouchoukos NT, et al. Myocardial systolic strain is decreased after aortic valve replacement in patients with aortic insufficiency. Ann Thorac Surg. 2005;80:2186–93. doi: 10.1016/j.athoracsur.2005.05.095. [DOI] [PubMed] [Google Scholar]
- 18.McVeigh ER, Zerhouni EA. Noninvasive measurement of transmural gradients in myocardial strain with MR imaging. Radiology. 1991;180:677– 83. doi: 10.1148/radiology.180.3.1871278. [DOI] [PMC free article] [PubMed] [Google Scholar]
- 19.Moulton MJ, Creswell LL, Downing SW, Actis RL, Szabo BA, Vannier MW, Pasque MK. Spline surface interpolation for calculating 3-D ventricular strains from MRI tissue tagging. Am J Physiol. 1996;270:H281–97. doi: 10.1152/ajpheart.1996.270.1.H281. [DOI] [PubMed] [Google Scholar]
- 20.Szabo B, Babuska I. Finite element analysis. 1. New York: John Wiley & Sons; 1991. [Google Scholar]
- 21.Lorch SM, Ludomirsky A, Singh GK. Maturational and Growth-Related Changes in Left Ventricular Longitudinal Strain and Strain Rate Measured by Two-Dimensional Speckle Tracking Echocardiography in Healthy Pediatric Population. J Am Soc Echocardiogr. 2008;21:1207–1215. doi: 10.1016/j.echo.2008.08.011. [DOI] [PubMed] [Google Scholar]
- 22.Colan SD, Parness IA, Spevak PJ, Sanders SP. Developmental modulation of myocardial mechanics: age- and growth-related alterations in afterload and contractility. J Am Coll Cardiol. 1992;19:619–29. doi: 10.1016/s0735-1097(10)80282-7. [DOI] [PubMed] [Google Scholar]
- 23.Amundsen BH, Crosby J, Steen PA, Torp H, Slørdahl SA, Støylen A. Regional myocardial long-axis strain and strain rate measured by different tissue Doppler and speckle tracking echocardiography methods: a comparison with tagged magnetic resonance imaging. Eur J Echocardiogr. 2009;10:229–237. doi: 10.1093/ejechocard/jen201. [DOI] [PubMed] [Google Scholar]
- 24.Bansal M, Cho GY, Chan J, Leano R, Haluska BA, Marwick TH. Feasibility and accuracy of different techniques of two-dimensional speckle based strain and validation with harmonic phase magnetic resonance imaging. J Am Soc Echocardiogr. 2008;21:1318–25. doi: 10.1016/j.echo.2008.09.021. [DOI] [PubMed] [Google Scholar]
- 25.Streeter DD, Jr, Spotnitz HM, Patel DP, Ross J, Jr, Sonnenblick EH. Fiber orientation in the canine left ventricle during diastole and systole. Circ Res. 1969;24:339–47. doi: 10.1161/01.res.24.3.339. [DOI] [PubMed] [Google Scholar]
- 26.Wickline SA, Verdonk ED, Miller JG. Three-dimensional characterization of human ventricular myofiber architecture by ultrasonic backscatter. J Clin Invest. 1991;88:438–46. doi: 10.1172/JCI115323. [DOI] [PMC free article] [PubMed] [Google Scholar]
- 27.Crosby J, Hergum T, Remme EW, Torp H. The Effect of Including Myocardial Anisotropy in Simulated Ultrasound Images of the Heart. IEEE Trans Ultrason Ferroelectr Freq Contro. 2009;56:326–33. doi: 10.1109/TUFFC.2009.1041. [DOI] [PubMed] [Google Scholar]
- 28.Bogaert J, Rademakers FE. Regional nonuniformity of normal adult human left ventricle. Am J Physiol (Heart Circ Physiol) 2001;280:H610–H620. doi: 10.1152/ajpheart.2001.280.2.H610. [DOI] [PubMed] [Google Scholar]
- 29.Prinzen FW, Augustijn CH, Arts T, Allessie MA, Reneman RS. Redistribution of myocardial fiber strain and blood flow by asynchronous activation. Am J Physiol. 1990;259(28):H300–H308. doi: 10.1152/ajpheart.1990.259.2.H300. Heart Circ. Physiol. [DOI] [PubMed] [Google Scholar]
- 30.Sengupta PP, Krishnamoorthy VK, Korinek J, Narula J, Vannan MA, Lester SJ, et al. Left ventricular form and function revisited: applied translational science to cardiovascular ultrasound imaging. J Am Soc Echocardiogr. 2007 May;20(5):539–551. doi: 10.1016/j.echo.2006.10.013. [DOI] [PMC free article] [PubMed] [Google Scholar]
- 31.Marwick TH, Leano RL, Brown J, Sun J, Hoffmann R, Lysyansky P, Becker M, Thomas JD. Myocardial Strain measurement with 2-dimensional speckle-tracking echocardiography: definition of normal range. J Am Coll Cardiol Img. 2009;2:80–4. doi: 10.1016/j.jcmg.2007.12.007. [DOI] [PubMed] [Google Scholar]
- 32.Herbots L, Maes F, D’Hooge J, Claus P, Dymarkowski S, Mertens P, et al. Quantifying myocardial deformation throughout the cardiac cycle: a comparison of ultrasound strain rate, grey-scale M-mode and magnetic resonance imaging. Ultrasound Med Biol. 2004;30:591–8. doi: 10.1016/j.ultrasmedbio.2004.02.003. [DOI] [PubMed] [Google Scholar]
- 33.Fogel MA, Weinberg PM, Gupta KB, Rychik J, Hubbard A, Hoffman EA, Haselgrove J. Mechanics of the Single Left Ventricle A Study in Ventricular-Ventricular Interaction II. Circulation. 1998;98:330–338. doi: 10.1161/01.cir.98.4.330. [DOI] [PubMed] [Google Scholar]
- 34.Anderson PA, Sleeper LA, Mahony L, et al. Contemporary outcomes after the Fontan procedure: a Pediatric Heart Network multicenter study. J Am Coll Cardiol. 2008;52:85–98. doi: 10.1016/j.jacc.2008.01.074. [DOI] [PMC free article] [PubMed] [Google Scholar]