

Abstract
Externally-sensitized electron-transfer fragmentation in dithiane PPG-protected carbonyls is adopted for detection and amplification of molecular recognition events. The new methodology allows for detection of as low as 50 attomoles of avidin utilizing an imager based on a low sensitivity mass-produced consumer CCD camera. Numeric modelling is carried out to demonstrate the intrinsic limitations of 2D amplification on surfaces and the advantages of unconstrained amplification in a compartmentalized volume of spatially addressable 3D solutions.
Introduction
Detection of molecular recognition events between biomolecules and potential small therapeutics plays a central role in the complex and laborious process of drug discovery. A large percent of existing drugs are designed to bind to a biological molecule and modulate its function. Therefore, the search for better methods to detect and quantify such binding is ongoing.
One of central themes in this ongoing effort is the sensitivity of detection. Various protocols are designed to pre-amplify the signal to a level at which it can be detected by the utilized hardware. PCR is one example of an excellent pre-amplification method, but it is obviously not general as it is limited to genetic material. In the context of spatially-addressable platforms (either on 2D surfaces or on polymeric beads, which can be mechanically separated) various approaches, including the conventional enzyme-linked immunosorbent assay (ELISA), have been used for the amplified detection of the molecular recognition events. ELISA, originally developed in the 60-70s1, utilizes enzyme-based amplification of a signal which can be easily visualized, e.g. via colorimetry.
More recently several non-enzymatic amplification schemes were developed, for example, amplified luminescent proximity homogeneous assay, ALPHA, which is touted as the “no-wash” high-throughput alternative to ELISA,2 allosteric non-enzymatic catalysis by small molecules,3 or polymerization-based amplified response to molecular recognition events.4,5
All these methods are based on a spatial proximity test augmented with a chemical or photochemical transducer to amplify signal. In Mirkin's allosteric non-enzymatic catalysis a catalyst is incorporated into a supramolecular assembly in which a binding event causes structural changes and activates the catalytic cycle producing the observable amplified signal.3 In Bowman's approach the tested binding event is designed to bring a polymerization initiator into a pool of monomers, triggering massive response due to radical polymerization. Initially the readout was based on visible microscopy observations of morphological changes, but lately more sensitive fluorescence turn-on transducer was added as an option.4b
One of the important considerations for any spatial proximity test is the distance at which an observable signal can be generated. For example, for the FRET (Förster Resonance Energy Transfer) based assays it is a few nanometers. Much larger distances are covered in the ALPHA assays in which an antibody-based binding event brings two types of beads in the immediate proximity of each other. The amplification of these binding events is designed around the production of singlet oxygen by a sensitizer immobilized on one of the beads, most commonly a phthalocyanine dye (λEX=680 nm). Short-lived singlet oxygen has a limited mean diffusion path, approximately 200 nm, and therefore only the bound second bead is affected. This second bead is outfitted with a singlet oxygen-activated luminophore (as an example, Europium-based AlphaLISA beads) emitting at 615 nm. The bead particles are present at low concentrations, so non-specific binding does not contribute much and the background noise is low. However, if binding events bring the two types of beads in the immediate proximity of each other, laser excitation at 680 nm produces bright emission at 615 nm. As an alternative to Europium luminophore, the “acceptor” bead could utilize the thioxene-anthracene-rubrene cascade in which the initial cycloaddition of 1O2 to thioxene produces dioxetane. Fragmentation of the dioxetane moiety into two carbonyls generates an excited state and initiates two energy transfer steps, first to anthracene and then to rubrene, resulting in a broad 520-620 nm emission. Regardless of the composition of the acceptor bead, one of the advantages of this technique is that the distance constrains (200 nm) are not as severe as in FRET (a few nanometers) allowing for greater flexibility in the kind of analyte detectable by this technique, including large proteins and even phage particles.2a
This advantage can also turn into a disadvantage if one needs to detect small molecule binding at higher concentrations. Given that the mean distance between molecules in a 1μM solution is less than 200 nm, the need is clearly there for amplified binding cascades triggered at much shorter distances.
We suggested that such tight proximity test for binding assays can be based on externally sensitized photoinduced electron transfer (ET) in a binary photoactive system, which can trigger a cascade of transformations designed to produce an easily discernible physical observable for uniform analytical detection. The distance dependence of electron transfer reactions is ideally suited for such a proximity test – electron transfers occur at practical rates at distances under 1 nm (and are most efficient when the orbitals of the donor and acceptor are in close overlap as a result of collisions).
Our binary donor-acceptor system of choice is based on Corey-Seebach dithiane-ketone adducts6 in which the dithiane moiety acts as a masking group (or PPG – photoremovable protecting group) for the carbonyl functionality. Excited triplet benzophenone is used as a one-electron oxidant generating a dithiane cation-radical which subsequently undergoes mesolytic C-C bond fragmentation, yielding the unprotected carbonyl compound and dithiane.7
Based on this PPG chemistry we have developed a novel binding assay for screening of combinatorial libraries encoded with mass-differentiated dithiane tags,8 where every successful spatial proximity event releases a unique encoding tag into solution. The tag can then be readily detected by a standard analytical method such as GCMS.
We have also demonstrated that our ET-based spatial proximity test is perfectly suitable for amplified detection of molecular recognition events. The core concept of this photoinduced amplification method is based on protecting the carbonyl moiety of the sensitizer itself with the dithiane PPG. When benzophenone is masked with the dithiane PPG, which disrupts its extended conjugation, the adduct does not absorb light above 300 nm, and therefore is fully stable when irradiated at 365 nm. However, if a seed amount of free benzophenone is introduced into the system, a massive amplification of benzophenone occurs (Figure 1).
Fig. 1.

Photoamplification of benzophenone: the dithiane PPG-masked benzophenone, unmasked with a small amount of seed sensitizer, carries the amplification chain unmasking more sensitizer (shown in red), leading to massive release of benzophenone from its masked PPG-protected form.
The initial trace amounts of free benzophenone trigger the externally-sensitized removal of the dithiane-based PPG, which restores the sensitizer's conjugated π system and allows for continuation of the photoamplification chain. More sensitizer then absorbs the 365 nm light, initiates electron transfer oxidation of the PPG, and releases more sensitizer to further affect PPG photo deprotection.
We have proven the concept not only in solution, where we observed a pronounced S-shaped autocatalytic curve for benzophenone release, but also for amplification on surfaces,9 and in a linear peptide-based arrays of photoactive lysines.10 Unlike the 3D (solution) chemistry, the 2-Dimensional amplification on surfaces was lacking the S-shaped autocatalytic release curve.
In this paper we report (i) our computational modelling of the amplified release from the PPG-protected benzophenones immobilized on surfaces, and explain why this process has an inherently limited quantum yield of amplification and, (ii) our implementation of 3D (solution phase) amplified release of the sensitizer from a pool of masked benzophenones and its application as an ultra-sensitive fluorescence turn-off binding assay.11
Results and Discussion
A. Amplified Unmasking of Aromatic Ketones on 2D Surfaces of Polymeric Beads or Dendrimers
In our prior experiments we immobilized dithiane-masked aromatic ketones, benzophenones or xanthones, on the surface of polystyrene high loading polymeric beads or PAMAM-G5 dendrimers and sparsely tethered minute amounts of free sensitizer (up to 5%) to prove the concept of amplified release of benzophenone on a surface.9 As a result of irradiation, we observed massive photodeprotection and release of dithiane tags in solution, which was monitored by GCMS. The obtained graph, however, was lacking the autocatalytic S-shape, i.e. the first derivative was always negative, with the concentration of the released dithiane levelling off. Yet the release was clearly amplified, i.e. the amount of recovered dithiane exceeds the initial 5% fraction of seed sensitizer by a factor of at least 10.
In the present study we aimed to better understand these trends through numerical modelling of the surface amplification processes, where the following symbols and parameters were used (Figure 2):
Fig. 2.

Initial parameters for the numerical modelling of 2D (surface) photoamplification.
The 2D surface is represented by a matrix of 2500 tethered masked benzophenones (protected with the dithiane PPG), which are shown as hexagonally packed white circles (corresponding chemical structures and processes are depicted in Scheme 1). A planted tethered unmasked benzophenone, shown as a red spot in Figure 2, can get excited and undergo electron transfer to form a contact anion-radical (violet)-cation radical (yellow) pair with the probability PET1. The pair has several options: (i) to fragment, regenerating the original benzophenone and producing a new one – this is the productive channel; (ii) it can experience a second electron transfer (PET2) to form a separated ion pair, which in turn may fragment; (iii) the initial ion-radical pair can undergo back electron transfer with the probability PBET. Finally, (iv) any of the excited benzophenones can “die” by reduction or crosslinking with the probability PRED (reduced photoinactive species are depicted as gray spots). If there are no dithiane-containing neighbors benzophenone can also undergo radiationless decay. We have considered incorporation of benzophenone's self-quenching channel into our modeling scheme, but decided to neglect it for the following reason: according to Singer12 and coworkers the benzophenone self-quenching constant is 4.4 × 10⁵ M−1 s−1. Our data on electron transfer quenching of benzophenone by dithianes and dithiane-ketone adducts show that these processes have nearly diffusion controlled rate constants from 1.5 × 10⁹ to 3.0 × 10⁹ M−1s−1 in aqueous acetonitrile13 – almost four orders of magnitude faster than the self-quenching. The benzophenone is excited randomly, which initiates a Markov chain14 with the transition probability matrix changing dynamically as more dithianes are released and more benzophenones become unmasked.
Scheme 1.

Structural illustration for the color coding in Fig. 2
In each modeling run we initiate 5000 random walks in the field of 2499 masked benzophenones plus a single free seed benzophenone. In this case the quantum yield is, by definition, equal to the affected surface area divided by two. For example, if during a run 250 masked benzophenones lost their dithiane protection as a result of the on-surface amplification cascade (i.e. 10% of the surface is affected), the quantum yield is QY = 0.1/2 = 0.05 (which is the same as 250 reacted adducts per 5000 “absorbed” photons).
The PX values shown in Fig 3. are unnormalized relative probabilites (one can also think of them as relative rate constants). The electron-transfer steps are treated as bimolecular processes, where the probability of the event is PX normalized for the probabilities of other events (ΣPα) and for the number of closest neighbors in the hexagonal packing of the field, for which these processes are available (i.e. dithiane adducts). All other processes, reduction, cross-linking and fragmentation are treated as unimolecular reactions, where there is no need to normalize for the number of available neighbors (i.e. it is assumed that the rate of cross-linking with the matrix is relatively constant and does not depend on the protection state of the neighbor).
Fig. 3.

Numerical modelling of 2D photoamplification: effects of PET2 and PRED on the outcome of individual runs (final snapshot is shown).
In this report we show selected runs which are most informative for providing an understanding of surface amplification. Figure 3 shows the final state of the amplification field after all 5000 virtual photons were absorbed inducing specific reactions (the cation-radical/anion radical intermediates are not shown). In this series we constrain the initial parameters as follows: RET1=10, RBET=60, and RFRAG=5. The first pane (1) in Figure 3 demonstrates that if the reduction rate exceeds the rate of walking, the net result is a poor quantum yield. Notice also that there are no free benzophenones left at the end of the run, they are prematurely reduced. If the walking probability (PET2) is set to 3 and the reduction (PRED) – to 1 then the quantum yield grows dramatically (pane 2), and there are still some intact benzophenones left (shown in red) to continue the amplification chain. Further increasing PET2 improves the QY (3). However, should the PET2 and PRED values be swapped at this point – the result is a dismal quantum yield (4). This poor performance can be recovered by increasing PET2, even without a decrease in PRED (5).
This subset of runs demonstrated that the quantum yield of amplification is increased not only for obvious reason, i.e. with better PFRAG, but also with increasing mobility/promiscuity of the radical cation, PET2. The result is effective creation of sparse initiation centers fully surrounded by the PPG-masked benzophenones, increasing the probability that each absorbed photon will initiate productive fragmentation. In (5) we also observe that increasing PET2 beyond a certain point is counterproductive as the added sparsity leaves behind islands of intact masked sensitizer surrounded by reduced benzophenones. This constitutes a dead end – these masked benzophenones will never be deprotected and therefore will not participate in an amplification chain.
Another interesting observation was the effect of the reduction probability (Figure 4). The left pane represents an ideal system – where there is no back electron transfer or reduction. Every time electron transfer is initiated fragmentation takes place producing more benzophenone. In the graph below the respective field snapshot we plotted the release of dithianes as a function of total absorbed photons (each point represents 100 photons). As seen from the left graph, the quantum yield is not perfect – it is barely above 20% (seen @ 2500 absorbed photons). Also notable in the solid phase: there is no autocatalytic S-curve, even though this run is set up under the best case scenario – no back electron transfer and no reduction.
Fig. 4.

Numerical modelling of 2D photoamplification: perfect case scenario with PRED=0 (left); and not-so-perfect PRED=1 (right). The graphs below the final amplification snapshots show the release of dithianes as a function of the number of absorbed photons (each point represent 100 photons).
The rationale for this paradox is relatively straightforward. In solution chemistry, benzophenone unmasked from the dithiane PPG is free to diffuse throughout the 3D volume of solution and continue the amplification chain by unmasking new copies of the sensitizer. This will take place until it eventually photobleaches via reduction or fragmentation.
Unlike solution chemistry, once the advancing amplification “front” frees the frontier benzophenones on a 2D surface and passes on, all the freed “inner” benzophenones now lack dithiane neighbors. They simply absorb and waste photons, decreasing the quantum yield and preventing the upward curvature of the release plot. It is only the “frontier” benzophenones that are capable of unmasking their masked neighbors.
Should we ensure, in our modeling, a certain rate of reduction, which implies premature demise of some benzophenones – the result is somewhat counterintuitive, as the quantum yield actually increases (the right snapshot and graph in Figure 4). This fits with the rational design of such a 2D surface array, as one would want inner benzophenones to become reduced to prevent their absorbing and wasting photons once the amplification front passes beyond their vicinity (because productive fragmentation channels are no longer available to them, as they do not have masked neighbors).
This simple numerical modeling provides clarification of some finer points, but most importantly, it clearly outlines the limitations of 2D amplification on surfaces. In the real world excited benzophenones are quite vulnerable to reduction by a polymer matrix. While experimentally, we see massive release of PPG dithianes as irradiation progresses, the amplification ratio (i.e. the number of unmasked molecules of benzophenone for each molecule of free sensitizer) is limited by the very nature of surface amplification, never approaching the large values obtained in 3D solutions.
This led us to focus our effort on 3D amplification in compartmentalized volumes containing solution formulations of masked sensitizers.
B. Photoamplified release of aromatic ketones from their PPG-masked precursors in solution and its monitoring by fluorescence detection
As follows from part A above, the efficiency of the amplified release of sensitizers from their PPG-masked form in 3D solution is much higher than that on a 2D surface, as the unmasked sensitizer is free to diffuse through the entire volume. This allows it to initiate numerous unmasking events before reduction terminates propagation of the chain. Our initial GCMS and NMR monitoring9 of the amplification progress provided some encouraging data on the amplification ratio. However, we still needed to design a practical and sensitive real time monitoring technique for such amplifications. For obvious reasons fluorescence monitoring can be such a technique.
We reasoned that both (i) photophysical quenching of fluorophores and (ii) benzophenone induced photochemical degradation resulting in fluorophore photobleaching are the two modes of action which can be employed for fluorescence monitoring of benzophenone release and amplification in bulk solvent. Therefore, we have developed a fluorescence turn-off assay in which the unmasking of amplified benzophenone is monitored by emission decrease due to fluorophore quenching.
B.1. Photophysical quenching by benzophenone
The photophysical quenching by benzophenone is most efficient for fluorophores which possess relatively high lying singlet excited states, for example, p-terphenyl (ε = 33,800 M−1 cm−1 @ 276.25 nm, λem max ≈ 350 nm, ΦF = 0.93) and p-quaterphenyl (ε = 41,000 M−1 cm−1 @ 294.75 nm, broad λem max ≈ 360 nm, ΦF = 0.89. 15 These are robust fluorophores with excellent extinction coefficients, frequently used in dye lasers.16 The fluorescence lifetimes are 0.95 and 0.92 ns respectively.17
These lifetimes are sufficiently short, such that even at diffusion controlled rates of quenching the dithiane adduct (i.e. the dithiane PPG-masked sensitizer) does not quench the emission of p-terphenyl considerably: in the 10-30 mM range of concentrations the initial emission is decreased 2-3 fold, which is still a practical starting point for the fluorescence turn off assay.
Luckily unprotected benzophenone quenches p-terphenyl's emission in dichloromethane very efficiently with a heavily nonlinear Stern-Volmer plot, which can be described by a simple quadratic function I0/I=1+1.27×108[Q]2. This implies that benzophenone needs to be amplified only to 0.5 mM concentration to ensure a thirty-fold decrease in the fluorophore's emission. In our experiments the best amplification results are achieved when the PPG-masked sensitizer is used at 30 mM. We can reproducibly amplify benzophenone to > 1 mM concentration, which causes a more than hundred-fold decrease in fluorescence intensity.
At this point we do not have a quantitative model for the quadratic dependence of this quenching curve. We hypothesize that considerable static quenching is involved. However, our attempts to fit the experimental data to a quadratic function I0/I=(1+KSV[Q])(1+K[Q]) produced insufficient curvature and therefore poor fit even when a diffusion controlled KSV value was used. Also, we do not see any evidence for the ground state binding between p-terphenyl and benzophenone by NMR (see Supporting Information). A reviewer suggested that trivial absorption of the amplified benzophenone at the fluorophore's excitation wavelength is also contributing to the observed non-linearity of the Stern-Volmer plot. This certainly could be a factor enhancing the photoamplified quenching of fluorescence as benzophenone is amplified to millimolar concentration. We are currently looking for a comprehensive mechanistic rationale of this hyper quenching.
Two additional considerations were taken into account when choosing the fluorophore for this application: (i) ideally the fluorophore should not absorb in the vicinity of 365 nm, i.e. the amplification photochemistry wavelength designed around benzophenone's n→π* excitation band, and (ii) the fluorophore, if accidentally excited, should not be able to initiate the amplification cascade, as this amounts to a false positive.
Both constraints are satisfied by both p-terphenyl and p-quaterphenyl. Their UV absorption is negligible above 350 nm and control experiments show that when the PPG-masked benzophenone (which, because of disrupted conjugation, does not absorb above 300-320 nm) is irradiated @365 nm in the presence of either ter- or quaterphenyl, the net result is no different from irradiation of the masked sensitizer in the absence of the fluorophores. This indicates that the small fraction of excited fluorophores which undergo intersystem crossing into triplet manifold, are not capable of triggering the amplification cascade.
One notes that, in the absence of seed sensitizer, the PPG-masked benzophenones do eventually undergo fragmentation after extended irradiation times at 365 nm. We have two possible rationales for this mistriggering: (i) there is a very inefficient direct, i.e. non-sensitized, fragmentation resulting in photoinduced removal of the dithiane-based PPG, which releases trace benzophenone and triggers the much more efficient externally sensitized amplification cascade; and/or (ii) it is inevitable that the purified PPG-masked benzophenone always contains trace amounts of free benzophenone, which pre-defines the intrinsic detection limit for this method.18
The effects of the first, non-sensitized mistriggering, can be alleviated by better conditioning of light, to prevent absorption of shorter wavelengths by deconjugated masked benzophenone. As a rule we utilize Nichia's UV LED chips, which have an excellent narrow emission profile centered at 365 nm.19 This source can be further conditioned with a high quality 365 nm narrow bandpass interference filter (Semrock), dramatically decreasing the number of stray photons below 340 nm.
Thorough purification of the masked sensitizer via multiple recrystallizations helps to remedy the effects of trace residual sensitizer in the PPG-masked formulation prior to the triggering event. Our dilution series experiments presented in Figure 6 imply that, if such residual free benzophenones trigger the amplification chain in the case of “no sensitizer added”, the recrystallized dithiane-benzophenone adduct contains no more than a few ppb of free benzophenone. This, in conjunction with preconcentration of the sensitizer in the lipid layer as described below, provides an excellent dynamic range of concentrations for detection of molecular recognition events relevant to physiological conditions.
Fig. 6.

Autocatalytic curve for the quenching of p-quaterphenyl due to photoamplified release of benzophenone from a 30 mM of PPG-masked benzophenone in DCM.
NMR experiments were run to confirm that benzophenone is actually photoreleased from its PPG-masked state in the presence of p-terphenyl and p-quaterphenyl, i.e. that neither fluorophore interferes with the amplification photochemistry of the sensitizer. The fluorescence turn-off assay was then carried out by monitoring the emission from three cells; all containing a formulation of 30 mM masked benzophenone and 10−5M p-quaterphenyl and different amounts of the seed benzophenone (180 ppb – dotted line, 18 ppb – dashed line, and “no benzophenone added” – solid line). As clearly seen from Figure 6 the samples seeded with benzophenone underwent accelerated quenching of fluorescence, whereas it took considerably longer for the “no benzophenone added” sample (solid line) to eventually quench emission. The accelerated quenching of fluorescence from seeded samples allowed for “detection” of seeded benzophenone.
In subsequent experiments, with the masked sensitizer purified by multiple recrystallizations, the reproducible (concentration) detection limit in a bulk solution of DCM was determined to be approximately 10 nM benzophenone. In these experiments the emission intensity of the cells seeded with sensitizer was at least 4 times lower than in cells with no benzophenone added. Such four-fold difference in emission is readily discernible with not only a scientific grade CCD but also with commercial mass produced CCD cameras.
B.2. Photobleaching of fluorophores via a photochemical reaction with benzophenone
Utilization of bright and robust fluorophores – optimized for fluorescence microscopy in the visible part of the spectrum – is an alternative (and appealing) option for amplified fluorescence turn-off assays. However, these fluorophores have low lying singlet states which are not readily quenched by amplified benzophenone. In this case we use photooxidative degradation of the fluorophore by benzophenone to achieve the same turn-off effect. The primary amplification process, in which benzophenone's concentration increases as the result of photoinduced unmasking, is hardly affected by the partial reduction of benzophenone with the fluorophore present only in micromolar concentrations. However, if the amplification chain produces enough benzophenone as the photoreaction progresses, it can cause photoinduced electron-transfer oxidation of the fluorophore. In coumarin dyes, for example, it is well documented that electron transfer reactions cause dealkylation of the amino group.20 We have shown that such ET-sensitized dealkylation leads to a rapid decrease in fluorescence. The fluorophore, 3-(benzo[d]thiazol-2-yl)-7-diethylaminocoumarin, commonly known as coumarin-6 (C6), was subjected to irradiation in the presence of benzophenone. This led to de-ethylation of C6 to yield a secondary fluorophore that photobleaches quickly upon formation. The two possible reaction mechanisms are shown in Scheme 2 and Scheme 3. Both reactions give the same product, 3-(benzo[d]thiazol-2-yl)-7-ethylaminocoumarin.
Scheme 2.

A tentative mechanism for the de-ethylation of Coumarin-6 sensitized by benzophenone.
Scheme 3.

An alternative oxygen-dependent mechanism for the de-ethylation of Coumarin-6 sensitized by benzophenone.
The dealkylation reaction of diethylaminocoumarins was confirmed by 1H NMR using 7-diethylaminocoumarin-3-(N-butyl)-carboxamide. The 1H NMR shows both the appearance of an acetaldehyde peak and the loss of one ethyl group, while the coumarin itself remains intact. Upon isolation of the dealkylated product its fluorescence was compared with that of the starting (i.e. diethyl) coumarin, Figure 7. We found that the mono-ethyl intermediate in this degradation is actually a brighter fluorophore, the relative fluorescence quantum yield ΦF (ethyl/diethyl) is 1.60. However, the mono-ethyl species turned out to be even less stable the diethylamino starting material when irradiated in the presence of benzophenone. We hypothesize that the mono-ethyl substituted aminocoumarin undergoes a second de-ethylation and is subsequently photobleached by triplet benzophenone.
Fig. 7.

Excitation and emission spectra comparison for 7-diethylaminocoumarin-3-(N-butyl)-carboxamide (20) and its dealkylated (mono-ethyl) product 7-ethylaminocoumarin-3-(N-butyl)-carboxamide
We therefore decided to utilize this dealkylation reaction as a basis for a visible range fluorescence “turn-off” assay, as the diethylamino (starting) coumarin retains more than 80% of its fluorescence after irradiation at 365 nm for 1 h, but in the presence of a mere 10 μM benzophenone it is photobleached losing more than 50% of its emission within minutes.
The final bulk control experiments confirmed that 7-diethylaminocoumarin is actually photobleached in the course of amplified unmasking of benzophenone from its dithiane adduct, and that this photobleaching of the fluorophore does not interfere with photoamplification.
We then examined the inventory of diethylamino coumarin dyes and selected coumarin-6 as the fluorophore of choice as its excitation and emission maxima are further red-shifted compared with its carboxamide counterparts (Figure 8). Additionally, its extinction coefficient at 365 nm is more than twenty fold lower than at its λmax. This offers excellent conditions for detection of fluorescence and very little interference with irradiation at 365 nm which needs to stay unobstructed to ensure the best amplification ratio.
Fig. 8.

Excitation and emission spectra of coumarin 6 showing negligible absorption in the 365 nm band reserved for amplification.
In a typical experiment, a 30 mM solution of the dithiane PPG-masked sensitizer, 10−6 M of benzophenone, and 10−6 M C6 was prepared in DCM and 0.05 M PBS (pH=7.5) was added. A matching solution lacking BP was also prepared. This solution's fluorescence spectra were recorded (λex = 450 nm) as they were irradiated using an in house built 365 nm UV-LED source. In Figure 9 the decrease in emission over an irradiation time of 35 min can be seen.
Fig. 9.

Fluorescence bleaching over 35 minutes for a sample containing 30 mM DT-BP adduct + 10−6 M BP + 10−6 M C6 in DCM under 0.05 M PBS (pH7.5).
The fluorescence intensity at 495 nm for the scan at each irradiation interval was normalized to the starting intensity at time zero and plotted to show an autocatalytic curve for fluorescence quenching which is typical of photoamplification (Figure 10). The resulting curve verifies that fluorescence quenching is due to the photoamplification of benzophenone, from cleavage of the PPG-masked benzophenone, which sensitizes dealkylation of C6 into its unstable and readily photobleached counterpart. Additional 1H NMR experiments indicate that the presence of the fluorophore does not interfere with the photoamplified fragmentation of the dithiane PPG-protected benzophenone. Although it is oxidatively destroyed by the amplified benzophenone, and is likely to take a few molecules of benzophenone out of the amplification chain due to irreversible reduction, the fluorophore's micromolar concentration range is dwarfed by the pool of the masked sensitizer (30 mM). Therefore, such stray reductions have negligible effect on photoamplification. Figure 10 shows a typical experiment in which a biphasic system (organic phase – DCM, aqueous phase – 50mM PBS buffer) is seeded with 1μM benzophenone (solid blue line) and irradiated. The irradiation progress is compared with a control lacking seed benzophenone (dashed red line). After 30 min of irradiation the “no benzophenone added” control stays more than ten times brighter than the seeded sample.
Fig. 10.

The quenching curves for C6 due to photoamplified release of benzophenone from the PPG-protected benzophenone in DCM under 0.05 M PBS (pH7.5). 30 mM PPG-BP + 10−6 M BP + 10−6 M C6 (blue), 30 mM PPG-BP + 10−6 M C6 (red).
Solvent selection: The amplification efficiency generally improves in solvents with low viscosity, as the initial electron transfer rates in the benzophenone-dithiane system are nearly diffusion-controlled.13 Another practical feature of an organic solvent optimized for compartmentalized photochemistry is its density. It is desirable, albeit not critical, that the aqueous buffer would be lighter than the organic solvent, and thus float on its surface. Dichloromethane satisfies these requirements. However, for a robust assay it is also imperative that the organic formulation does not dry prematurely. While the aqueous buffer interface slows down the rate of organic solvent evaporation, the use of DCM in miniaturized devices was deemed not practical.
We screened a number of chlorinated hydrocarbons and chose 1,4-dichlorobutane, which has a very high boiling point (162°C) and does not evaporate from under the aqueous buffer in the microcapillary cassette for days. The second column of Table 1 has the most critical parameter – the maximum difference in normalized emission achieved in an amplification run with 10μM seeded benzophenone and the control with no benzophenone added. For the amplification in dichloromethane this value is 90%. While for 1,4-dichlorobutane this difference is reduced to 50%, it still offers a readily discernible yes/no test. 1,3-Dichlorobutane showed a comparable Δ of 57%, but its boiling point is lower by almost 30°C. On the other hand, while 1,5-dichloropentane is less volatile than 1,4-dichlorobutane, the maximum difference of normalized emissions during an amplification run in this solvent was only 14%, which is not practical.
Table 1.
Solvent selection.
C. Triggering the amplification cascade with a molecular recognition event
In our studies we have chosen the archetypical binding pair of biotin-avidin to prove the concept of amplified detection. The general concept for detecting molecular recognition in a compartmentalized volume is found in Figure 11: (1) Microwells are uniformly loaded with a fluorophore and masked sensitizer in organic solvent or organogel – a generic formulation which is universally applicable to any type of assayed molecules. A lipid layer serves as an interface between the organic and the aqueous phases. The ligands, tethered to an amphiphile, are printed on the surface of wells and therefore displayed at the organic-aqueous interface. (2) The target protein–sensitizer conjugate is added in a buffer and incubated. Binding events brings the tethered sensitizer to the solvent interface at which point irradiation commences. (3) Initially the inserted sensitizer unmasks a few copies of BP in its immediate vicinity. These liberated benzophenones are free to diffuse throughout the entire volume of the well, releasing and amplifying BP en masse. This leads to complete quenching/bleaching of the fluorophore. As a result, the whole well/pixel goes dark indicating a “positive hit”.
Fig. 11.

Photoamplified detection of a binding event (general concept).
Tethering the seed sensitizer to the target protein, avidin, was accomplished with a standard N-hydroxysuccinimide (NHS) coupling procedure. Scheme 4 shows the synthetic procedure for synthesis of a long-chain carboxylate carrying the sensitizer.
Scheme 4.

In our optimizations of the tether length we learned that use of a shorter tether fails to trigger the amplification chain, for example when 7 is directly coupled to avidin. Conceivably this was due to insufficient penetration of the sensitizer through the lipid layer at the organic-aqueous interface. However, when the tether length was doubled to approximately 3 nm (7 → 8), the extended conjugate successfully initiated the photoamplification chain.
Figure 12 describes experiments in macroscopic volumes of 700 μL fluorescent cells. The bottom layer of the biphasic solution is a standard organic formulation of a masked sensitizer, for example 30 mM dithiane PPG-protected benzophenone, and a 10μM fluorophore – in this case coumarin-6. The aqueous phase is separated from the organic phase by a lipid layer (either biotinylated lipid or phosphatidyl choline as a control). Avidin was conjugated with the seed sensitizer, xanthone for this series of experiments, using the tethered carboxylate 8.
Fig. 12.

Avidin “detection” in a 0.7 mL fluorescent cell using a two phase set up where the organic solution with the fluorophore and the PPG-masked sensitizer (which is not changed in A through D) is interfaced with the aqueous solution via a lipid interface. (A) has both avidin-sensitizer conjugate in the aqueous solution and the biotinylated lipid at the interface; (B) is lacking the avidin conjugate; (C) is lacking the biotinylated lipid; (D) is lacking both the conjugate and the lipid.
The avidin-xanthone conjugate, or blank PBS buffer as a control, was added to the aqueous phase and the entire sample was irradiated. A dramatic ten-fold fluorescence decrease was achieved only in the case when both avidin-xanthone conjugate and the biotinylated lipid were present (Figure 12-A). The controls lacking one or both components of the recognition pair (the avidin-xanthone conjugate or the biotinylated lipid) showed negligible changes in fluorescence. Control (B) containing the avidin-xanthone conjugate but lacking the biotinylated ligands showed a modest 35% decrease in fluorescence, indicating that a small amount of photoactive conjugate is recruited to the lipid layer by non-specific binding. The brightness of the residual emission in this control experiment was still several times higher than in (A).
These “bulk” experiments in a fluorescent cell demonstrate the feasibility of the amplified detection of molecular recognition events utilizing the fluorescence as the observable. The next step was to implement this general approach on much smaller scale, for which we chose micro capillary cassettes. The primary goal was to determine the absolute detection limit and also to test alternative imaging devices, including ubiquitous cell phone cameras.
The capillary cassettes were fabricated by assembling capillaries, heat-sealed from one end, around a center rod as shown in Figure 13.
Fig. 13.
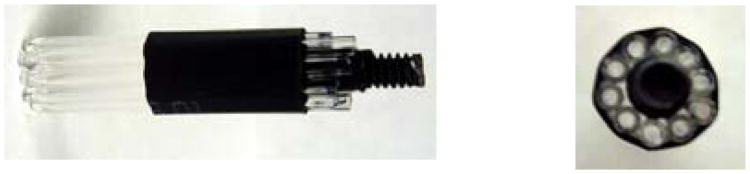
The capillary cassettes.
The capillaries were filled with the organic amplification solution (a total of 3 μL of dithiane PPG-protected benzophenone + fluorophore C6 + the lipid), and the aqueous buffer. The same controls, used in the fluorescence cell experiments, were used here. In these experiments we used both 0.86 mm OD capillaries sealed from one end, and 400 μm OD capillaries open from both ends (where the tested solutions are held by capillary forces).
The capillary cassette was first imaged using a mass produced consumer CCD camera with no chip cooling. Figure 14 shows pair-wise comparison of the emission originating from individual capillaries with (+) and without (−) the avidin-xanthone conjugate added to the aqueous buffers (5μL of aqueous solution volume total). After approximately half an hour of exposure to 365 nm UV LEDs there is clearly unambiguous yes/no discrimination between the capillaries to which the sensitizer-tethered target protein was added and the capillaries with no such conjugates, which stayed discernibly brighter through the duration of the experiment. More dilute samples expectedly took slightly more time to “develop”. The top spot shows a typical emission of both (+) and (−) spots before the irradiation.
Fig. 14.

Pair-wise comparison in the avidin conjugate dilution series. The left column has the bottom view of the capillaries with progressively dilute conjugate added; the right column is a control with no avidin.
The lowest concentration of the avidin conjugate for which we consistently obtained reproducible results was 10 pM, which corresponds to 50 attomoles of avidin. This is no small feat, given that imaging was performed on an off-the-shelf consumer CCD camera which lacked chip cooling. Further, the only optics used were a filter cube from a Leuca fluorescence microscope outfitted with two plano-convex lenses for rudimentary focusing.
We note that the 10 pM detection limit achieved in a biphasic system is improved from the value obtained in bulk organic solution with seeded sensitizer (see above). We rationalize this result in terms of a local pre-concentration effect due to recruitment of avidin-sensitizer conjugate to the biotinylated lipid layer.
Further investigation revealed that additional miniaturization is not only possible, but that it can be achieved with an even less sophisticated cell-phone cameras. These cameras, with mass-produced 3-5 megapixel CCDs, have became broadly available with a spatial resolution which is more than adequate for imaging of high density arrays. What they generally lack is the sensitivity of detection. Provided one can offer a practical pre-amplification method, which allows either an increase in fluorescence or turns it off from an easily detectable level, a number of portable analytical field devices can be envisioned.
A standard, off the shelf Motorola Droid with a 5.0 MP Bayer coated (color) CMOS sensor was used for imaging. The contrast ratio was achieved by setting the phone into “night time” mode and the focus set to macro mode. To determine approximate detection limit for C6 (i.e. the capability to confidently image/detect the fluorescing spot before amplification takes place), both 0.86 and 0.4 mm ID capillaries were filled with decreasing volumes of 10−5 M C6 in 1,4-dichlorobutane: (i) 0.86 5 mm capillary with 4 μL of the fluorophore solution; (ii) 0.4 mm capillary with 0.4 μL fluorophore solution; (iii) 0.4 mm capillary with 0.1μL fluorophore solution.
The images were acquired with a 550±25 nm bandpass filter by simply illuminating the capillaries with a 400 nm (12mW) excitation LED from the side, as shown in Figure 15. Each fluorophore containing capillary was imaged with a control containing blank solvent to control for a signal due to possible scattering. No scattering was detected eliminating the need for a microscope filter cube with a dichroic mirror and considerably simplifying design of the imager.
Fig. 15.

Detection of fluorescence in small volumes utilizing a ubiquitous cell phone camera.
The results in Figure 15 show that the cell phone camera can image as little as 1 pmole of fluorophore in a 100 nanoliter volume, which implies that an attomolar detection limit for avidin is attainable with a cell phone as an imaging device. As long as there is discernible contrast between the initial “bright” state of a spot and its turned-off “dark” state our pre-amplification methodology can be successfully implemented.
Conclusions
We have shown that a binary photoactive system based on the externally-sensitized electron-transfer fragmentation in dithiane PPG-protected carbonyls can be adopted for detection of molecular recognition events. The short distance dependence of electron transfer offers a general spatial proximity test, which can be adopted for both encoded combinatorial libraries in solution and amplified detection in a compartmentalized volume of a spatially-addressable device. With numerical modelling we have demonstrated the limitations of such amplification on 2D surfaces. For the compartmentalized spatially addressable solutions we have shown that the intrinsic detection limit for the photoamplified fluorescence turn-off assay can be as low as 50 attomoles of the analyte.
Regardless of the hardware for fluorescence detection, the photoamplified fluorescence turn-off methodology could offer a considerable sensitivity boost for both low-end and high-end instrumentation. As we have shown, with the low end imagers one still can detect attomolar amounts of the analyte. With high-end fluorescence microscopy or scanners the detection limit can potentially approach single molecule levels.
Experimental
General Information
Common solvents were purchased from AAper Alcohol and used as is, except for THF and hexane. THF was refluxed over and distilled from potassium benzophenone ketyl prior to use. Hexane was distilled over calcium hydride before use. All reagents for synthesis were purchased from Alfa Aesar, TCI America, Fisher Scientific, AK Scientific, ChemImpex, or Aldrich. All reagents were used without purification unless otherwise noted. Avidin was purchased from Aldrich. All lipids were purchased from Avanti polar lipids. NMR spectra were recorded at 25 °C on either a Varian Mercury 400 MHz instrument, or a Bruker Biospin 500 MHZ instrument, in CDCl3 with TMS as an internal standard (unless noted otherwise). Column chromatography was performed on silica gel, 32-63μ mesh, and the eluent is noted in the procedure. UV-Vis spectra were recorded on a Beckman DU-640 Spectrophotometer and bulk solution fluorescence measurements were made on a Varian Cary Eclipse Fluorescence Spectrophotometer.
Photoreactions were carried out using an in house built Nichia UV LED 5×250mW 365nm reactor outfitted with a 300-400 nm bandpass filter. For each photoreaction discussed a bulk solution of fluorophore and adduct was prepared and divided to the appropriate number of samples. Benzophenone was added to each sample, from a stock solution, at the appropriate concentration. The concentrations of each reagent in the photoreactions are stated below. All bulk solution photoreactions were carried out in quartz fluorescence spectroscopy cells from NSG precision cells.
General method for adduct preparation
A generic method by Corey and Seebach was modified to prepare the dithiane-benzophenone adducts utilized as masked sensitizers in this study. A dithiane (5.1 mmol) was dissolved in freshly distilled THF (30 mL) and placed under nitrogen. n-Butyllithium (4.3 mL, 6.8 mmol, 1.6 M solution in hexanes) was added at room temperature with stirring. The resulting mixture was stirred for 10 minutes. The appropriate benzophenone (3.4 mmol) was dissolved in freshly distilled THF (10 mL) and added to the anion mixture while stirring. The reaction was left for 2 hours at room temperature, before quenching with a saturated solution of ammonium chloride. The aqueous layer was extracted twice with ethyl acetate, which was collected and dried over anhydrous sodium sulfate. The solvent was removed under vacuum, and the residue was purified by column chromatography (silica gel, ethyl acetate/hexanes) or recrystallization (DCM in hexanes).
(1,3-dithian-2-yl)diphenylmethanol1 (1)
1.8 g, 60% yield, 1H NMR (500 MHz, CDCl3) δ 7.56-7.63 (d, 4H, J = 7.2 Hz), 7.30-7.37 (d, 4H, J = 7.5 Hz), 7.22-7.27 (m, 2H), 3.28 (s, 1H), 2.84-2.99 (m, 4H), 2.04-2.12 (m, 1H), 1.82-1.90 (m, 1H).
Preparation of Xanthone Derivatives for coupling to Avidin
2-Bromo-9H-xanthen-9-one (3)
Sodium metal (∼2.4 g) was dissolved in methanol (60 mL). 4-bromophenol (10 g, 58 mmol) and 2-chlorobenzoic acid (9.2 g, 59 mmol) were added and methanol was removed under vacuum to give a cake like solid. Copper powder (cat.) was added, the reaction was heated with an open flame (bunsen burner), which was applied until dense white smoke spread over the entire solid for several minutes. The reaction was cooled for 30 min. Concentrated sulfuric acid (100 mL) was added and the mixture was heated for 4 hours at 90 °C, cooled to room temperature, poured over ice, extracted with dichloromethane (2 × 150 mL), and washed with 5% aq. NaOH solution. The organic layer was collected, dried over anhydrous sodium sulfate, and removed under vacuum. The resulting solid was purified by gel filtration (eluted by CH2Cl2) and the solvent was removed to give the product (1.4 g, 9% yield). 1H NMR (400 MHz, CDCl3) 8 8.46-8.47 (d, 1H, J = 2.5 Hz), 8.32-8.35 (dd, 1H, J = 1.7, 8.0 Hz), 7.77-7.82 (ddd, 1H, J = 0.6, 2.5, 8.9 Hz), 7.73-7.76 (m, 1H), 7.48-7.51 (d, 1H, J = 8.5 Hz), 7.39-7.43 (m, 2H).
Methyl 11-(9-oxo-9H-xanthen-2-yl)undecanoate (5)
To a pressure vessel containing methyl-10-undecenoate (2.45 mL, 10 mmol) was added 9-BBN (0.5 M in THF, 22 mL, 10 mmol). The reaction mixture was heated to 85-90 °C with stirring for 18 hrs. After cooling to room temperature water was added (0.15 mL). This mixture was combined with 3 (1.4 g, 5.1 mmol), Pd(PPh3)4 (0.6 g, 0.5 mmol), and potassium phosphate tribasic (7 g) in a round bottom flask with stirring. The reaction was heated at reflux for 18h, filtered, and the solvent was removed under vacuum. The residue was dissolved in ethyl acetate and purified via gel filtration (eluted with hexane:ethyl acetate (20:1)) to give 5 as a white solid (0.877 g, 41 % yield). 1H NMR (500 MHz, CDCl3) δ 8.34-8.36 (dd, 1H, J = 1.7, 8.0 Hz), 8.13 (s, 1H), 7.70-7.74 (ddd, 1H, J = 1.8, 7.1, 8.7 Hz), 7.54-7.57 (dd, 1H, J = 2.3, 8.6 Hz), 7.48-7.50 (d, 1H, J = 8.6 Hz), 7.41-7.43 (d, 1H, J = 8.6 Hz), 7.36-7.41 (ddd, 1H, J = 1.0, 7.1, 8.0 Hz), 3.66 (s, 3H), 2.71-2.75 (m, 2H), 2.28-2.31 (t, 2H, J = 7.6 Hz), 1.55-1.67 (qd, 4H, J = 7.6, 15.1 Hz), 1.25-1.35 (m, 12H).
11-(9-Oxo-9H-xanthen-2-yl)undecanoic acid (6)
5 (0.877 g, 2.2 mmol) was suspended in MeOH (50 mL) with stirring. NaOH (2 g) dissolved in H2O (10 mL) was added to the suspension. This mixture was refluxed for 4 h, poured over ice, and made acidic using concentrated HCl. The solid was collected via filtration to give acid 6 (0.714 g, 86% yield). 1H NMR (500 MHz, CDCl3) δ 8.34-8.36 (dd, 1H, J = 1.6, 8.0 Hz), 8.14 (d, 1H, J = 2.2 Hz), 7.70-7.74 (ddd, 1H, J = 1.7, 7.2, 8.7 Hz), 7.54-7.57 (dd, 1H, J = 2.3, 8.6 Hz), 7.48-7.50 (d, 1H, J = 8.0 Hz), 7.41-7.43 (d, 1H, J = 8.5 Hz), 7.35-7.39 (t, 1H, J = 8.0 Hz), 2.71-2.75 (m, 2H), 2.33-2.37 (t, 2H, J = 7.5 Hz), 1.59-1.69 (m, 4H), 1.23-1.37 (m, 12H). HRMS (ESI) calcd for C24H27O4- ([M-H]−) 379.1915, found 379.1919
11-(9-Oxo-9H-xanthen-2-yl)undecanoic acid N-hydroxy-succinamide ester (7)
6 (0.75 g, 1.97 mmol), DIPEA (0.1 mL), DMAP (cat.), N-hydroxysuccinimide (0.45 g, 3.9 mmol), and EDC (1-(3-(dimethylamino)propyl)-3-ethylcarbodiimide hydrochloride, (0.60 g, 3.15 mmol) were dissolved in THF:CH2Cl2 (2:1, 75 mL) and stirred for 24 hours. The solution was washed with water (60 mL) and saturated aq. sodium bicarbonate (60 mL), followed by NaCl (60 mL). The organic layer was dried over anhydrous sodium sulfate and removed under vacuum to give the product (0.94 g, 99% yield). 1H NMR (500 MHz, CDCl3) δ 8.34-8.36 (dd, 1H, J = 1.7, 8.0 Hz), 8.13 (d, 1H, J = 2.2 Hz), 7.70-7.74 (ddd, 1H, J = 1.7, 7.1, 8.6 Hz), 7.55-7.57 (dd, 1H, J = 2.2, 8.6 Hz), 7.48-7.50 (d, 1H, J = 8.5 Hz), 7.42-7.43 (d, 1H, J = 8.6 Hz), 7.36-7.39 (m, 1H), 2.85 (m, 4H) 2.71-2.74 (m, 2H), 2.58-2.61 (t, 2H, J = 7.5 Hz), 1.64-1.76 (m, 4H), 1.25-1.43 (m, 12H).
11-(11-(9-Oxo-9H-xanthen-2-yl)undecanamido)undecanoic acid (8)
7 (1.31 g, 5.8 mmol) was dissolved in DMF (30 mL), 11-aminoundecanoic acid (2.36 g, 11.7 mmol), NEt3 (0.2 mL), and DMAP (cat.) were added and the reaction was heated at 100 °C overnight with stirring. The reaction was poured over ice and the product was collected by filtration and purified by gel filtration (eluted with 7% MeOH in CH2Cl2) to give acid 8 (0.62 g, 20 % yield). 1H NMR (500 MHz, CDCl3) 8 8.25-8.27 (d, 1H, J = 8.0 Hz), 8.04 (s, 1H), 7.67-7.70 (t, 1H, J = 7.8 Hz), 7.51-7.53 (dd, 1H, J = 1.9, 8.6 Hz), 7.44-7.46 (d, 1H, J = 8.5 Hz), 7.38-7.39 (d, 1H, J = 8.6 Hz), 7.31-7.34 (t, 1H, J = 7.5 Hz), 3.11-3.14 (t, 2H, J = 7.2 Hz), 2.65-2.68 (m, 2H), 2.20-2.23 (t, 2H, J = 7.5 Hz), 2.07-2.10 (t, 2H, J = 7.6 Hz), 1.51-1.62 (m, 8H),1.35-1.43 (m, 4H) 1.10-1.25 (m, 20H).
11-(11-(9-Oxo-9H-xanthen-2-yl)undecanamido)undecanoic acid N-hydroxysuccinamide ester (9)
A mixture of acid 8 (0.5 g, 0.89 mmol), NEt3 (0.05 mL), DMAP (cat), N-hydroxysuccinimide (0.154 g, 1.3 mmol), and EDC (1-(3-(dimethylamino)propyl)-3-ethylcarbodiimide hydrochloride, (0.204 g, 1.1 mmol) was dissolved in DMF (15 mL) and stirred for 24 hours. The solvent was removed under vacuum. The product was dissolved in CH2Cl2 and purified by gel filtration eluted with DCM (50 mL) and then 10% MeOD in CH2Cl2 (100 mL) to give pure NHS ester 9 (0.135 g, 23% Yield). 1H NMR (500 MHz, CDCl3) δ 8.34-8.36 (d, 1H, J = 1.7, 8.0 Hz), 8.14 (d, 1H, J = 2.2 Hz), 7.70-7.74 (ddd, 1H, J = 1.7, 7.1, 8.6 Hz), 7.55-7.57 (dd, 1H, J = 2.2, 8.5 Hz), 7.49-7.50 (d, 1H, J = 8.4 Hz), 7.42-7.44 (d, 1H, J = 8.5 Hz), 7.36-7.39 (t, 1H, J = 7.5 Hz), 3.21-3.25 (dd, 2H, J = 7.0, 13.1 Hz), 2.71-2.74 (m, 2H), 2.58-2.61 (t, 2H, J = 2.5, 7.5 Hz), 2.13-2.16 (m, 2H), 1.70-1.76 (dt, 2H, J = 7.5, 15.2), 1.60-1.68 (m, 6H),1.46-1.50 (m, 2H) 1.22-1.43 (m, 22H).
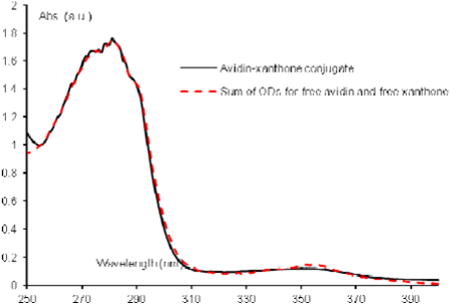
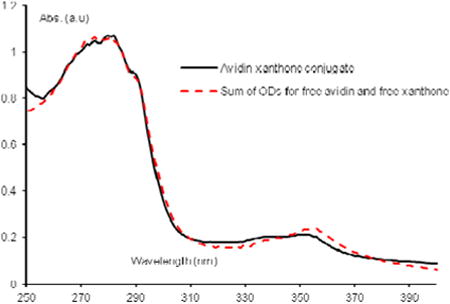
General procedure for avidin-xanthone conjugation
Avidin (5 mg, 74 nmol), purchased from Invitrogen or Pierce Biotechnology (now ThermoScientific) was dissovled in PBS (0.01 M, pH 8.0, 1 mL). The appropriate xanthone-NHS ester was dissolved in DMSO (0.5 mg/1 mL) over 1 hour at room temperature and 100 μL was added to the avidin solution. The resulting mixture was shaken gently for one hour at room temperature, a second 100 μL aliquot of xanthone-NHS in DMSO was added, and the reaction was left with shaking for 48 hours. It was then purified on a Sephadex G-25 column (to 2.5 g of Sephadex G-25, purchased from Aldrich, was added a 0.01 M PBS to make a slurry, this slurry was poured into the appropriate column, the mixture was added and eluted with the phosphate buffer). 16 fractions (1 mL each) were collected and tested by UV/Vis spectrophotometry. The conjugated avidin was generally found between fractions 3 and 8 containing the product with an average of 2 to 3 xanthone molecules per avidin. The Solver in Microsoft Excel was used to carry out a least squares analysis between a model system (a fit the sum of OD's for free ketone and protein, at known concentrations) and the actual UV/Vis spectrum of a fraction of the conjugated protein. The solver determined the relative concentrations of ketone and avidin present in the conjugate, from which the ratio could be taken to determine the number of coupled xanthone molecules per avidin. Each avidin generally carried between 3 and 5 xanthones, depending on the experiment and the fraction. The actual concentration of xanthone (ε365 = 635) within the conjugate was determined and from this the approximate concentration of avidin was calculated for each fraction. Avidin for each binding experiment was then diluted from these fractions.
Avidin-(7) conjugation
Prepared with 7. Each avidin tetramer carries approximately 2 to 3 xanthone molecules. The concentration of xanthone was calculated to be 1.4×10⁻⁴ M, from this it was determined the approximate concentration of avidin was 8×10⁻⁵ M. This fraction was diluted to the appropriate concentrations as indicated in the text before use.
Avidin-(9) conjugation
Prepared with 9. Each avidin tetramer carries approximately 3 to 4 xanthone molecules. The concentration of xanthone was calculated to be 1.4×10⁻⁴ M, from this it was determined the approximate concentration of avidin was 8×10⁻⁵ M. This fraction was diluted to the appropriate concentrations as indicated in the text before use.
7-diethylaminocoumarin-3-carboxylic acid (10)
A mixture containing ethanol (20 mL), 4-diethylamino salicylaldehyde (5.0 g, 26 mmol), Meldrum's Acid (3.7 g, 26 mmol), piperidine (0.40 mL), and acetic acid (0.80 mL) was allowed to react at room temperature for 30 min and then refluxed for 4 hours with stirring. The mixture was cooled to room temperature and chilled in an ice bath for 1.5 h to precipitate the product, a bright orange solid. The solid was filtered and washed with ice cold ethanol to give pure coumarin (5.10 g, 75% yield). 1H NMR (CDCl3, 500 MHz): δ 8.66 (s, 1H), 7.44-7.46 (d, 1H, J=9.08 Hz), 6.69-6.72 (dd, 1H, J=2.48, 9.03 Hz), 6.53 (d, 1H, J=2.47 Hz), 3.46-3.51 (q, 4H, J=7.16, 14.30 Hz), 1.24-1.28 (t, 6H, J=7.15 Hz).
Photobleaching of diethylaminocoumarins
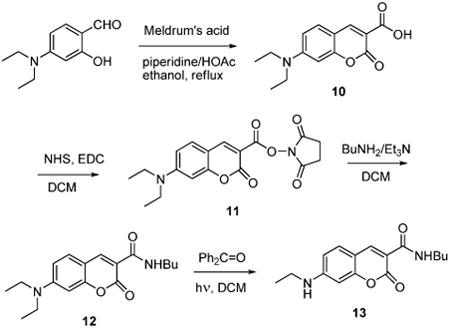
7-diethylaminocoumarin-3-carboxylic acid N-hydroxy-succinamide ester (11)
10 (1.0 g, 3.8 mmol) was dissolved in dichloromethane (50 mL), N-hydroxysuccinimide (0.66 g, 5.7 mmol) and EDC (0.87 g, 4.6 mmol) were added. The reaction mixture was stirred overnight at room temperature. The solution was dilluted with water (30 mL), extracted with ethyl acetate (2 × 30 mL), washed with sodium bicarbonate solution (2×30 mL), and brine (30 mL). The organic layer was collected and evaporated under vacuum to give a bright yellow solid (1.41 g, 99% yield). 1H NMR (CDCl3, 500 MHz): δ 8.58 (s, 1H), 7.36-7.38 (d, 1H, J=9.04 Hz), 6.62-6.64 (dd, 1H, J=2.5, 9.0Hz), 6.46 (d, 1H, J=2.42 Hz), 3.44-3.51 (q, 4H, J=7.14, 14.29 Hz), 2.88 (s, 4H), 1.55 (s, 4H), 1.24-1.28 (t, 6H, J=7.15 Hz).
N-butyl-7-diethylaminocoumarin-3-carboxamide (12)
11 (0.30 g, 0.84 mmol) was added to a solution of n-butylamine (0.11 mL, 1.1 mmol) and NEt3 (0.15 mL) in dichloromethane (15 mL). The reaction was left overnight at room temperature before being poured into 5% aq. HCl (25 mL), extracted with dichloromethane (2 × 30 mL), and washed with saturated aq. NaHCO3 (25 mL). The organic layer was collected, dried over anhydrous sodium sulfate, and removed under vacuum to give the product (0.20 g, 75% yield). 1H NMR (CDCl3, 500 MHz): δ 8.79-8.83 (t, 1H, J = 5.86 Hz), 8.73 (s, 1H), 7.45-7.46 (d, 1H, J = 8.95 Hz), 7.29 (s, 1H), 3.44-3.53 (m, 6H), 1.60-1.66 (m, 2H), 1.41-1.48 (dq, 2H, J = 7.31, 7.35, 14.66 Hz), 1.25-1.28 (t, 6H, J = 7.13 Hz), 0.96-0.99 (t, 3H, J = 7.36 Hz). 13C NMR (CDCl3, 400 MHz): δ 163.20, 162.98, 157.63, 152.63, 148.14, 131.25, 110.78, 110.07, 108.61, 96.78, 45.25, 39.58, 31.85, 20.44, 14.00, 12.63.
N-butyl-7-ethylaminocoumarin-3-carboxamide (13)
Coumarin 12 (0.30 g, 0.95 mmol) and benzophenone (0.364 g, 2.0 mmol) were dissolved in CH2Cl2 (150 mL) and then irradiated with stirring using 4 - 365nm LED's. The reaction mixture was reacted for 72 hours. The product was purified by column chromatography (gradient of methanol in CH2Cl2 from 0 to 7%). 27 mg of the ethyl product was obtained. 1H NMR (CD3CN, 500 MHz): δ 8.65 (s, 1H), 8.63 (s, 1H), 7.46-7.48 (d, 1H, J = 8.68 Hz), 6.63-6.65 (d, 1H, J = 8.69 Hz), 6.45 (s, 1H), 3.33-3.37 (dd, 2H, J = 6.9, 12.9 Hz), 3.21-3.23 (m, 2H), 1.52-1.55 (m, 2H), 1.35-1.40 (dd, 2H, J = 7.5, 14.9 Hz), 1.21-1.24 (t, 3H, J = 7.2 Hz), 0.92-0.95 (t, 3H, J = 7.4 Hz).
Amplified fluorescence turn off experiment with terphenyl as the fluorophore
Three 3 mL volume fluorescence cells were each loaded with 1.5 mL of 30 mM solution of benzophenone-dithiane adduct 1 and 2 μM p-terphenyl. Two of these cells were also spiked with a stock solution of benzophenone to bring its concentration to 1 μM and 100 nM. The third cell contained no added seed benzophenone. Before irradiation the emission intensity at λEM=340nm was measured using Cary Eclipse fluorimeter (λEX=300nm) in all three cells. The cells were irradiated in an in-house built carousel photo irradiator using 365nm UV LEDs. Every 10 min the samples' emission at 340nm was measured in a fluorimeter. The normalized emission values are plotted in Figure 6.
Biphasic amplified fluorescence turn off experiment with Coumarin 6 in the presence of a PBS buffer
Two cuvettes were prepared with 1 mL of 30 mM solution of benzophenone-dithiane adduct 1 in dichloromethane containing 1 μM coumarin 6 and either seeded with 1μM benzophenone or without benzophenone were placed into one quartz fluorescence cell. To this solution 1 mL of 0.05 M PBS buffer (pH=7.5) was added. The biphasic mixture was irradiated using the 365nm 250 mW UV LED (Nichia). Every five minutes the irradiation was interrupted, the cell was placed in the Cary Eclipse fluorimeter and a full fluorescence spectrum of the organic layer was acquired with λEX= 450 nm excitation wavelength. Significant decrease in fluorescence was observed. The graph for this fluorescence turn off experiment is shown in Figure 9 with benzophenone and Figure 10 to compare both samples.
Solvent Selection for Photoassay
All solvents in Table 1 were freshly distilled before use. Bulk photo reactions were carried out as described above for terphenyl as a fluorophore, with the exception that the fluorophore used was 1 μM Coumarin 6 and seeded with 1μM benzophenone. The normalized emission values were plotted in the same manner as Figure 6 and the maximum difference between normalized emission intensity was determined for each solvents.
Biotin-Avidin Binding in Bulk Soution(as shown in Figure 12) The procedure for Biphasic amplified fluorescence turn off experiment with Coumarin 6 in the presence of a PBS buffer was utilized with the following changes. 1) in place of benzophenone the biotinylated lipid (A and B) or phosphotidyl choline (C and D) were added to the PPG-protected benzophenone in 1,4-dichlorobutane at 9.5×10⁻⁵ M. To these solutions was added PBS with (A and C) or without (B and D) Avidin-Xanthone conjugate.
Biotin-Avidin Binding in Capillaries
0.86 mm ID Capillary Cassettes
Sealed capillary reactor cassettes were prepared by drawing OD: 1.5 × ID: 0.86 mm capillary tubes from AM Systems glass to a 15 μm point on a Sutter Instrument Co. flaming brown micropipette puller model #P97 using a 3 mm box filament with program P=500 (Heat = 515, Vel = 20, Del = 1). The 15 μm end was then flame sealed for approximately 20 seconds and the capillaries were cut to 2.5 cm in length. 10 sealed capillaries were assembled around a center rod and then bound by heat shrink tubing to create a cassette. Each pore of the cassette was filled with the solution of interest by hand using a Hamilton 10 μL gas-tight syringe. The buffer was then added to the top of the solution by putting the tip of the syringe just below the solvent line and then injecting the buffer solution containing avidin.
0.4 mm ID Capillary Cassettes
Open capillary reactor cassettes were prepared by cutting OD: 0.6 × ID: 0.4 mm capillary tubes from AM Systems glass to 2 cm in length. 13 capillaries were assembled around a Steel 13T: RS4 Micro pinion gear from hobby products international using IC gel super glue to create a cassette. Each pore of the cassette was filled first with the buffer containing the avidin-xanthone conjugate and then with the solution of interest, both by capillary forces.
The capillaries were filled with (1) Coumarin 6 (10−5 M), DT-BP adduct recrystallized 7 times in DCM:Hexane (1:3) (30 mM) and 1,2-dipalmitoyl-sn-glycero-3-phosphoethanolamine-N-(cap biotinyl)(sodium salt) (biotin capped lipid) in 1,4-dichlorobutane; and then (2) a solution of avidin in PBS at the appropriate concentration from 10 nM to 10 pM and incubated before irradiation. An initial FL image was taken then the cassette was irradiated using 2-365 nm LEDs outfitted with a 300-400 nm long pass filter. Fluorescence images were used to monitor the reaction over the complete reaction time.
Camera Phone Imaging
The imaging of the capillaries prior to the amplified fluorescence turn-off assay can be realized with such low sensitivity devices and cell phone cameras. A standard, off the shelf Motorola Droid with a 5.0 MP Bayer coated (Color) CMOS sensor was used for imaging. The contrast ratio was achieved by setting the phone into “night time” mode and the focus set to macro mode. To determine approximate detection limit for C6 (i.e. the capability to confidently image/detect the pre-amplification spot), both 0.86 and 0.4 mm ID capillaries were filled with decreasing volumes of 10−5 M C6 in 1,4-dichlorobutane: (i) 0.86 mm capillary with 4 μL of the fluorophore solution; (ii) 0.4 mm capillary with 0.4 μL fluorophore solution; (iii) 0.4 mm capillary with 0.1μL fluorophore solution.
The images were acquired through a 550±5 nm bandpass filter by simply illuminating the capillaries with a 400nm (12mW) excitation LED from the side as shown in Figure SX. A control, with one capillary filled with the solution of the fluorophore and another – with blank solvent, showed no image of the blank solvent solution, indicating that in this simplified design scattering is not an issue and the dichroic mirror is not required.
Supplementary Material
Fig. 5.

p-Terphenyl (left) and quaterphenyl.
Acknowledgments
Support of this research by the NIH (NIBIB R21 EB008532) is gratefully acknowledged.
Footnotes
Electronic Supplementary Information (ESI) available: NMR spectra and animated gif files for 2D amplification modeling. See DOI: 10.1039/b000000x/
References
- 1.For a historical overview see Lequin RM. Enzyme Immunoassay (EIA)/Enzyme-Linked Immunosorbent Assay (ELISA) Clinical Chem. 2005;51:2415. doi: 10.1373/clinchem.2005.051532.
- 2.(a) Eglen RM, Reisine T, Roby P, Rouleau N, Illy C, Bossé R, Bielefeld M. The use of AlphaScreen technology in HTS: current status. Curr Chem Genomics. 2008;1:2. doi: 10.2174/1875397300801010002. [DOI] [PMC free article] [PubMed] [Google Scholar]; (b) Bielefeld-Sevigny M. AlphaLISA Immunoassay Platform –The “No-Wash” High-Throughput Alternative to ELISA. ASSAY and Drug Development Technologies. 2009;7:90. doi: 10.1089/adt.2009.9996. [DOI] [PubMed] [Google Scholar]
- 3.(a) Gianneschi NC, Nguyen ST, Mirkin CA. Signal Amplification and Detection via a Supramolecular Allosteric Catalyst. J Am Chem Soc. 2005;127:1644. doi: 10.1021/ja0437306. [DOI] [PubMed] [Google Scholar]; (b) Masar MS, III, Gianneschi NC, Oliveri CG, Stern CL, Nguyen ST, Mirkin CA. Allosterically Regulated Supramolecular Catalysis of Acyl Transfer Reactions for Signal Amplification and Detection of Small Molecules. J Am Chem Soc. 2007;129:10149. doi: 10.1021/ja0711516. [DOI] [PubMed] [Google Scholar]
- 4.(a) Sikes HD, Hansen RR, Johnson LM, Jenison R, Birks JW, Rowlen KL, et al. Using polymeric materials to generate an amplified response to molecular recognition events. Nature Mater. 2008;7:52. doi: 10.1038/nmat2042. [DOI] [PMC free article] [PubMed] [Google Scholar]; (b) Avens HJ, Bowman CN. Development of fluorescent polymerization-based signal amplification for sensitive and non-enzymatic biodetection in antibody microarrays. Acta Biomaterialia. 2010;6:83. doi: 10.1016/j.actbio.2009.06.008. [DOI] [PMC free article] [PubMed] [Google Scholar]
- 5.For a hybrid enzymatic methodology augmented with polymerization-based amplification see: Berron BJ, Johnson LM, Ba X, McCall JD, Alvey NJ, Anseth KS, Bowman CN. Glucose Oxidase-Mediated Polymerization as a Platform for Dual-Mode Signal Amplification and Biodetection. Biotech & Bioeng. 2011;108:1521. doi: 10.1002/bit.23101.
- 6.Corey EJ, Seebach D. Carbanions of 1,3-dithianes. Reagents for C-C bond formation by nucleophilic displacement and carbonyl addition. Angew Chem Int Ed Engl. 1965;4:1075. For a review see: Gröbel BT, Seebach D. Umpolung of the reactivity of carbonyl compounds through sulfur-containing reagents. Synthesis. 1977:357.
- 7.McHale WA, Kutateladze AG. An Efficient Photo-SET-Induced Cleavage of Dithiane-Carbonyl Adducts and Its Relevance to the Development of Photoremovable Protecting Groups for Ketones and Aldehydes. J Org Chem. 1998;63:9924. [Google Scholar]
- 8.Kottani R, Valiulin RA, Kutateladze AG. Direct Screening of Solution Phase Combinatorial Libraries Encoded with Externally Sensitized Photolabile Tags. Proc Natl Acad Sci USA. 2006;103:13917. doi: 10.1073/pnas.0606380103. [DOI] [PMC free article] [PubMed] [Google Scholar]
- 9.Kottani RR, Majjigapu JRR, Kurchan AN, Majjigapu K, Gustafson TP, Kutateladze AG. Photoinduced Signal Amplification Through Controlled Externally Sensitized Fragmentation in Masked Sensitizers. J Am Chem Soc. 2006;128:14794. doi: 10.1021/ja066692u. [DOI] [PMC free article] [PubMed] [Google Scholar]
- 10.Majjigapu K, Majjigapu JRR, Kutateladze AG. Photoamplification and Multiple Tag Release in a Linear Peptide-Based Array of Dithiane Adducts. Angew Chem. 2007;46:6137. doi: 10.1002/anie.200701512. [DOI] [PMC free article] [PubMed] [Google Scholar]
- 11.For the initial communication see: Gustafson TP, Metzel GA, Kutateladze AG. Photochemically Amplified Detection of Molecular Recognition Events: An Ultra-Sensitive Fluorescence Turn-Off Binding Assay. Org Biomol Chem. 2011;9:4752. doi: 10.1039/c1ob05289f.
- 12.Wolf MW, Legg KD, Brown RE, Singer LA, Parks JH. Photophysical studies on the benzophenones. Prompt and delayed fluorescences and self-quenching. J Am Chem Soc. 1975;97:4490. [Google Scholar]
- 13.Vath P, Falvey DE, Barnhurst LA, Kutateladze AG. Photoinduced C-C Bond Cleavage in Dithiane-Carbonyl Adducts: A Laser Flash Photolysis Study. J Org Chem. 2001;66:2887. doi: 10.1021/jo010102n. [DOI] [PubMed] [Google Scholar]
- 14.The term Markov chain is used here to indicate that we limited our numerical model to a random walk process where the next step is defined by the current state of the system (not by the history of events leading to the current state of the system). For the overview of numerical modelling see: Stewart WJ. Introduction to the Numerical Solution of Markov Chains. Princeton Univ. Press; 1994.
- 15.Berlman IB. Handbook of Fluorescence Spectra of Aromatic Molecules. Academic Press; 1971. [Google Scholar]
- 16.Bücher H, Chow W. A 1 MWP-terphenyl dye laser. Applied Phys. 1977;13:267. [Google Scholar]
- 17.Nijegorodov NI, Downey WS, Danailov MB. Systematic investigation of absorption, fluorescence and laser properties of some p- and m-oligophenylenes. Spectrochimica Acta Part A-Mol Biomol Spectroscopy. 2000;56:783. doi: 10.1016/s1386-1425(99)00167-5. [DOI] [PubMed] [Google Scholar]
- 18.A reviewer suggested that the mistriggering of the amplification cascade in the absence of benzophenone could also be due to a complex with oxygen. Most of our initial bulk experiments were carried out after 4-5 freeze-thaw degassing cycles; yet, after some induction period samples not seeded with benzophenone exhibited amplified fluorescence quenching. It is believed that the freeze-thaw degassing lowers the concentration of oxygen to the ppb levels. Since benzophenone itself is capable of initiating the amplification cascade at ppb levels, it is difficult to assess the feasibility of oxygen triggering the fragmentation at these low levels.
- 19.For manufacturer's specs see: http://www.nichia.com/specification/en/product/led/NCSU033B-E.pdf
- 20.(a) Jones G, Griffin SF, Choi CY, Bergmark WR. Electron donor-acceptor quenching and photoinduced electron transfer for coumarin dyes. J Org Chem. 1984;49:2705. [Google Scholar]; (b) Jones G, Bergmark WR. Photodegradation of coumarin laser dyes: an unexpected singlet self-quenching mechanism. J Photochem. 1984;26:179. [Google Scholar]; (c) Gray P, Williams A. Chem Rev. 1959;59:239. [Google Scholar]
- 21.Pal A, Dass G. Excess molar volumes and viscosities of binary mixtures of tetraethylene glycol dimethyl ether (tetraglyme) with chloroalkanes at 298.15 K. J Mol Liq. 2000;89:327. [Google Scholar]
- 22.Lafuente C, Artigas H, Pardo J, Royo FM, Urieta JS. Viscosities of 1-chlorobutane and 1,4-dichlorobutane with isomeric butanols at 25 and 40°C. J Solution Chem. 1996;25:303. [Google Scholar]
Associated Data
This section collects any data citations, data availability statements, or supplementary materials included in this article.