

Abstract
Rhodopsin is a cilia-specific GPCR essential for vision. Rhodopsin mislocalization is associated with blinding diseases called retinal ciliopathies. The mechanism by which rhodopsin mislocalizes in rod photoreceptor neurons is not well understood. Therefore, we investigated the roles of trafficking signals in rhodopsin mislocalization. Rhodopsin and its truncation mutants were fused to a photoconvertible fluorescent protein, Dendra2, and expressed in Xenopus laevis rod photoreceptors. Photoconversion of Dendra2 causes a color change from green to red, enabling visualization of the dynamic events associated with rhodopsin trafficking and renewal. We found that rhodopsin mislocalization is a facilitated process for which a signal located within 322–326 aa (CCGKN) is essential. An additional signal within 327–336 aa further facilitated the mislocalization. This collective mistrafficking signal confers toxicity to rhodopsin and causes mislocalization when the VXPX cilia-targeting motif is absent. We also determined that the VXPX motif neutralizes this mistrafficking signal, enhances ciliary targeting at least 10-fold, and accelerates trafficking of post-Golgi vesicular structures. In the absence of the VXPX motif, mislocalized rhodopsin is actively cleared through secretion of vesicles into the extracellular milieu. Therefore, this study unveiled the multiple roles of trafficking signals in rhodopsin localization and renewal.
Introduction
Defects in primary cilia functions lead to a highly heterogeneous group of disorders called ciliopathies, with symptoms including brain malformation, kidney dysfunction, obesity, and blindness. Ciliopathies are frequently caused by defects in ciliary protein trafficking. Among the primary cilia in the body, the most active protein trafficking is that of photoreceptor sensory cilia of rod photoreceptor neurons (rods). The tip of the photoreceptor sensory cilium forms a specialized structure, the outer segment (OS). The OS accommodates a high concentration of rhodopsin (∼4 mm; Nickell et al., 2007) for efficient photon capture. Currently, it is unclear how such a high concentration of rhodopsin can be accomplished by protein trafficking mechanisms in the photoreceptor neurons. Efforts in the past two decades underscore the important role of the last four amino acids of rhodopsin, VXPX (Deretic, 2006; Sung and Chuang, 2010), which serves as a cilia-targeting signal and is observed in other cilia-localized proteins (Luo et al., 2004; Geng et al., 2006; Jenkins et al., 2006; Ward et al., 2011).
Deficiencies in the C-terminal VXPX signal lead to rod degeneration and blindness via mistrafficking and mislocalization of rhodopsin (Li et al., 1996; Tam et al., 2006; Concepcion and Chen, 2010). The C-terminal tail region of rhodopsin appears to play multiple roles in trafficking and accordingly interacts with a small GTPase, Arf4 (Deretic et al., 2005); TcTex-1 dynein light chain (Tai et al., 1999); and SARA, a protein involved in specific vesicular targeting (Chuang et al., 2007). Furthermore, in addition to the VXPX motif, the rhodopsin C-terminal tail appears to contain other signals for trafficking (Chuang and Sung, 1998; Deretic, 2006; Wang et al., 2012). Those observations led to a hypothesis that, in the absence of the primary VXPX motif, miscoordination of the other trafficking signals contributes to rhodopsin mislocalization.
Under normal conditions, active synthesis of rhodopsin is balanced with its decomposition by phagocytosis of the distal OS by neighboring retinal pigment epithelial (RPE) cells (Young and Bok, 1969; Williams and Fisher, 1987). Under pathological conditions, mislocalized rhodopsin sequesters in plasma membrane locations that cannot access the RPE cells. If rhodopsin clearance is compromised due to lack of access to the phagocytosis machinery, overaccumulation of rhodopsin leads to misregulation of protein quantity and quality control mechanisms. If rhodopsin is cleared from the aberrant plasma membrane locations, such clearance must involve a mechanism distinct from the conventional shedding of the distal OS.
Using Xenopus laevis rods as a model, we studied the role of a C-terminal targeting motif(s) for cilia-targeting efficacy. Compromised cilia targeting leads to mislocalization by sorting of rhodopsin to non-OS plasma membrane locations. By investigating sorting signal(s) for rhodopsin trafficking, we tested a hypothesis that rhodopsin mislocalization is a facilitated, not a default, process. We then studied a cellular mechanism to renew and clear rhodopsins that were aberrantly localized to membranes with no access to the RPE cells. These studies provide novel insights into rhodopsin trafficking and mistrafficking that are coordinated by multiple sorting signals.
Materials and Methods
DNA expression vectors.
DNA expression vectors were generated by standard methods combining PCR, DNA recombination, and QuikChange techniques. Sequences of the DNA expression vectors were confirmed (Biotic Solutions). The coding region of Rho-Dend2-1D4 consists of the full-length human rhodopsin cDNA fused to Dendra2 (Dend2) (Clontech Laboratories), followed by the last 8 aa of human rhodopsin (the 1D4 epitope). This coding region was inserted into the pXOP-5HTR-EGFP-RHO15 expression vector after removal of the 5HTR-EGFP-RHO15 sequence, so that expression of Rho-Dend2-1D4 is driven by the X. laevis opsin gene promoter (pXOP; Batni et al., 1996; Knox et al., 1998). An SV40 polyadenylation signal was added downstream of the 1D4 epitope (Zhang et al., 2005). Two I-SceI sequences, 18 base pairs each, were added upstream of the XOP sequence and downstream of the SV40 polyadenylation signal, respectively, to readily excise and purify the region encompassing the XOP, coding region, and polyadenylation sequence for our transgenic procedure. We introduced a variety of mutations to our rhodopsin vector by QuikChange site-directed mutagenesis (Agilent Technologies) and DNA recombination techniques. To generate RhoQ344Ter-Dend2, the QVAPA sequence at the end of the human rhodopsin gene and before Dend2 was removed. The 1D4 epitope after Dend2 was also removed because the 1D4 epitope contains the QVAPA sequence. To generate Rho-Dend2, the 1D4 epitope after Dend2 was removed. The Rho-Dend2 vector served as the backbone for the following rhodopsin truncation mutants: Rho1-310-Dend2, Rho1-316-Dend2, Rho1-321-Dend2, Rho1-326-Dend2, and Rho1-336-Dend2. The 1D4 epitope was added to Rho1-316-Dend2 to create Rho1-316-Dend2–1D4 and to RhoQ344Ter-Dend2 to create RhoQ344Ter-Dend2–1D4. To generate MyrPalm-Dend2, MyrPalm-Dend2-bPRPH312-346 was synthesized by GenScript and inserted into a TOPO vector between the pXOP and the SV40 polyadenylation signal using NheI and AflII. The bPRPH312-346 sequence was removed by BstI and ClaI, which can ligate to each other. As with the rhodopsin vectors used in this study, I-SceI sequences flanked the XOP and the SV40 polyadenylation signal. The vector used in our Golgi colocalization experiment contains an X. laevis rod arrestin proximal promoter, the human β-1,4-galactosyltransferase 1(1-61) gene and the mTurquoise2 fluorescent protein. To create this vector, we obtained the pmTurquoise2-Golgi vector from Addgene (plasmid 36205; Goedhart et al., 2012). This vector contains a trans-Golgi glycosyltransferase, the β-1,4-galactosyltransferase 1 (1-61) gene, and mTurquoise2. X. laevis genomic DNA was the source of the arrestin promoter. As with the rhodopsin vectors used in this study, I-SceI sequences flanked the arrestin promoter and the SV40 polyadenylation signal.
Animals.
All animal procedures were approved by the institutional animal care and use committee at Case Western Reserve University and were performed in accordance with the Association for Research in Vision and Ophthalmology Statement for the Use of Animals in Ophthalmic and Vision Research. Adult female (9+ cm) and male (7.5 cm) albino X. laevis frogs were purchased from Nasco. Frogs were housed at 16°C under a 12/12 h light/dark cycle. All tadpoles used for experiments were <1 month old and were housed in a 16°C incubator.
Transgenesis of X. laevis.
Transgenic X. laevis were generated using the intracytoplasmic sperm injection method (Sparrow et al., 2000; Smith et al., 2006), which is a modified version of the restriction-enzyme-mediated integration method developed by Kroll and Amaya (Kroll and Amaya, 1996; Amaya and Kroll, 1999). Injected eggs were housed at 16°C. Nondividing eggs were removed daily until 8 d after fertilization, when the tadpoles were screened for the presence of green fluorescence in their eyes using a Leica MZ16F fluorescence stereoscope. Tadpoles were divided into three categories, light, medium, and bright, according to the intensity of green fluorescence in their eyes. To avoid any photobleaching of fluorescent proteins and possible light-dependent degeneration, transgenic tadpoles were reared in the dark.
Photoconversion of Dend2 in tadpole eyes.
Tadpoles were anesthetized in 0.026% tricaine methanesulfonate MS-222 (Sigma-Aldrich) then placed in 6% methyl cellulose (Sigma-Aldrich). A 405 nm light source was directed at their heads for 15–20 min, with periodic breaks. Tadpoles that were dissected immediately after photoconversion were 9–14 d old (stage range of 41–47 with a mode of 43) at the time of photoconversion, and tadpoles that were dissected 2 or 6 d after photoconversion were either 9–10 d old (stage range of 41–46 with a mode of 43) or 21–22 d old (stage range of 45–50 with a mode of 47) at the time of photoconversion. All the tadpoles used in the experiments were staged as described previously (Nieuwkoop and Faber, 1967).
Retina culture.
Nonphotoconverted tadpoles were either 9–10 d old (stage range of 41–46 with a mode of 43; at these stages, rod cells were cone shaped; Kinney and Fisher, 1978) or 21–22 d old (stage range of 45–50 with a mode of 47; at these stages, rod cells were rod shaped) at time of decapitation. Photoconverted tadpoles were killed either immediately after, 2 d after, or 6 d after photoconversion. Tadpoles were placed in 0.26% tricaine methanesulfonate for 2–3 min followed by decapitation. Retinas were extracted from both eyes and placed in poly-d-lysine-coated 35 mm glass-bottom dishes (MatTek) on top of a coating of Cell-Tak (BD Biosciences) and held down by a custom-made weight. The weight was a donut-shaped stainless wire encased in biocompatible epoxy glue with a permeable membrane on one end that allowed cells access to gas and media while keeping them flat against the surface of the glass-bottom dish. Retinas were incubated in a modified version of Wolf amphibian culture medium (55% MEM; Invitrogen; 31% Earle's sodium-free BBS, 10% FBS, 30 mm NaHCO3, 700 mg/l, d-glucose) inside a sealed chamber (DMIRB/E ONICS-D35; Tokai Hit) that maintained the proper temperature, humidity, and gas concentrations (95% O2 and 5% CO2) on the microscope during the imaging procedures. Retinas were incubated for 1–5 h depending on the experiment.
Immunolabeling.
Tadpoles were anesthetized, decapitated, and their heads fixed in 4% PFA for 6 h at room temperature. To cryoprotect the tissues, the fixed heads were placed in phosphate buffer solutions with progressively higher concentrations of sucrose from 5–20% for 30 min each. The heads were then placed in a mixture of O.C.T. Compound (Tissue-Tek, Sakura Finetek) and 20% sucrose solution overnight at 4°C. Frozen heads were sectioned on a cryostat (CM1850; Leica) at −20°C. Sections (12 μm thick) were blocked in 1.5–5% normal goat serum diluted in PBS with either 0.1% or 0.5% v/v Triton X-100 (PBST). Primary antibody was applied to the sections for either 1 h at room temperature or overnight at 4°C. Secondary antibody was applied for 1 h at room temperature. Both antibodies were diluted in PBST. Sections were washed three times with PBST after incubation with each antibody. Primary antibodies used were a monoclonal anti-ATPase Na+/K+ α (1:500; DSHB), a polyclonal anti-early endosome marker (EEA1, 5 μg/ml; Abcam), a polyclonal anti-LAMP1 (10 μg/ml; Abcam), monoclonal anti-rhodopsin 11D5 (8 μg/ml, a kind gift from Dr. Dusanka Deretic, The University of New Mexico Health Sciences Center, Albuquerque, NM; Deretic and Papermaster, 1991), and a polyclonal anti-GFP (2 μg/ml; Novus). The anti-GFP was used to detect the mTurquoise2 fluorescent protein in the Golgi localization experiment. Secondary antibodies used were goat anti-mouse Cy3 and donkey anti-rabbit Cy3 (both at 7.5 μg/ml; Jackson ImmunoResearch Laboratories). Alexa Fluor 633-conjugated wheat germ agglutinin (Invitrogen) was applied at a concentration of 10 μg/ml and incubated overnight at room temperature in PBS with 0.5% v/v Triton X-100. Tadpoles used in these experiments were medium or bright in intensity and either 9–10 d old or 21–22 d old.
Confocal microscopy.
Living retinas and fixed retinal sections were imaged using the HCX PL APO CS 40.0× 1.25 oil UV objective of a Leica TCS SP2 laser scanning confocal microscope equipped with four lasers for excitation: a 488 nm argon ion, 543 nm HeNe, 633 nm HeNe, and a tunable Ti:Sapphire laser (Chameleon XR; Coherent Technologies). Images were acquired using Leica Confocal Software version 2.61. Leica Lite software was used to construct maximum projection images from z-stacks. All images used for fluorescence quantification were taken using the same laser power, zoom factor, image averaging, and resolution, but with different photomultiplier tube (PMT) settings in the acquisition software (see below for image analysis).
Electron microscopy.
Tadpole heads (14–15 d old, stage 45–46) were fixed in 4% w/v formaldehyde containing 0.1% w/v glutaraldehyde in 0.1 m HEPES buffer, pH 7.0 (Electron Microscopy Sciences) at room temperature for 6 h, then dehydrated in ethanol and embedded in LR White resin (Polysciences). Thin sections were blocked with PBS containing 1% w/v BSA, 1% v/v normal goat serum, and 0.01% v/v Tween 20 (PBGT). Grids were then incubated with antibody against Dend2 at a 1:50 dilution in PBGT for 12 h at 4°C. Negative controls included preimmune rabbit serum and PBGT in place of the primary antibody. After washing, grids were incubated for 1 h in 10 nm gold-conjugated goat anti-rabbit IgG (Ted Pella) diluted 1:30 in PBGT, rinsed with PBS, and fixed with glutaraldehyde to stabilize the gold particles. Gold-labeled thin sections were stained first with 2% uranyl acetate in 50% methyl alcohol at 38°C for 30 min, then with the triple lead stain of Sato as modified by Hanaichi et al. (1986), and then examined in a JEOL 1200EX electron microscope.
Expression and purification of 6xHis-Dend2.
The coding region of Dend2 was cloned into NcoI/HindIII sites of the expression pET-30a vector (Millipore). Fusion protein was expressed in the Escherichia coli BL21 (DE3) strain and induced by isopropyl-β-d-thiogalactoside (1 mm). His-tagged Dend2 was purified from cell lysates by using HisPur Ni-NTA resin (Thermo Scientific). The concentration of Dend2 in stock solution before (green) and after (red) photoconversion was determined by measuring absorbance at 490 and 553 nm, respectively (Δϵ490 = 45,000 m−1 cm−1 and Δϵ553 = 35,000 m−1 cm−1 (Chudakov et al., 2007a). Serial dilutions of Dend2 stock solutions before and after photoconversion were prepared and then visualized by confocal microscopy and analyzed by ImageJ and Cell Profiler. All measurements were done in triplicate. Calibration curves for Dend2 analysis were constructed by plotting average pixel intensity against known Dend2 concentrations.
Image analysis and quantification.
Levels of our protein of interest fused to Dend2 were quantified using MBF-ImageJ or Cell Profiler software (Carpenter et al., 2006). Individual z-stack images were used for quantification unless otherwise noted. For images quantified using ImageJ, images were loaded and the shape tools were used to encompass the regions of interest to be measured. Saturated cells were ignored using the hi-lo indicator. Background intensities for each image were taken with an n of 3 and subtracted from all measurements taken. All measurements were exported to Excel. For images quantified using Cell Profiler, images were first corrected for illumination using the CorrectIlluminationCalculate module. The integrated intensity of entire cells and the mean intensity of the OS were obtained using the IdentifyPrimaryObjects and IdentifyObjectsManually modules, respectively. Cells were identified as objects using the background threshold method and were usually defined as between 40 and 80 pixels in width. Objects that came into contact with the sides of the image were discarded. Objects that were not identified properly were not selected. Data were measured from confocal images using the MeasureObjectIntensity module and exported to Excel using the ExportToSpreadsheet module.
Once in Excel, the data from both ImageJ and Cell Profiler were normalized against a calibration curve as follows. To compare images taken at different PMT settings accurately in the Leica Confocal Software version 2.61, a calibration curve was generated by taking n = 3 measurements of 500 μm FITC (or rhodamine) at various PMT settings that were used when the original images were taken. The pixel intensity values were measured using ImageJ and averaged. This average was divided by the concentration of FITC to create a list of coefficients that could be applied to the raw pixel values of any image at any PMT to standardize the values to that concentration of FITC. Arbitrary intensity units measured for quantification were divided by these coefficients to keep the values standard regardless of which PMT setting was used to obtain them. To create a more accurate representation of the protein concentration in each cell, various dilutions of pure Dend2 protein were measured and then analyzed at 700 PMT. With a known Dend2 concentration and a known average pixel intensity value, an additional calibration curve was generated to convert all values from a standard concentration of FITC to an exact measurement of Dend2 protein (expressed as a micromolar concentration). The raw pixel values were divided by the coefficient for 700 PMT to have the same units as every other measurement taken using this system, and then a direct conversion from this standard to the empirically measured Dend2 concentrations was made possible by plotting Dend2 concentration versus standard FITC pixel intensity values.
Fluorescence intensities of extracellular vesicles were compared with those of the plasma membrane regions in 27- to 28-d-old RhoQ344Ter-Dend2, 6 d after photoconversion using ImageJ as follows. The maximum projections were used for this analysis because the projections allow us to take into account the brightest vesicles existing in the z-stacks. For simplicity, the green channel was depicted for this analysis; however, similar results were obtained in the red channel. A region of interest was defined and used to measure the average intensity values of the inner segment plasma membrane, extracellular vesicles, and punctate structures on the calyceal processes for each channel. Intensities were background subtracted and the average intensity of each region was normalized against the average intensity of the inner segment plasma membrane for each cell, making the value of each inner segment plasma membrane equal to 1, with all other values relative to it.
The surface plot in Figure 9F was generated using the Interactive 3D Surface Plot plugin for ImageJ. This plugin interprets the luminance of each pixel as the height for the plot. The maximum projection image (Fig. 9E) was used to create the surface plot and plugin parameters were selected to highlight the differences between cells with more or less active protein synthesis. Pixel luminance below an arbitrarily chosen threshold limit (84% in the software) does not appear on the plot. To display the varying degrees of pixel intensity of the calyceal processes and inner segments so that they are translated into easily distinguishable z-heights on the plot, the uppermost tips (on the z-axis) of the lines representing the most intense pixels on the plot are not shown.
Figure 9.

Attenuated mislocalization is concomitant with a downregulation of RhoQ344Ter-Dend2. A–D, Six days after photoconversion, relationships among the synthesis, mislocalization, and vesicle release of RhoQ344Ter-Dend2 were studied. A, Three cell types in one retina are seen: a cell with robust mislocalization in which more new proteins are mislocalized in the calyceal processes and IS (arrow, highlighted in B), a cell with intermediate mislocalization in which less new protein is delivered to the IS plasma membrane (solid arrowhead, highlighted in C), and a cell with marginal mislocalization in which new proteins were not delivered to the IS plasma membrane (asterisk, highlighted in D). Red, yellow, and green vesicles surround the cell with more new protein (B), yellow-red vesicles surround the cell with less new protein (C), and no vesicles surround the cell with a marginal level of new protein (D). The presence of vesicles indicates the cells are still actively clearing mislocalized RhoQ344Ter-Dend2. E, The green channel from A is depicted to highlight cells with more (arrows) or less (asterisks) new protein. F, Differential fluorescence levels of the image in E are shown on the z-axis of a surface plot to reveal the cells with more new proteins (arrows) and fewer new proteins (asterisks). Green is nonphotoconverted Dend2 and red is photoconverted Dend2. Yellow-red color indicates coexistence of old and new Dend2. Images are maximum projections of optical slices. Images are of live, unfixed retinas. Animals were 21–22 d old at the time of photoconversion. Scale bars, 10 μm.
Live cell imaging and inner segment structure analysis.
Tadpoles expressing Rho-Dend2-1D4 and RhoQ344Ter-Dend2 were dissected immediately after photoconversion and their retinas were incubated in the microscope chamber for up to 2 h. Images were captured periodically (5–22 s time intervals between images) starting 30–45 min after photoconversion. Each image taken was in a different z-plane, which, when combined, resulted in a z-stack covering the entire width of the cell. Videos were generated using all the images taken during the course of the live-imaging session, with maximum projection images representing each frame in the video.
To calculate the movement of inner segment (IS) green punctate structures toward the OS over time, videos were examined to identify cells with structures that moved from a starting point in the IS to the base of the OS and then disappeared. The speed at which the structure moved was calculated by measuring the total distance the structure moved (in micrometers) and dividing that by the time (in seconds) it took the structure to move from its point of origin to the base of the OS.
To calculate the size of IS punctate structures, a circle or oval was drawn around each structure using ImageJ and the Feret's diameter was measured. The Feret's diameter (Merkus, 2009) is defined as the length between the farthest two points of a shape drawn around an object and was used instead of diameter because most of the IS punctate structures are slightly misshapen circles. Circles/ovals were only drawn around structures that were distinguishable as separate entities. Because IS punctate structures were observed infrequently for Rho-Dend2-1D4, circles were drawn in the center of the IS to define a region for a concentration calculation when structures were not visible.
Statistical analysis.
Statistical pairwise comparisons to determine significance were made using the Mann–Whitney rank sum test (MWRST) or the t test, with α set to 0.001 or 0.05, respectively (SigmaPlot 11; Systat Software). Because the combined variability of transgenic protein expression levels and synthesis rates generally lead to a distortion of normal distribution, a nonparametric statistic such as the MWRST is the most appropriate test to determine significance in most of our pairwise comparisons. Unless otherwise noted, all experiments were conducted with at least three independent animals. Error bars indicate 1 SD.
Dot blot.
Eyes collected from 14-d-old (stage range of 43–46 with a mode of 46) transgenic or nontransgenic tadpoles were solubilized in buffer (4× SDS loading buffer with 4% β-mercaptoethanol diluted to 0.5× with PBS containing a complete protease inhibitor mixture [Roche]) and diluted 75 times in PBS. Samples were loaded onto nitrocellulose membrane using a Bio-Dot apparatus (Bio-Rad Laboratories). Membrane was blocked overnight with 1% BSA in PBS. Membranes were initially probed with either mouse anti-B6-30N (2 μg/ml; a kind gift from Drs. David Salom and W. Clay Smith) that recognizes the N terminus of both endogenous (X. laevis) and transgenic (human) rhodopsin (Tam and Moritz, 2007) or with a rabbit polyclonal antibody that was raised against the entire peptide sequence of Dend2 (1:5000, rabbit anti-Dendra2_138 serum) to detect only transgenic rhodopsin fused to Dend2. Secondary antibodies used were anti-mouse IgG-HRP (1.7 ng/ml; Cell Signaling Technology) and anti-rabbit IgG-HRP (4 ng/ml; Santa Cruz Biotechnology). After initializing chemiluminescence detection (HyGLO) membranes were visualized using a FluorChem M imager (ProteinSimple). The integrated density for each spot was obtained using the Gilles Carpentier Dot Blot Analyzer plug-in for ImageJ. Background for all of the B6-30N spots was judged as the value of the nontransgenic eye exposed to only anti-mouse IgG-HRP. Background for all of the Dend2 spots was judged as the value of the nontransgenic eye exposed to only anti-rabbit IgG-HRP. Eyes from nontransgenic animals and purified recombinant Dend2 protein were used to calculate levels of transgene expression in nanograms. Total rhodopsin levels were normalized to the endogenous rhodopsin level in nontransgenic tadpole eyes. Each spot represents a single eye from an independent tadpole.
TUNEL staining and analysis.
Cryosections were thawed and then rehydrated in PBS. Sections were treated with Proteinase K (Sigma-Aldrich) at 4 μg/ml for 5 min at 37°C, followed by immersion in 4% PFA for 10 min and a PBS wash. Sections were incubated in PBS with 0.3% v/v Triton X-100 for 1 h at room temperature. Positive control sections were treated with DNase (Promega) for 1 h at 37°C and then washed in PBS. Sections were equilibrated with reaction buffer for 10 min at room temperature (25 mm Tris-HCl, 0.25 mg/ml BSA, 185 mm sodium cacodylate trihydrate, 1.85 mm CoCl2, hexahydrate, and 185 μm DTT), followed by a 1 h incubation at 37°C with fresh reaction buffer containing final concentrations of 5 μm Alexa Fluor 546-14-dUTP (Invitrogen), 10 μm dATP, 23.5 mm Tris-HCl, 100 μm EDTA, and 600 U/ml recombinant terminal deoxynucleotidyl transferase (Roche); in negative controls, recombinant terminal deoxynucleotidyl transferase was omitted. The reaction was stopped by immersing slides in 2× SSC for 5 min. Nuclei were counterstained with 20 μm Hoechst 33342 (Invitrogen) and washed with PBS. Sections were immersed in 4% PFA for 2 min, washed in PBS, mounted, and imaged using a Leica DM6000 B microscope. The total number of TUNEL-positive nuclei in three or four consecutive sections from each animal was averaged and six to eight were analyzed for each transgene.
Results
Rhodopsin requires the C-terminal trafficking motif for enrichment to the OS
To determine the role of the C-terminal tail in rhodopsin localization, we fused full-length human rhodopsin (Fig. 1A) directly to Dendra2 (Dend2) fluorescent protein (Chudakov et al., 2007a, 2007b; Rho-Dend2; Fig. 1B). Rho-Dend2 localized specifically to the OS (Fig. 2A). Although the proper localization was observed for Rho-Dend2, a previous report suggested that expression of rhodopsin fused directly to a fluorescent protein causes degeneration of photoreceptor cells (Chan et al., 2004), likely due to partial blockage of the cilia-targeting motif adjacent to the fluorescent protein. Accordingly, we also tested an improved version of the rhodopsin fusion construct in which Rho-Dend2 is followed by a 1D4 epitope tag (Rho-Dend2-1D4; Fig. 1B). The 1D4 monoclonal antibody epitope is the last 8 aa of rhodopsin that concludes with VAPA (MacKenzie et al., 1984). This new construct arrangement allows the fusion protein to maintain the functional signaling properties of rhodopsin while preserving proper OS localization in X. laevis (Jin et al., 2003) and proper primary cilia localization in cultured cells such as hTert-RPE1 (Trivedi and Williams, 2010) and IMCD3 (Wang et al., 2012). As expected, Rho-Dend2-1D4 localized to the rod OS (Fig. 2B). Therefore, in the presence of the cilia-targeting motif VXPX, rhodopsin is trafficked to the OS.
Figure 1.

Schematic showing rhodopsin and its constructs used in the experiments. A, Secondary structure of rhodopsin. The region around the C terminus (boxed) was dissected by generating the constructs listed in B. B, Ten rhodopsin constructs were designed to assess the roles of trafficking signals. The location of Dend2 (green oval) with respect to additions and deletions of amino acid residues is shown. ETSQVAPA is the 1D4 tag after Dend2 in Rho-Dend2-1D4, RhoQ344Ter-Dend2-1D4, and Rho1-316-Dend2-1D4. Dend2 is not drawn to scale.
Figure 2.

RhoQ344Ter-Dend2 is predominantly mislocalized to IS membrane structures. A–C, Localization of Rho-Dend2 (A), Rho-Dend2-1D4 (B), and RhoQ344Ter-Dend2 (C). Rho-Dend2 and Rho-Dend2-1D4 were predominantly localized to the OS, whereas RhoQ344Ter-Dend2 mislocalized to the distal IS plasma membrane (arrow) and calyceal processes (arrowhead). D, E, RhoQ344Ter-Dend2 (green) colocalizes with Na+/K+ ATPase (red) in the distal IS plasma membrane (yellow, arrow) and calyceal processes (yellow, arrowhead; D), whereas Rho-Dend2-1D4 does not (E). F, Disk membranes are robustly stained with wheat germ agglutinin (red), so weak disk membrane labeling by RhoQ344Ter-Dend2 is not due to a disk morphogenesis defect. G, RhoQ344Ter-Dend2 (green) partially colocalizes with the Golgi marker β-1,4-galactosyltransferase 1 (1-61) fused to mTurquoise (red, arrow) introduced by transgenesis. Colocalization is represented by yellow. H, RhoQ344Ter-Dend2 (green) partially colocalizes with the lysosome marker LAMP1 (red) in IS vesicles (yellow, arrow) and calyceal processes (yellow, arrowheads). An asterisk indicates a rod cell that did not express RhoQ344Ter-Dend2. LAMP1 does not accumulate to the calyceal processes in negative cells. I, RhoQ344Ter-Dend2 (green) partially colocalizes with the endosome marker EEA1 (red) in IS vesicles (yellow, arrow). Dend2 was not photoconverted and exhibits only green fluorescence. Images are maximum projections of optical slices (A–C, F, G) or single confocal images (D, E, H, I). Images are of live, unfixed retinas (A–C). Animals were 9–10 d old (A–C, F–I) or 21–22 d old (D, E). Scale bars, 10 μm.
To determine the cellular effect of a VXPX motif deficiency, we expressed the Q344Ter mutant of rhodopsin fused to Dend2 (RhoQ344Ter-Dend2; Fig. 1B) in X. laevis rods. In humans, the Q344Ter truncation mutant of rhodopsin leads to removal of the VXPX motif and causes autosomal dominant retinitis pigmentosa (Sung et al., 1991). RhoQ344Ter-Dend2 was observed in the plasma membrane and intracellular structures of the IS (Fig. 2C,D,F–I). In the plasma membrane, RhoQ344Ter-Dend2 was particularly enriched in the distal region of the IS plasma membrane (Fig. 2C, arrow), as evidenced by colocalization with the IS plasma membrane marker Na+/K+-ATPase (Fig. 2D). Rho-Dend2-1D4 did not localize with Na+/K+-ATPase (Fig. 2E), demonstrating that accumulation in the distal IS plasma membrane is a unique feature of RhoQ344Ter-Dend2. RhoQ344Ter-Dend2 was also observed in the calyceal processes (Fig. 2C,D, arrowhead), which are protrusions of the distal IS plasma membrane. To further define the detailed intracellular localization, we tested the colocalization of RhoQ344Ter-Dend2 with several markers of subcellular organelles. The IS intracellular structures partly overlapped with the Golgi apparatus (Fig. 2G, arrow), lysosomes (Fig. 2H, arrow), and endosomes (Fig. 2I, arrow). Localization to Golgi apparatus and endosomes may indicate that these structures serve as a waypoint for protein mistrafficking, whereas localization to lysosomes may suggest that at least a fraction of the RhoQ344Ter-Dend2 is degraded intracellularly before reaching the plasma membrane. Consistent with the fluorescence microscopy results, immunoelectron microscopy (Fig. 3) revealed localization of RhoQ344Ter-Dend2 to the distal IS plasma membrane (Fig. 3A,B, arrows with thin arrowheads), calyceal processes (Fig. 3A,B, arrowheads), structures consistent with Golgi cisternae (Fig. 3C), and electron-dense vesicular structures (Fig. 3C, arrows) within the IS. Although the majority of RhoQ344Ter-Dend2 is excluded from the OS, weak green fluorescence was still observed in the rod OS (Fig. 2F). The disk membranes, where the majority of rhodopsin is usually housed, were robustly labeled with wheat germ agglutinin, suggesting that the weak labeling by RhoQ344Ter-Dend2 is not due to a secondary disk morphogenesis defect, but to inefficient targeting to the disks (Fig. 2F). Therefore, rhodopsin requires the C-terminal cilia-targeting motif for efficient targeting to the OS.
Figure 3.

Mislocalization of RhoQ344Ter-Dend2 to IS plasma membrane structures. A–D, Immunoelectron microscopy of RhoQ344Ter-Dend2 in rods reveals that the following structures are heavily decorated with gold-particle-labeled antibodies and are therefore regions of RhoQ344Ter-Dend2 enrichment: distal IS plasma membrane (A, B, arrows) and calyceal process (A, B, arrowheads); Golgi apparatus and vesicles of the IS (C, arrows) and extracellular vesicles (D, arrows). Animals were 14–15 d old. Scale bars: A, C, D, 1 μm; B, 0.5 μm.
To understand the contribution of the VXPX motif to OS enrichment, the OS concentrations of Rho-Dend2-1D4, Rho-Dend2, and RhoQ344Ter-Dend2 were compared. We imaged unfixed, living retinas because chemical fixation could have led to a compromise in fluorescence quantity as observed for GFP and RFP (Sakhalkar et al., 2007). The OS concentrations of various Dend2 fusion proteins were determined by calibrating fluorescence intensities to known quantities of soluble Dend2. The average OS concentration of Rho-Dend2-1D4 was 12 times higher than that of RhoQ344Ter-Dend2 (Fig. 4A, p < 0.001 by MWRST for comparison of OS concentrations). The OS concentration of Rho-Dend2 was also higher than that of RhoQ344Ter-Dend2 (Fig. 4A, p < 0.001 by MWRST), but lower than that of Rho-Dend2-1D4 (Fig. 4A, p < 0.001 by MWRST). The lower OS concentration of Rho-Dend2 to Rho-Dend2-1D4 is likely due to a partial steric blockage of the VXPX motif by Dend2. These results indicate that the VXPX motif accelerates cilia-directed trafficking.
Figure 4.

The VXPX motif enhances rhodopsin's enrichment to the OS disks. A, OS concentrations are higher in the presence (Rho-Dend2-1D4 and Rho-Dend2) than in the absence (RhoQ344Ter-Dend2, Rho316-Dend2, and Rho326-Dend2) of the VXPX motif. The OS concentrations of Rho-Dend2-1D4, Rho-Dend2, Rho316-Dend2, and Rho326-Dend2 are significantly higher than that of RhoQ344Ter-Dend2 (p < 0.001 by MWRST, indicated by four small asterisks). The OS concentration of Rho316-Dend2 was significantly higher than the OS concentration of Rho326-Dend2 (p < 0.001 by MWRST, indicated by a bracket plus a large asterisk). B, Scatter plot reveals the relationship between protein expression level (IS + OS; x-axis) and OS disk concentration (y-axis) in individual cells (each dot represents a single cell). A.I., arbitrary intensity units. Rho-Dend2-1D4 and Rho-Dend2 are expressed at high levels in a large fraction of cells (high), but RhoQ344Ter-Dend2 is expressed only at low levels (low). Even in the low expression range, the OS concentrations of Rho-Dend2-1D4 and Rho-Dend2 are higher than that of RhoQ344Ter-Dend2 (black rectangle). Animals were 9–10 d old.
In our quantitative image analysis (Fig. 4A), a high variability of OS concentrations was observed among individual cells because the expression levels in individual animals and cells vary in the X. laevis transient transgenic system (Moritz et al., 2001). We took advantage of this feature to analyze and clarify the relationship between protein expression level and OS concentration in individual cells. For this analysis, we generated a scatter plot in which the Dend2 concentration in the OS was plotted against the protein expression level for each individual cell. The protein expression level of individual cells was calculated by selecting the area encompassing the entire OS and IS in single confocal sections and then integrating the fluorescence intensities of the two-dimensional area (OS + IS). OS concentration data used for the scatter plots were also assessed statistically (Fig. 4A, the same group of cells was used for analysis in Fig. 4B). Because Rho-Dend2-1D4 is observed in the OS almost exclusively, the ratios of OS concentration to protein expression level were high, resulting in the distribution of plots to the upper region of the graph (Fig. 4B, green). Because RhoQ344Ter-Dend2 mislocalizes to the IS, the ratios of OS concentration to expression level were low, resulting in the distribution of plots to the lower region of the graph (Fig. 4B, red). Despite using the same X. laevis rhodopsin promoter and a cohort of animals with the highest expression levels (representing the top 37% for each transgenic construct), the OS of the RhoQ344Ter-Dend2 mutant consistently showed distribution to a low concentration range. Because of variable expression levels in individual cells, cells expressing Rho-Dend2-1D4 showed a wide concentration range. Nevertheless the majority of cells showed concentrations higher than RhoQ344Ter-Dend2-transgenic cells even in the same low expression range (Fig. 4B, rectangle). Both Rho-Dend2-1D4 and Rho-Dend2 distributed to the high expression range (Fig. 4B, green and blue, high), whereas RhoQ344Ter-Dend2 distributed only to the low expression range (Fig. 4B, red, low). Therefore, this individual cell analysis demonstrates that the mislocalization of RhoQ344Ter-Dend2 is not due to overexpression of proteins and that the VXPX motif facilitates trafficking to the disk membranes and increases the rhodopsin concentration in the OS in all of the expression ranges tested.
Mislocalization of RhoQ344Ter-Dend2 is facilitated by a secondary targeting signal
RhoQ344Ter-Dend2 is specifically enriched to plasma membrane and intracellular structures of the IS, as well as the calyceal processes (Fig. 2). Because of this specific localization pattern, we investigated whether RhoQ344Ter-Dend2 has a secondary targeting signal that operates in the absence of the primary VXPX cilia-targeting motif. If this hypothetical secondary signal were to facilitate mislocalization of RhoQ344Ter-Dend2, then removal of this signal would rescue rhodopsin localization to the OS. We created several truncation mutants to test this hypothesis (Figs. 1B and 5). To potentially remove this hypothetical signal(s), the entire C-terminal tail was truncated to create Rho1-310-Dend2 (Fig. 1B) and the majority of the C-terminal tail was removed to create Rho1-316-Dend2 (Fig. 1B). We found that both Rho1-310-Dend2 (Fig. 5A) and Rho1-316-Dend2 (Fig. 5B) localized predominantly to the OS. Therefore, the C-terminal tail of rhodopsin is not essential for OS localization. The predominant OS localization of Rho1-316-Dend2 indicates that a secondary targeting signal exists within the region 317–343 aa. Rho1-316-Dend2 localized to the OS disks more effectively than RhoQ344Ter-Dend2, but not as effectively as Rho-Dend2 or Rho-Dend2-1D4 (Fig. 4A, p < 0.001 by MWRST for each comparison of OS concentrations between RhoQ344Ter-Dend2 and three other constructs). The ratios of OS concentration to expression level were higher in cells expressing Rho1-316-Dend2 (Fig. 6A, right, encircled) than RhoQ344Ter-Dend2. This higher ratio is consistent with the above observation that Rho1-316-Dend2 is primarily localized in the OS whereas RhoQ344Ter-Dend2 is not. Therefore, the secondary signal within 317–343 aa facilitated the mislocalization of RhoQ344Ter-Dend2 to regions outside of the OS and prevented the majority of the mutant protein from entering the OS.
Figure 5.
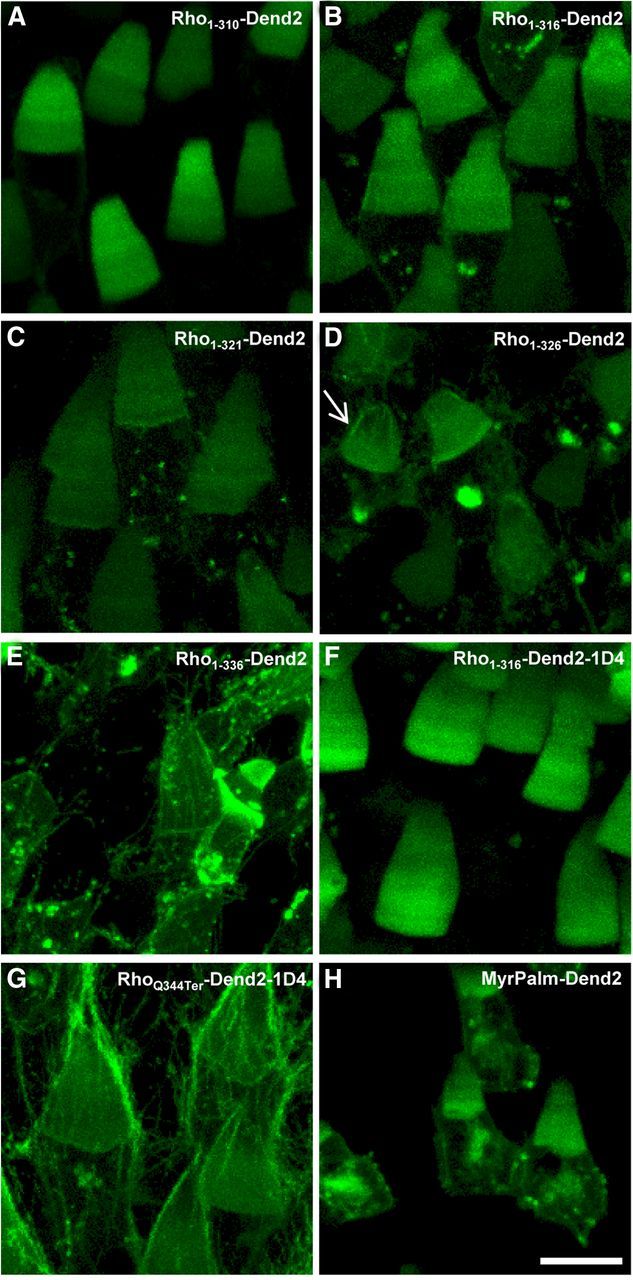
Identification of a secondary mistrafficking signal in rhodopsin. A–H, The localization patterns of rhodopsin mutants (A–G) and MyrPalm-Dend2, a lipidated Dend2 designed to localize to membranes (H). Rho1-310-Dend2 (A), Rho1-316-Dend2 (B), and Rho1-321-Dend2 (C) localize predominantly to the OS, indicating that a secondary mistrafficking signal is missing in these mutants. D, E, Rho1-326-Dend2 mislocalizes to the calyceal processes (D, arrow), and Rho1-336-Dend2 mislocalized further to the calyceal processes and other region of IS plasma membrane (E). Therefore, Rho1-326-Dend2 and Rho1-336-Dend2 contain a mistrafficking signal. F, Rho1-316-Dend2-1D4 is predominantly localized in the OS. G, RhoQ344Ter-Dend2-1D4 mislocalizes to the distal IS plasma membrane and calyceal processes, so the mistrafficking signal is active. H, MyrPalm-Dend2 localized randomly to both the IS and OS, demonstrating that there is no unique trafficking signal contained in Dend2. Images are maximum projections of optical slices. Images are of live, unfixed retinas. Animals were 9–10 d old. Scale bar, 10 μm.
Figure 6.

Effects of the primary VXPX motif and secondary mistrafficking signal on total protein expression and OS concentration in rod cells. A, B, Scatter plots reveal the relationship between protein expression levels (IS + OS; x-axis) and OS disk concentration (y-axis) in individual cells (each dot represents a single cell). A.I., arbitrary intensity units. A, The OS concentrations of Rho1-316-Dend2 and Rho-Dend2 are higher than those of RhoQ344Ter-Dend2 and Rho1-326-Dend2, in which the mistrafficking signal is active. B, The 1D4 signal (containing the VXPX motif) can enhance the OS concentration and expression level in the absence of the mistrafficking signal (compare Rho1-316-Dend2-1D4 and Rho1-316-Dend2), but does not enhance the expression level when the mistrafficking signal is active (RhoQ344Ter-Dend2-1D4). The bottom left corner of the plots on the left (within the black rectangles) are enlarged on the right. Animals were 9–10 d old.
To verify that this specific mislocalization pattern is not a result of the addition of Dend2 to our constructs, we expressed MyrPalm-Dend2 in rods. MyrPalm-Dend2 possesses a myristoyl and palmitoyl group for membrane localization, but does not contain any trafficking or mistrafficking signals originating from rhodopsin. MyrPalm-Dend2 localized randomly throughout the membrane domains of the OS and IS, with no particular enrichment to the calyceal processes or distal IS plasma membrane (Fig. 5H). Similar localization was observed for a lipidated form (myristoylated or palmitoylated) of GFP expressed in rods (Tam et al., 2000). Our results indicate that the specific mislocalization of RhoQ344Ter-Dend2 to the calyceal processes or distal IS plasma membrane is not due to the Dend2 protein, but rather to the secondary signal within 317–343 aa.
To further define the secondary targeting signal that is absent in Rho1-316-Dend2, we gradually extended the C-terminal tail from residue 316. First we investigated whether the eighth helix of rhodopsin (Palczewski et al., 2000) contains the mistrafficking signal. The eighth helix, which was disrupted in Rho1-316-Dend2, was completely recovered in Rho1-321-Dend2 (Fig. 1B). Rho1-321-Dend2 localized in a pattern similar to Rho1-316-Dend2, with the majority of protein being targeted correctly to the OS (Fig. 5C). Therefore, the eighth helix is not essential for the mislocalization to the distal IS plasma membrane. We then extended the C-terminal tail to residue 326 (Rho1-326-Dend2; Fig. 1B). Rho1-326-Dend2 mislocalized to the calyceal processes (Fig. 5D, arrow). Due to the facilitated mistrafficking caused by these additional residues (322–326 aa), the OS concentrations of Rho1-326-Dend2 tend to be lower than that of Rho1-316-Dend2 (Fig. 4A, p < 0.001 by MWRST for comparison of OS concentrations, indicated by a bracket plus a large asterisk). This low OS concentration is not a result of lower expression, but rather poor OS trafficking. Accordingly, the IS + OS total expression levels are similar between Rho1-316-Dend2 and Rho1-326-Dend2 (Fig. 6A, x-axis). Consistent with the lower OS concentration, Rho1-326-Dend2 is lower on the scatter plot than Rho1-316-Dend2, indicating that more Rho1-326-Dend2 is in the IS, and therefore mislocalized, than Rho1-316-Dend2 (Fig. 6A, y-axis). Qualitatively, Rho1-326-Dend2 (Fig. 5D) appeared to localize to the calyceal processes less than RhoQ344Ter-Dend2 (Fig. 2C). Therefore, to determine whether this secondary signal extends further downstream than residue 326, we created Rho1-336-Dend2 (Fig. 1B). Compared with Rho1-326-Dend2, Rho1-336-Dend2 was more enriched in the calyceal processes and other IS plasma membrane locations (Fig. 5E), with a localization resembling that of RhoQ344Ter-Dend2 (Fig. 2C). These observations suggest that the essential portion of the secondary mistrafficking signal is from 322–336 aa.
Modular and cooperative nature of the primary and secondary signals
There are at least two trafficking signals in rhodopsin, one located at the very C terminus (VXPX, the primary signal) and another located at 322–336 aa (the secondary signal). We investigated whether the primary VXPX signal acts independently of the secondary mistrafficking signal. The VXPX primary signal was added to Rho1-316-Dend2, which lacks both signals (Rho1-316-Dend2-1D4; Fig. 1B). This addition led to an increase in the OS concentration, along with an increased expression level (Figs. 5F, 6B), making the OS concentration and expression level of Rho1-316-Dend2-1D4 similar to that of Rho-Dend2 (Fig. 6A,B, black brackets). Therefore, the VXPX motif can act independently of the secondary signal to increase the efficacy of disk targeting.
We then added the VXPX motif to the end of RhoQ344Ter-Dend2, which contains the secondary signal (RhoQ344Ter-Dend2-1D4; Fig. 1B). RhoQ344Ter-Dend2-1D4 (Fig. 5G) mislocalized to the IS plasma membrane similar to RhoQ344Ter-Dend2 (Fig. 2C). Although a slight increase in the OS concentration of RhoQ344Ter-Dend2-1D4 (Fig. 6B, right, light blue, encircled) was observed over RhoQ344Ter-Dend2 (Fig. 6B, right, red), the concentration of RhoQ344Ter-Dend2-1D4 was lower than that of Rho-Dend2 (compare Fig. 6A, blue, B, light blue). This observed mislocalization of RhoQ344Ter-Dend2-1D4 is because the primary VXPX signal and the secondary signal are separated by Dend2. When the VXPX motif is contiguous with the rest of the C-terminal tail sequence, as is the case with Rho-Dend2, rhodopsin localized more accurately to the OS (Fig. 2A). In this case, the VXPX motif neutralized and negated the mislocalizing effect of the secondary signal.
Rod photoreceptor cells are capable of clearing mislocalized RhoQ344Ter-Dend2
The localization of rhodopsin in the rod photoreceptor cell is a result of the dynamic processes of trafficking to and clearance from the destination membrane(s). Conventional confocal imaging of rhodopsin fused to fluorescent proteins is incapable of deciphering these dynamic processes. To understand the dynamic process of rhodopsin localization and mislocalization, we applied a new method that we refer to as the photoconversion technique. This technique takes advantage of the photochemical property of Dend2, which changes from emitting green to emitting red fluorescence upon being photoconverted by violet light. We designed the experiment such that all of the photoreceptor cells are photoconverted at any given moment (Fig. 7Aa,Ab). This photoconversion is irreversible (Fig. 7Ab). After photoconversion, all of the newly synthesized proteins are green and the old proteins are red (Fig. 7Ac,Ad). As a proof of principle (Fig. 7A), we initially applied the photoconversion technique to rods expressing Rho-Dend2-1D4. After photoconversion of Rho-Dend2-1D4, bands of newly synthesized green protein are at the base of the OS and bands of previously synthesized red protein are at the top of the OS (Fig. 7B,C). This observation is consistent with a renewal mechanism that involves the addition of new disks at the base and decomposition of shed disks at the tip by RPE cells (Young, 1976).
Figure 7.
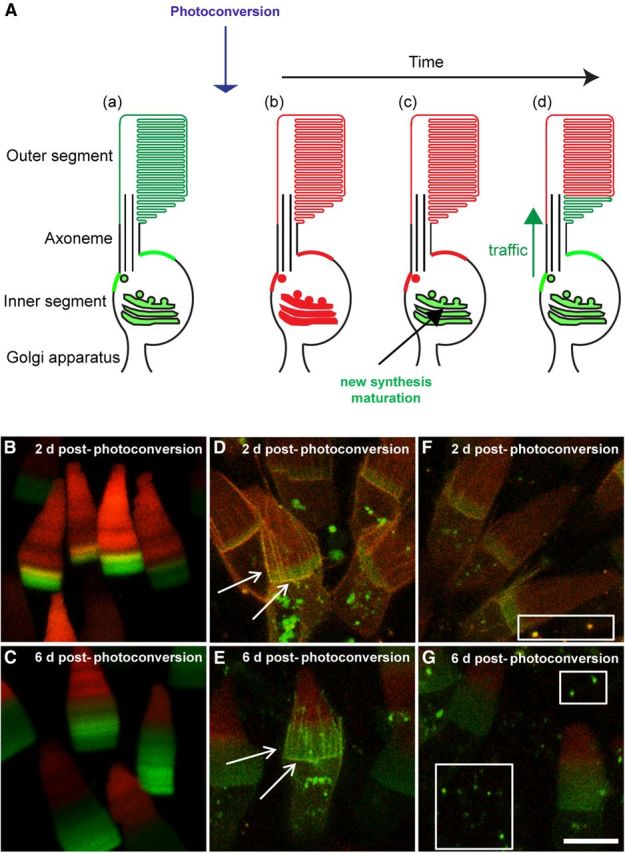
Mislocalized rhodopsin is renewed. A, Schematic showing the photoconversion technique in a rod photoreceptor cell. The Dend2 fusion protein is green (Aa), but converts to red (Ab) after photoconversion. Because this conversion is irreversible, old proteins stay red. Newly synthesized proteins (Ac, green) are trafficked to their destination (Ad). B, C, Newly synthesized Rho-Dend2-1D4 (green) at the base of the OS 2 d (B) and 6 d (C) after photoconversion, with old Rho-Dend2-1D4 (red) at the tip. The gradual renewal of proteins from 2 d (D, yellow regions indicated by arrows) to 6 d (E, green regions indicated by arrows) after photoconversion in RhoQ344Ter-Dend2. F, G, Two days after photoconversion in RhoQ344Ter-Dend2, vesicles were loaded with a mixture of old (red) and new (green) proteins (F, white box, yellow) whereas 6 d after photoconversion, they were occupied with new proteins (G, white boxes, green). Green is nonphotoconverted, new Dend2; red is photoconverted, old Dend2. Images are maximum projections of optical slices. Images are of live, unfixed retinas. Animals were 9–10 d old at time of photoconversion. Scale bar, 10 μm.
Unlike Rho-Dend2-1D4, which localizes almost exclusively to the disk membranes, the majority of RhoQ344Ter-Dend2 in young animals is mislocalized to membrane locations that have no direct access to the RPE cells. Because the RPE is responsible for decomposing the majority of rhodopsin under normal conditions, it is unclear whether the cells are capable of clearing the mislocalized mutant rhodopsin. Therefore, we assessed the dynamic exchange of the old and newly synthesized RhoQ344Ter-Dend2, as well as the clearance of the old RhoQ344Ter-Dend2. Two days after photoconversion, yellow fluorescence was observed in the calyceal processes and distal IS plasma membrane (Fig. 7D, arrows), which is indicative of new and old proteins being mixed together. By 6 d after photoconversion, old red protein was progressively replaced with new green protein in the calyceal processes and distal IS plasma membrane (Fig. 7E, arrows), indicating that mislocalized RhoQ344Ter-Dend2 is gradually replaced. Accordingly, the ratio of red/green (R/G) fluorescence in the distal IS plasma membrane is reduced more than 3-fold (p < 0.001 by MWRST for comparison of R/G ratios; animals were 9–10 d old at time of photoconversion) from 2 d (mean = 1.277 ± SD of 0.767, n = 34 cells) to 6 d (mean = 0.409 ± SD of 0.292, n = 117 cells) after photoconversion. This reduction can be explained in two ways: (1) the physical removal of old protein in this region or (2) the loss of red fluorescence due to the instability of red fluorescent protein. Relatively uniform axial distribution of green Rho-Dend2 and Rho-Dend2-1D4 in the OS (Fig. 2A,B) indicates that green Dend2 is stable over time. Above the distal IS plasma membrane, disk membranes were observed weakly positive to RhoQ344Ter-Dend2 (Fig. 7D,E). We tested the stability of red fluorescence in the old disks compared with the green fluorescence in the disks synthesized after photoconversion. This ratio of R/G fluorescent intensities can provide a theoretical 1:1 molar ratio of Dend2 fluorescence. Over a period of 4 d (2–6 d after photoconversion), a decline (25%) of R/G fluorescence was observed on average (mean at 2 d = 1.039 ± SD of 0.385, n = 58 cells; mean at 6 d = 0.740 ± SD of 0.360, n = 50 cells; p < 0.001 by MWRST for comparison of R/G ratios; animals were 9–10 d old at the time of photoconversion), suggesting instability of the red isoform of Dend2. Such a small degree of instability, however, cannot account for the >3-fold decline of the R/G fluorescence ratio in the distal IS plasma membrane. Instead, the decline of R/G is explainable by physical removal of RhoQ344Ter-Dend2 from mislocalized regions.
The clearance of old RhoQ344Ter-Dend2 appears to involve two mechanisms, secretion of rhodopsin-laden vesicles (Fig. 3D, arrows) and lysosomal degradation. Vesicles can be seen in the extracellular milieu of the rods at 2 and 6 d after photoconversion (Fig. 7F,G). The color of the vesicles indicates where they originated and when they were released. Two days after photoconversion, the majority of vesicles were yellow, suggesting that the vesicles originated from the IS plasma membrane, where old and new proteins were also mixed (Fig. 7F, white box). Six days after photoconversion, the majority of vesicles became green, suggesting that the older yellow vesicles had been removed and new green vesicles released in 4 d (Fig. 7G, white boxes). The replacement of yellow vesicles with green vesicles suggests there is a rapid turnover of secreted vesicles within the extracellular space in young animals. Therefore, the release of rhodopsin-laden vesicles is one of the mechanisms used to clear excessive mislocalized rhodopsin from the cells. Another clearance mechanism, which is not mutually exclusive to the vesicle release, is lysosomal degradation. For such degradation, the calyceal process may play a major role. In the presence of RhoQ344Ter-Dend2, we found significant enrichment of the lysosome marker LAMP1 in the calyceal processes (Fig. 2H, arrowheads), which was not seen in a negative rod cell (Fig. 2H, asterisk). The proximity of mislocalized RhoQ344Ter-Dend2 and a lysosome marker suggests the direct involvement of lysosomes in degrading/removing protein at the site where mislocalized RhoQ344Ter-Dend2 is highly enriched.
Short lifetime and downregulation of RhoQ344Ter-Dend2 lead to dynamic changes of the mislocalization pattern
The above experiments demonstrate the predominant mislocalization of RhoQ344Ter-Dend2 in young animals; however, we unexpectedly observed apparently correct OS localization in the majority of rods in older animals (Fig. 8). Mislocalization of RhoQ344Ter-Dend2 became attenuated, whereas OS localization of RhoQ344Ter-Dend2 was maintained, as the animals got older (21–28 d old). In the majority of the cells (91%, n = 466 rods from 3 RhoQ344Ter-Dend2 animals) in old animals (21–22 d old), RhoQ344Ter-Dend2 localized predominantly to the OS (Fig. 8A), similar to the localization of Rho-Dend2-1D4. In a small population of the cells, RhoQ344Ter-Dend2 localized predominantly to the IS plasma membranes (Fig. 8B)—a pattern similar to but a population (9%) much less than those seen at 9–10 d old (93% of cells at 9–10 d old, n = 118 rods from 3 animals). Therefore, the retinas contain a heterogenous population of cells showing different localization patterns (Fig. 8C). Although the majority of cells display predominant OS localization of RhoQ344Ter-Dend2, its OS concentrations (mean = 5.275 μm Dend2 ± SD of 1.779, n = 108 cells) were 11 times lower (p < 0.001 by MWRST for comparison of OS concentrations) than those observed for Rho-Dend2-1D4 (mean = 59.248 μm Dend2 ± SD of 41.541, n = 122 cells) at similar ages (21–22 d old). Therefore, regardless of the localization pattern or age of the tadpoles, cilia targeting of RhoQ344Ter-Dend2 is largely compromised.
Figure 8.

Attenuated mislocalization of RhoQ344Ter-Dend2 in aged animals. A–C, Two localization patterns in older RhoQ344Ter-Dend2: OS-predominant localization (A) and mislocalization to the distal IS plasma membrane, calyceal processes, and IS (B). C, Both patterns are seen in one retina, with the majority of cells having little mislocalized protein. Green is nonphotoconverted Dend2. Images are maximum projections of optical slices. Images are of live, unfixed retinas. Animals were 21–22 d old. Scale bars, 10 μm.
The photoconversion technique allowed us to study the contribution of new and old proteins to the steady-state level of mislocalized rhodopsin in the IS plasma membrane. After photoconversion of tadpoles at 21–22 d, they were allowed to synthesize new rhodopsin for up to 6 d. In the cells that showed aberrant membrane localization, new green rhodopsin was observed in the IS plasma membranes (Figs. 9A, arrow and solid arrowhead, B,C), albeit at various levels. The cells with more new green proteins were surrounded by red, yellow, and green vesicles (Fig. 9A, arrow, B), suggesting that the observed vesicles are a result of release from the plasma membrane over the past 6 d. The cells with less new green protein were surrounded by yellow-red vesicles (Fig. 9A, solid arrowhead, C). The presence of yellow-red vesicles surrounding the cells with yellow-red distal IS plasma membrane and calyceal processes indicates these cells are still actively clearing mislocalized protein from these regions even if the delivery of new protein to these regions has decreased (Fig. 9C). A large variation in the brightness of extracellular vesicles was observed (green fluorescence 1.2 ± SD of 0.76 times brighter than IS plasma membrane, n = 34 vesicles), with some appearing brighter than the IS plasma membrane on average. Bright punctate structures (Fig. 9A, open arrowhead) were also observed on the calyceal processes (green fluorescence 1.7 ± SD of 0.48 times brighter than IS plasma membrane, n = 21 punctate structures), likely due to a preconcentration step before releasing the rhodopsin-laden vesicles to the extracellular space.
In the cells that showed predominant OS localization (Fig. 9A, asterisk, D), RhoQ344Ter-Dend2 was downregulated (very low-level expression). The majority of these cells are no longer surrounded by extracellular vesicles, suggesting that in the absence of mislocalized RhoQ344Ter-Dend2, no vesicle release occurs. We then assessed the newly synthesized protein by focusing only on the green fluorescence (Fig. 9E,F). The newly synthesized green proteins were high in the IS and calyceal processes of cells with robust membrane mislocalization (Fig. 9E,F, arrows), whereas they were low in the IS and calyceal processes of cells with predominant OS localization (Fig. 9E,F, asterisks). Therefore, the reduced mislocalization seen in the majority of cells in older animals was caused by a downregulation of RhoQ344Ter-Dend2 and completion of clearance from the plasma membrane, a structure that originally contained RhoQ344Ter-Dend2 in the majority of cells in younger animals. Such downregulation would occur either by reduced synthesis of new protein or degradation of newly synthesized proteins before entering the trafficking pathway, either of which leads to a reduced amount of newly synthesized proteins. We obtained additional evidence that newly synthesized RhoQ344Ter-Dend2 is downregulated before entering the trafficking pathway. The OS concentration of rhodopsin is determined by trafficking of newly synthesized rhodopsin, not by its degradation, which does not occur within the OS. In the cells with no mislocalization, we found that the average disk membrane concentration (mean = 3.015 μm Dend2 ± SD of 0.937, n = 40 cells) was less than half (p < 0.001 by MWRST for comparison of OS concentrations; animals were 21–22 d old) that of the cells with mislocalization (mean = 6.435 μm Dend2 ± SD of 1.569, n = 40 cells) in the most recently synthesized disk membranes. Therefore, RhoQ344Ter-Dend2 is downregulated in the cells with no mislocalization and this downregulation led to loss of mislocalized rhodopsin.
Secondary mistrafficking signal confers cellular toxicity to rhodopsin
Compromised health or death of rods leads to a decreased level of rhodopsin, a rod-specific marker. Therefore, a decline in endogenous rhodopsin levels is a sign of cellular toxicity (Tam et al., 2006; Tam and Moritz, 2007). To determine whether the expression of mutant rhodopsin leads to a decline of endogenous rhodopsin in individual retinas, we conducted a quantitative dot blot analysis (Fig. 10A). The anti-B6-30 monoclonal antibody can detect both human and X. laevis rhodopsin (Tam and Moritz, 2007) and is suitable for quantifying the total rhodopsin level in transgenic X. laevis tadpoles. To determine the level of transgene product, we raised a Dend2 specific antibody and quantified the levels of rhodopsin and its mutants fused to Dend2. The measured expression levels of total rhodopsin (endogenous + exogenous) in transgenic tadpoles were normalized to the endogenous rhodopsin level of nontransgenic tadpoles (Fig. 10). Accordingly, a reduction in the normalized total rhodopsin level (<1) is associated with a reduction in the endogenous rhodopsin level of transgenic animals. As expected, the transgene expression level varied largely among transgenic retinas (Fig. 10B, x-axis). The expression of Rho-Dend2-1D4 did not cause a marked decrease in the total rhodopsin level (Fig. 10B, y-axis), an indication that the cells were healthy in general. The expression of RhoQ344Ter-Dend2 caused a marked decrease in the total rhodopsin level in 50% of the animals. These animals had levels lower than the lowest observed among Rho-Dend2-1D4 (Fig. 10B, below gray line). This decrease indicates that the cells were unhealthy and that RhoQ344Ter-Dend2 is toxic. In these experiments, the contribution of transgene product to the total rhodopsin level is estimated to be very low. For Rho-Dend-1D4, the maximum concentration accomplishable in the OS was ∼170 μm (Fig. 4B), at least an order of magnitude lower than the estimated millimolar concentration of endogenous rhodopsin (Haeri and Knox, 2012). Therefore, the low level of total rhodopsin is not due to aberrant overexpression of RhoQ344Ter-Dend2, but rather to a decline in the endogenous rhodopsin levels.
Figure 10.
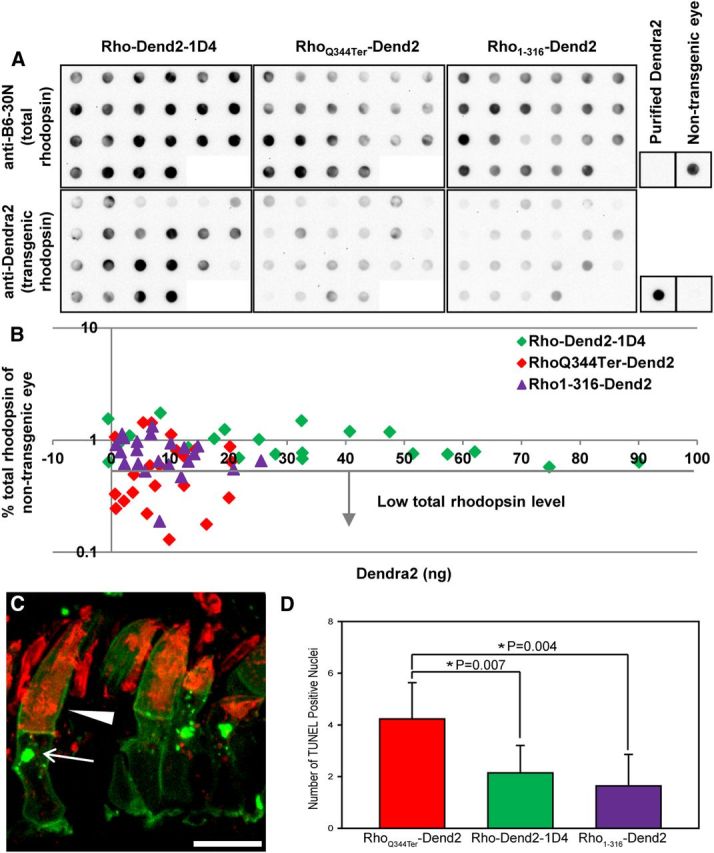
Dot blot and TUNEL analysis of mutant rhodopsin toxicity. A, Dot blot analysis of individual transgenic eyes. The density of the dots reveals the relative amount of total rhodopsin (endogenous + transgenic, top three panels) or transgenic rhodopsin (bottom three panels) in each eye. Nontransgenic eyes and purified recombinant Dend2 protein were included as controls. B, The expression level of Dend2-fused transgene product (x-axis) and level of total rhodopsin (y-axis) were quantified and plotted for individual transgenic tadpole eyes expressing Rho-Dend2-1D4, RhoQ344Ter-Dend2, or Rho1-316-Dend2. The expression of RhoQ344Ter-Dend2 caused a decrease in the level of total rhodopsin (dots below the horizontal line with the arrow), whereas the expression of Rho-Dend2-1D4 did not, indicating that RhoQ344Ter-Dend2 is toxic. Removal of the secondary mistrafficking signal in Rho1-316-Dend2 lessened this toxic effect, because only a minor fraction of eyes had low total rhodopsin levels (dots below the horizontal line with the arrow). The x-axis represents the quantity for 1/50 of one eye. C, Endogenous X. laevis rhodopsin was labeled with 11D5 antibody (red) that recognizes the extreme C terminus (Deretic and Papermaster, 1991). This antibody does not label RhoQ344Ter-Dend2, which lacks the extreme C terminus. RhoQ344Ter-Dend2 (green) does not colocalize with endogenous rhodopsin in the plasma membrane (arrowhead) or intracellular structures (arrow), suggesting that they are not cotrafficked. Nonuniform labeling of OS is due to poor penetration of antibodies into densely packed disk membranes, as described previously (Tam et al., 2006). D, TUNEL staining for apoptotic cells. A significant increase in the number of TUNEL-positive nuclei was seen in RhoQ344Ter-Dend2 compared with Rho-Dend2-1D4 (p = 0.007), whereas a significant decrease was seen in Rho1-316-Dend2 compared with RhoQ344Ter-Dend2 (p = 0.004). Image is a maximum projection of optical slices. Animals were 14–15 d old. Scale bar, 10 μm.
The low level of total rhodopsin is also not due to cotrafficking and codegradation of endogenous rhodopsin with RhoQ344Ter-Dend2, which could occur by dimerization of the two receptors. Endogenous rhodopsin (Fig. 10C, red) was barely cotrafficked with RhoQ344Ter-Dend2 (Fig. 10C, green) to the plasma membrane (Fig. 10C, arrowhead) or intracellular structures (Fig. 10C, arrow), consistent with a previous study (Tam et al., 2006). Furthermore, the codegradation mechanism is inconsistent with a lack of correlation between the expression levels of RhoQ344Ter-Dend2 and total rhodopsin (Fig. 10B), because codegradation would lead to a correlated reduction of both RhoQ344Ter-Dend2 and total rhodopsin. Therefore, although RhoQ344Ter-Dend2 can exert a toxic effect to decrease the level of total rhodopsin, the effect is likely not due to a direct interaction between RhoQ344Ter-Dend2 and endogenous rhodopsin. Instead, we found that the decline in the decreased total rhodopsin levels occurred concomitantly with the acceleration of photoreceptor cell death by RhoQ344Ter-Dend2. We assessed the degree of cell death using TUNEL staining, which detects apoptotic nuclei (Fig. 10D). In retinas expressing Rho-Dend2-1D4, basal levels of TUNEL-positive rods were observed, likely due to the apoptotic process that is a part of retina remodeling during development. In retinas expressing RhoQ344Ter-Dend2, a significant increase in the number of TUNEL-positive rods was observed compared with Rho-Dend2-1D4 (p = 0.007, by t test). Therefore, the death of rod photoreceptor cells is at least in part responsible for the decrease of total rhodopsin levels.
The toxicity of RhoQ344Ter-Dend2 was ameliorated by removal of the secondary signal. Rho1-316-Dend2, which lacks the secondary signal, showed expression levels similar to those of RhoQ344Ter-Dend2 (Fig. 10B, x-axis). However, unlike RhoQ344Ter-Dend2, Rho1-316-Dend2 did not induce the decline of total rhodopsin levels (Fig. 10B, y-axis) in most animals. Only 18% of animals expressing Rho1-316-Dend2 had total rhodopsin levels less than the lowest total rhodopsin level observed among those expressing Rho-Dend2-1D4 (Fig. 10B, below gray line). In the retinas expressing Rho1-316-Dend2, a marked improvement in the survival of rod photoreceptors was observed over those expressing RhoQ344Ter-Dend2, as demonstrated by a significantly lower number of TUNEL-positive cells (Fig. 10D, p = 0.004 by t test). Those observations support the finding that the secondary mistrafficking signal confers toxicity to rhodopsin lacking the VXPX targeting motif.
RhoQ344Ter-Dend2 is transported to the OS more slowly and with less dynamic movement than Rho-Dend2-1D4 in rod photoreceptor cells
Rhodopsin transport carriers (RTCs) are IS vesicles that carry rhodopsin from the site of synthesis toward the OS. To our knowledge, this transport phenomenon has not been visualized previously in vivo. We combined the photoconversion technique and real-time confocal microscopy to visualize this phenomenon, because photoconversion enhances the contrast for newly synthesized and IS-localized rhodopsin over preexisting OS-localized rhodopsin (Fig. 7A). It was reported previously that individual disk morphogenesis occurs in the relatively short time frame of minutes to 1 h (Besharse et al., 1977). In our imaging conditions, Dend2 matured faster than the time it took rhodopsin to complete its trafficking to the OS, a feature essential for visualizing rhodopsins in transit. After the initial observation of newly synthesized proteins in the IS within 30 min of photoconversion (Fig. 11A,B), we subsequently observed the delivery of protein to the OS (Fig. 11C,D, arrows) 1.5 h after photoconversion. Therefore, our imaging and photoconversion conditions did not compromise the cilia-targeted trafficking events in rods, making it suitable for visualizing RTCs.
Figure 11.

Slow trafficking of RhoQ344Ter-Dend2 in the IS. A, B, Live imaging reveals that newly synthesized (green) Rho-Dend2-1D4 (A) and RhoQ344Ter-Dend2 (B) appear first in the IS within 30 min of photoconversion. C, D, Live imaging reveals newly synthesized Rho-Dend2-1D4 (green) is delivered to the OS disks (arrows) 1.5 h after photoconversion. Small IS punctate structures are separate (D, arrowheads) or clustered together (D, asterisks), indicating that they may be waypoints for rhodopsin. D, Image was overexposed to see IS structures. E, F, Live imaging shows the OS-directed movements of RTCs (arrows) and nonvectorial movements of IS vesicles (arrowheads) for Rho-Dend2-1D4 (E) or RhoQ344Ter-Dend2 (F) over time. The RTCs carrying Rho-Dend2-1D4 (E) move at a faster rate than those carrying RhoQ344Ter-Dend2 (F). The rates were calculated based on the time it took each RTC to move from its point of origin (first image in the series) to the location near the OS where the structure disappeared (last image in the series). Green is nonphotoconverted Dend2 and red is photoconverted Dend2. Images are maximum projections of optical slices. Images are of live, unfixed retinas. Animals were 9–10 d old (B) or 9–14 d old (A, C–F) at the time of photoconversion. Scale bars, 10 μm.
We visualized newly synthesized green Rho-Dend2-1D4 and RhoQ344Ter-Dend2 within minutes of photoconversion and followed their movement over a few hours. A small number of vesicular and transient tubulovesicular structures can be seen moving toward the OS in tadpoles expressing both Rho-Dend2-1D4 (Fig. 11E, arrows) and RhoQ344Ter-Dend2 (Fig. 11F, arrows), suggestive of vectorial trafficking of RTCs (here, any rhodopsin-containing vesicles that reach the base of OS are called RTCs). Transient tubulovesicular structures (Fig. 11E, arrows) suggest that tension is generated along the cytoskeleton (Upadhyaya and Sheetz, 2004), and thus imply active trafficking by motor protein(s). We measured the speed of the structures moving toward the OS in several cells with discernible RTCs, focusing on x–y vectorial movements for simplicity. Rho-Dend2-1D4 (mean = 0.184 μm/s ± SD of 0.087, n = 3 cells from 2 tadpoles) structures move an average of ∼8 times faster (p = 0.005 by t test, animals were 9–14 d old at the time of photoconversion) toward the OS than RhoQ344Ter-Dend2 (mean = 0.021 μm/s ± SD of 0.013, n = 5 cells from 5 tadpoles) structures. The rate of vectorial trafficking positively correlated with the concentrations in the OS (Fig. 4A), suggesting that those vectorially moving vesicles are cargos delivering proteins to the OS. This experiment also demonstrates that RTCs can indeed pass through the rod IS and reach the base of the OS (Fig. 11E,F, arrows), a process requiring the active transport of vesicles through the ellipsoid region, which is highly enriched with mitochondria and has a very low volume of cytoplasm.
We also provide evidence that the majority of IS structures containing Rho-Dend2-1D4 and RhoQ344Ter-Dend2 are not RTCs, but rather may be waypoints for rhodopsin. In the cells expressing Rho-Dend2-1D4, the smaller structures are clustered together in some cells (Fig. 11D, asterisks) and are more spread out in others (Fig. 11D, arrowheads), consistent with the dynamic nature of Golgi apparatus. For both Rho-Dend2-1D4 and RhoQ344Ter-Dend2, the motion of most IS structures does not appear to be vectorial as a whole (Fig. 11E,F, arrowheads; nonvectorial movements were observed over a period of 2 h), consistent with their role as waypoints in sorting of protein, but not in carrying cargos directly to their destination.
Discussion
Our results indicate that rhodopsin harbors a recessive trafficking signal responsible for facilitating its mislocalization to the somatic plasma membrane. This mistrafficking signal becomes aberrantly unmasked in the absence of the primary cilia-targeting motif VXPX. Facilitated mistrafficking of rhodopsin is toxic to rods, as demonstrated by a reduced total rhodopsin level and enhanced cell death. Removal of the mistrafficking signal ameliorated this toxicity. The mistrafficking signal caused a decline in the level of endogenous rhodopsin, which is an indicator of the compromised health status of the rods. This negative indication of decreased endogenous rhodopsin should not be confounded with the beneficial effect of the decrease of mislocalized rhodopsin (Lopes et al., 2010). In our study, mislocalized RhoQ344Ter-Dend2 was not reduced in conjunction with the reduced endogenous rhodopsin. It is unclear why rhodopsin has a mistrafficking signal, which is not required for normal function. It is feasible that this secondary signal has been conserved due to additional roles that are as yet undefined. The existence of a secondary signal in rhodopsin was demonstrated previously using MDCK cells, where the signal facilitated sorting to the apical plasma membrane (Chuang and Sung, 1998). This apical-sorting signal overlaps with the mistrafficking signal at 322–326 aa identified in this in vivo study. We demonstrated that the C-terminal tail region at 327–336 aa plays an additional role in rhodopsin's mislocalization. These studies limit the mistrafficking signal within the region as 322–336 aa.
In the absence of the VXPX motif, rhodopsin is deficient in binding to Arf4, a small G-protein important for packaging RTCs in IS. As the normal RTC packaging and trafficking became compromised, RhoQ344Ter-Dend2 accumulated or mistrafficked to IS structures, including endosomes, lysosomes, and the Golgi apparatus. This observation underscores the important role of the VXPX motif in rhodopsin's exiting from the IS. Arf4 recruits other trafficking components, such as ASAP1, Rab11, Rabin8, and Rab8, to the RTCs (Wang et al., 2012). Some of these trafficking components may bind to rhodopsin independently of Arf4 and VXPX, albeit at low efficacy. For example, ASAP1 is capable of binding to the FR motif independently of the VXPX motif. The FR motif is located at aa 313 and 314 in helix 8. Although helix 8 appears to contribute minimally to the mistrafficking based on our study, we cannot fully exclude the possible contribution of ASAP1 in coordinating the binding of trafficking components to the secondary mistrafficking signal. Therefore, the facilitated mislocalization of rhodopsin can be partly understood by miscoordination of these trafficking components without Arf4 being bound.
By discriminating old and newly synthesized rhodopsin, we found that mislocalized RhoQ344Ter-Dend2 is renewed, even if it cannot proceed through the canonical disk-shedding route. Mislocalization becomes attenuated over time due to the downregulation of RhoQ344Ter-Dend2. Attenuation of the mislocalization was also observed in rats expressing Ser334Ter rhodopsin at the late stage of degeneration (Green et al., 2000). The clearance mechanism appears to be constitutively active, so the amount of RhoQ344Ter-Dend2 protein was consistently lower than that of Rho-Dend2-1D4 in individual cells and retinas (Figs. 4B, 10B). The clearance mechanism involves active secretion of rhodopsin-laden vesicles. The mechanism may also involve lysosome-mediated degradation or secretion (Blott and Griffiths, 2002), which appears to be active at the calyceal processes. Accumulation of rhodopsin-laden vesicles was observed in mouse models expressing Q344Ter and P347S mutant rhodopsins (Li et al., 1996; Concepcion and Chen, 2010) and mouse models deficient in the gene encoding either Tulp1 (Hagstrom et al., 1999) or IFT88 (Pazour et al., 2002), a component of the intraflagellar transport particle. Tulp1 and intraflagellar transport particles are considered to be involved in rhodopsin trafficking through the connecting cilia (Hagstrom et al., 2001; Keady et al., 2011). Therefore, these studies support the idea that compromised trafficking at the level of cilia activates the unconventional clearance of rhodopsin. It is feasible that this clearance is a mechanism to protect the cells from toxic mislocalized rhodopsin. Low levels of VXPX-deficient S334Ter rhodopsin (10% of endogenous rhodopsin) is well tolerated by the rods (Concepcion et al., 2002). This tolerance is consistent with the attenuated toxicity, when the clearance activity surpassed the trafficking of new proteins to the plasma membrane, and is suggestive of the protective effect of the clearance mechanism.
The C-terminal VXPX cilia-targeting motif facilitates the trafficking of Rho-Dend2-1D4 to the OS by at least 10-fold. Our results show that in facilitating targeting to the OS, the VXPX motif neutralizes the mislocalization and toxic effect of the mistrafficking signal. This neutralization is dependent on the proximity of the VXPX motif to the mistrafficking signal. In addition to the role of neutralizing the mistrafficking signal, the VXPX motif can increase the rate of OS trafficking independently of the mistrafficking signal. Accordingly, the concentration of Rho1-316-Dend2-1D4 was higher than that of Rho1-316-Dend2, which does not contain the VXPX motif. In the absence of the VXPX motif, Q344Ter rhodopsin can support only short and disorganized OS under a rhodopsin-homozygous knock-out mouse background (Concepcion and Chen, 2010). This poor OS formation would be mediated by the lack of the facilitated cilia targeting or by active mistrafficking, as demonstrated in this study.
Our experiments indicate that the VXPX motif is not strictly required for OS localization. Such OS localization could be mediated by the default trafficking pathway (Baker et al., 2008) or an additional cilia-targeting motif in the third intracellular loop (Berbari et al., 2008). Consistent with such mechanisms, rhodopsin lacking the majority of the C-terminal tail (Rho1-310-Dend2 and Rho1-316-Dend2) can be trafficked to the OS in the absence of the VXPX cilia-targeting motif, albeit at lower efficiency than that of Rho-Dend2-1D4. This low efficiency of trafficking is also consistent with the dot blot analysis in which Rho1-316-Dend2 levels were lower than Rho-Dend2-1D4 levels despite using the same rhodopsin promoter. Because no apparent extracellular vesicles were observed for cells expressing Rho1-316-Dend2 (Fig. 5B), any rhodopsin that could not reach the OS or IS plasma membrane may have been degraded intracellularly by lysosomes or the ubiquitin/proteosome system. A similar degradation mechanism may also apply to RhoQ344Ter-Dend2, which could not reach the OS or IS plasma membranes. Because of possible protein degradation, the OS-trafficking mechanism that operates in the absence of the C-terminal tail region is less efficient at targeting rhodopsin to the cilia than the VXPX-mediated mechanism.
By monitoring the trafficking in real time, we discovered the dynamic nature of rhodopsin movement. The majority of newly synthesized proteins were observed in structures consistent with the Golgi apparatus, whereas a small population of vesicles showed movement consistent with RTCs, as described previously using biochemical methods (Deretic and Papermaster, 1991). RTCs traveled at ∼0.2 μm/s within the IS. This rate closely coincides with a slow movement of rhodopsin-EGFP in connecting cilia, which receive rhodopsin-EGFP from the IS, as measured by FRAP (recovery t1/2 of 10 s for 1 μm cilia; Trivedi et al., 2012). Currently, the motor protein(s) mediating IS trafficking of RTCs is unknown. One of the attractive candidates is the dynein motor that associates with rhodopsin via TcTex-1 (Tai et al., 1999). The rate of purified cytoplasmic dynein ranges from 0.2 to 1.2 μm/s (Schroer and Sheetz, 1991), with the low end consistent with our observed rate of 0.2 μm/s. There is also a proposal that the microtubule-dynein motor system may not mediate rhodopsin trafficking in the IS (Vaughan et al., 1989). Therefore, to understand the relationship between the molecular motor and the rate of RTC movement, the responsible motor protein(s) and cytoskeletal components need to be investigated further. We visualized a relatively small number of vectorially trafficked RTCs with our experimental conditions, which may suggest that the majority of RTCs had limited fluorescence quantity that did not exceed the minimum threshold for microscopy observation. However, we obtained evidence that this low fluorescence is not due to slow maturation of fluorescent proteins in vivo. We could observe newly synthesized rhodopsin in the Golgi apparatus within 30 min of photoconversion, before observing appreciable new rhodopsin in the OS. Therefore, the photoconversion technique is suited for the study of protein trafficking in photoreceptor cells.
In summary, we have provided in vivo evidence that rhodopsin trafficking and mistrafficking are both facilitated by sorting signals located at the C-terminal tail. Rhodopsin mislocalization is observed in many blinding disorders. Rhodopsin mistrafficking occurs by miscoordination of the trafficking signals in the absence of the VXPX motif. Such miscoordination could also occur by mutations in ciliopathy-causative genes, the protein products of which may interact with the VXPX cilia-targeting motif either directly or indirectly. Class I rhodopsin mutations and retinal ciliopathies cause severe retinal degenerations. For these diseases, a viable therapeutic strategy is to reduce the degree of rhodopsin mislocalization; therefore, one of the most relevant findings of the present study is that the deletion of the mistrafficking signal reduced rhodopsin toxicity. Although the detailed molecular basis is still unknown, inhibition of this mistrafficking mechanism would be an attractive way to ameliorate rhodopsin toxicity caused by mislocalization.
Footnotes
This work was supported by the National Institutes of Health (Grants #EY020826, #EY011373, and #DK007319). We thank Dr. Ning Li for the pXOP-5HTR-EGFP-RHO15 vector, Drs. Theodorus W.J. Gadella, Jr., and Antoine Royant for the pmTurquoise2-Golgi vector, Drs. David Salom and W. Clay Smith for anti-rhodopsin mAb B6-30N, Dr. Dusanka Deretic for anti-rhodopsin mAb 11D5, and Dr. Hisashi Fujioka, director of the Electron Microscopy Core Facility at Case Western Reserve University, for support on immunoelectron microscopy. The mouse mAb anti-ATPase Na+/K+ α5 developed by Dr. D.M. Fambrough was obtained from the Developmental Studies Hybridoma Bank developed under the auspices of the National Institute of Child Health and Human Development and maintained by The University of Iowa Department of Biology (Iowa City, Iowa).
The authors declare no competing financial interests.
References
- Amaya E, Kroll KL. A method for generating transgenic frog embryos. Methods Mol Biol. 1999;97:393–414. doi: 10.1385/1-59259-270-8:393. [DOI] [PubMed] [Google Scholar]
- Baker SA, Haeri M, Yoo P, Gospe SM, 3rd, Skiba NP, Knox BE, Arshavsky VY. The outer segment serves as a default destination for the trafficking of membrane proteins in photoreceptors. J Cell Biol. 2008;183:485–498. doi: 10.1083/jcb.200806009. [DOI] [PMC free article] [PubMed] [Google Scholar]
- Batni S, Scalzetti L, Moody SA, Knox BE. Characterization of the Xenopus rhodopsin gene. J Biol Chem. 1996;271:3179–3186. doi: 10.1074/jbc.271.6.3179. [DOI] [PubMed] [Google Scholar]
- Berbari NF, Johnson AD, Lewis JS, Askwith CC, Mykytyn K. Identification of ciliary localization sequences within the third intracellular loop of G protein-coupled receptors. Mol Biol Cell. 2008;19:1540–1547. doi: 10.1091/mbc.E07-09-0942. [DOI] [PMC free article] [PubMed] [Google Scholar]
- Besharse JC, Hollyfield JG, Rayborn ME. Turnover of rod photoreceptor outer segments. II. Membrane addition and loss in relationship to light. J Cell Biol. 1977;75:507–527. doi: 10.1083/jcb.75.2.507. [DOI] [PMC free article] [PubMed] [Google Scholar]
- Blott EJ, Griffiths GM. Secretory lysosomes. Nat Rev Mol Cell Biol. 2002;3:122–131. doi: 10.1038/nrm732. [DOI] [PubMed] [Google Scholar]
- Carpenter AE, Jones TR, Lamprecht MR, Clarke C, Kang IH, Friman O, Guertin DA, Chang JH, Lindquist RA, Moffat J, Golland P, Sabatini DM. CellProfiler: image analysis software for identifying and quantifying cell phenotypes. Genome Biol. 2006;7:R100. doi: 10.1186/gb-2006-7-10-r100. [DOI] [PMC free article] [PubMed] [Google Scholar]
- Chan F, Bradley A, Wensel TG, Wilson JH. Knock-in human rhodopsin-GFP fusions as mouse models for human disease and targets for gene therapy. Proc Natl Acad Sci U S A. 2004;101:9109–9114. doi: 10.1073/pnas.0403149101. [DOI] [PMC free article] [PubMed] [Google Scholar]
- Chuang JZ, Sung CH. The cytoplasmic tail of rhodopsin acts as a novel apical sorting signal in polarized MDCK cells. J Cell Biol. 1998;142:1245–1256. doi: 10.1083/jcb.142.5.1245. [DOI] [PMC free article] [PubMed] [Google Scholar]
- Chuang JZ, Zhao Y, Sung CH. SARA-regulated vesicular targeting underlies formation of the light-sensing organelle in mammalian rods. Cell. 2007;130:535–547. doi: 10.1016/j.cell.2007.06.030. [DOI] [PMC free article] [PubMed] [Google Scholar]
- Chudakov DM, Lukyanov S, Lukyanov KA. Tracking intracellular protein movements using photoswitchable fluorescent proteins PS-CFP2 and Dendra2. Nat Protoc. 2007a;2:2024–2032. doi: 10.1038/nprot.2007.291. [DOI] [PubMed] [Google Scholar]
- Chudakov DM, Lukyanov S, Lukyanov KA. Using photoactivatable fluorescent protein Dendra2 to track protein movement. Biotechniques. 2007b;42:553, 555, 557. doi: 10.2144/000112470. passim. [DOI] [PubMed] [Google Scholar]
- Concepcion F, Chen J. Q344ter mutation causes mislocalization of rhodopsin molecules that are catalytically active: a mouse model of Q344ter-induced retinal degeneration. PLoS One. 2010;5:e10904. doi: 10.1371/journal.pone.0010904. [DOI] [PMC free article] [PubMed] [Google Scholar]
- Concepcion F, Mendez A, Chen J. The carboxyl-terminal domain is essential for rhodopsin transport in rod photoreceptors. Vision Res. 2002;42:417–426. doi: 10.1016/S0042-6989(01)00195-X. [DOI] [PubMed] [Google Scholar]
- Deretic D. A role for rhodopsin in a signal transduction cascade that regulates membrane trafficking and photoreceptor polarity. Vision Res. 2006;46:4427–4433. doi: 10.1016/j.visres.2006.07.028. [DOI] [PubMed] [Google Scholar]
- Deretic D, Papermaster DS. Polarized sorting of rhodopsin on post-Golgi membranes in frog retinal photoreceptor cells. J Cell Biol. 1991;113:1281–1293. doi: 10.1083/jcb.113.6.1281. [DOI] [PMC free article] [PubMed] [Google Scholar]
- Deretic D, Williams AH, Ransom N, Morel V, Hargrave PA, Arendt A. Rhodopsin C terminus, the site of mutations causing retinal disease, regulates trafficking by binding to ADP-ribosylation factor 4 (ARF4) Proc Natl Acad Sci U S A. 2005;102:3301-3306. doi: 10.1073/pnas.0500095102. [DOI] [PMC free article] [PubMed] [Google Scholar]
- Geng L, Okuhara D, Yu Z, Tian X, Cai Y, Shibazaki S, Somlo S. Polycystin-2 traffics to cilia independently of polycystin-1 by using an N-terminal RVxP motif. J Cell Sci. 2006;119:1383–1395. doi: 10.1242/jcs.02818. [DOI] [PubMed] [Google Scholar]
- Goedhart J, von Stetten D, Noirclerc-Savoye M, Lelimousin M, Joosen L, Hink MA, van Weeren L, Gadella TW, Jr, Royant A. Structure-guided evolution of cyan fluorescent proteins towards a quantum yield of 93% Nat Commun. 2012;3:751. doi: 10.1038/ncomms1738. [DOI] [PMC free article] [PubMed] [Google Scholar]
- Green ES, Menz MD, LaVail MM, Flannery JG. Characterization of rhodopsin mis-sorting and constitutive activation in a transgenic rat model of retinitis pigmentosa. Invest Ophthalmol Vis Sci. 2000;41:1546–1553. [PubMed] [Google Scholar]
- Haeri M, Knox BE. Rhodopsin mutant P23H destabilizes rod photoreceptor disk membranes. PLoS One. 2012;7:e30101. doi: 10.1371/journal.pone.0030101. [DOI] [PMC free article] [PubMed] [Google Scholar]
- Hagstrom SA, Duyao M, North MA, Li T. Retinal degeneration in tulp1-/- mice: vesicular accumulation in the interphotoreceptor matrix. Invest Ophthalmol Vis Sci. 1999;40:2795–2802. [PubMed] [Google Scholar]
- Hagstrom SA, Adamian M, Scimeca M, Pawlyk BS, Yue G, Li T. A role for the Tubby-like protein 1 in rhodopsin transport. Invest Ophthalmol Vis Sci. 2001;42:1955–1962. [PubMed] [Google Scholar]
- Hanaichi T, Sato T, Iwamoto T, Malavasi-Yamashiro J, Hoshino M, Mizuno N. A stable lead by modification of Sato's method. J Electron Microsc (Tokyo) 1986;35:304–306. [PubMed] [Google Scholar]
- Jenkins PM, Hurd TW, Zhang L, McEwen DP, Brown RL, Margolis B, Verhey KJ, Martens JR. Ciliary targeting of olfactory CNG channels requires the CNGB1b subunit and the kinesin-2 motor protein, KIF17. Curr Biol. 2006;16:1211–1216. doi: 10.1016/j.cub.2006.04.034. [DOI] [PubMed] [Google Scholar]
- Jin S, McKee TD, Oprian DD. An improved rhodopsin/EGFP fusion protein for use in the generation of transgenic Xenopus laevis. FEBS Lett. 2003;542:142–146. doi: 10.1016/S0014-5793(03)00368-5. [DOI] [PubMed] [Google Scholar]
- Keady BT, Le YZ, Pazour GJ. IFT20 is required for opsin trafficking and photoreceptor outer segment development. Mol Biol Cell. 2011;22:921–930. doi: 10.1091/mbc.E10-09-0792. [DOI] [PMC free article] [PubMed] [Google Scholar]
- Kinney MS, Fisher SK. The photoreceptors and pigment epithelium of the larval Xenopus retina: morphogenesis and outer segment renewal. Proc R Soc Lond B Biol Sci. 1978;201:149–167. doi: 10.1098/rspb.1978.0037. [DOI] [PubMed] [Google Scholar]
- Knox BE, Schlueter C, Sanger BM, Green CB, Besharse JC. Transgene expression in Xenopus rods. FEBS Lett. 1998;423:117–121. doi: 10.1016/S0014-5793(98)00018-0. [DOI] [PubMed] [Google Scholar]
- Kroll KL, Amaya E. Transgenic Xenopus embryos from sperm nuclear transplantations reveal FGF signaling requirements during gastrulation. Development. 1996;122:3173–3183. doi: 10.1242/dev.122.10.3173. [DOI] [PubMed] [Google Scholar]
- Li T, Snyder WK, Olsson JE, Dryja TP. Transgenic mice carrying the dominant rhodopsin mutation P347S: evidence for defective vectorial transport of rhodopsin to the outer segments. Proc Natl Acad Sci U S A. 1996;93:14176–14181. doi: 10.1073/pnas.93.24.14176. [DOI] [PMC free article] [PubMed] [Google Scholar]
- Lopes VS, Jimeno D, Khanobdee K, Song X, Chen B, Nusinowitz S, Williams DS. Dysfunction of heterotrimeric kinesin-2 in rod photoreceptor cells and the role of opsin mislocalization in rapid cell death. Mol Biol Cell. 2010;21:4076–4088. doi: 10.1091/mbc.E10-08-0715. [DOI] [PMC free article] [PubMed] [Google Scholar]
- Luo W, Marsh-Armstrong N, Rattner A, Nathans J. An outer segment localization signal at the C terminus of the photoreceptor-specific retinol dehydrogenase. J Neurosci. 2004;24:2623–2632. doi: 10.1523/JNEUROSCI.5302-03.2004. [DOI] [PMC free article] [PubMed] [Google Scholar]
- MacKenzie D, Arendt A, Hargrave P, McDowell JH, Molday RS. Localization of binding sites for carboxyl terminal specific anti-rhodopsin monoclonal antibodies using synthetic peptides. Biochemistry. 1984;23:6544–6549. doi: 10.1021/bi00321a041. [DOI] [PubMed] [Google Scholar]
- Merkus HG. Particle size measurements: fundamentals, practice, quality. New York: Springer; 2009. [Google Scholar]
- Moritz OL, Tam BM, Papermaster DS, Nakayama T. A functional rhodopsin-green fluorescent protein fusion protein localizes correctly in transgenic Xenopus laevis retinal rods and is expressed in a time-dependent pattern. J Biol Chem. 2001;276:28242–28251. doi: 10.1074/jbc.M101476200. [DOI] [PubMed] [Google Scholar]
- Nickell S, Park PS, Baumeister W, Palczewski K. Three-dimensional architecture of murine rod outer segments determined by cryoelectron tomography. J Cell Biol. 2007;177:917–925. doi: 10.1083/jcb.200612010. [DOI] [PMC free article] [PubMed] [Google Scholar]
- Nieuwkoop PD, Faber J. Normal table for Xenopus laevis (Daudin) Amsterdam: North-Holland; 1967. [Google Scholar]
- Palczewski K, Kumasaka T, Hori T, Behnke CA, Motoshima H, Fox BA, Le Trong I, Teller DC, Okada T, Stenkamp RE, Yamamoto M, Miyano M. Crystal structure of rhodopsin: A G protein-coupled receptor. Science. 2000;289:739–745. doi: 10.1126/science.289.5480.739. [DOI] [PubMed] [Google Scholar]
- Pazour GJ, Baker SA, Deane JA, Cole DG, Dickert BL, Rosenbaum JL, Witman GB, Besharse JC. The intraflagellar transport protein, IFT88, is essential for vertebrate photoreceptor assembly and maintenance. J Cell Biol. 2002;157:103–113. doi: 10.1083/jcb.200107108. [DOI] [PMC free article] [PubMed] [Google Scholar]
- Sakhalkar HS, Dewhirst M, Oliver T, Cao Y, Oldham M. Functional imaging in bulk tissue specimens using optical emission tomography: fluorescence preservation during optical clearing. Phys Med Biol. 2007;52:2035–2054. doi: 10.1088/0031-9155/52/8/001. [DOI] [PubMed] [Google Scholar]
- Schroer TA, Sheetz MP. Two activators of microtubule-based vesicle transport. J Cell Biol. 1991;115:1309–1318. doi: 10.1083/jcb.115.5.1309. [DOI] [PMC free article] [PubMed] [Google Scholar]
- Smith SJ, Fairclough L, Latinkic BV, Sparrow DB, Mohun TJ. Xenopus laevis transgenesis by sperm nuclear injection. Nat Protoc. 2006;1:2195–2203. doi: 10.1038/nprot.2006.325. [DOI] [PubMed] [Google Scholar]
- Sparrow DB, Latinkic B, Mohun TJ. A simplified method of generating transgenic Xenopus. Nucleic Acids Res. 2000;28:E12. doi: 10.1093/nar/28.4.e12. [DOI] [PMC free article] [PubMed] [Google Scholar]
- Sung CH, Chuang JZ. The cell biology of vision. J Cell Biol. 2010;190:953–963. doi: 10.1083/jcb.201006020. [DOI] [PMC free article] [PubMed] [Google Scholar]
- Sung CH, Davenport CM, Hennessey JC, Maumenee IH, Jacobson SG, Heckenlively JR, Nowakowski R, Fishman G, Gouras P, Nathans J. Rhodopsin mutations in autosomal dominant retinitis pigmentosa. Proc Natl Acad Sci U S A. 1991;88:6481–6485. doi: 10.1073/pnas.88.15.6481. [DOI] [PMC free article] [PubMed] [Google Scholar]
- Tai AW, Chuang JZ, Bode C, Wolfrum U, Sung CH. Rhodopsin's carboxy-terminal cytoplasmic tail acts as a membrane receptor for cytoplasmic dynein by binding to the dynein light chain Tctex-1. Cell. 1999;97:877–887. doi: 10.1016/S0092-8674(00)80800-4. [DOI] [PubMed] [Google Scholar]
- Tam BM, Moritz OL. Dark rearing rescues P23H rhodopsin-induced retinal degeneration in a transgenic Xenopus laevis model of retinitis pigmentosa: a chromophore-dependent mechanism characterized by production of N-terminally truncated mutant rhodopsin. J Neurosci. 2007;27:9043–9053. doi: 10.1523/JNEUROSCI.2245-07.2007. [DOI] [PMC free article] [PubMed] [Google Scholar]
- Tam BM, Moritz OL, Hurd LB, Papermaster DS. Identification of an outer segment targeting signal in the COOH terminus of rhodopsin using transgenic Xenopus laevis. J Cell Biol. 2000;151:1369–1380. doi: 10.1083/jcb.151.7.1369. [DOI] [PMC free article] [PubMed] [Google Scholar]
- Tam BM, Xie G, Oprian DD, Moritz OL. Mislocalized rhodopsin does not require activation to cause retinal degeneration and neurite outgrowth in Xenopus laevis. J Neurosci. 2006;26:203–209. doi: 10.1523/JNEUROSCI.3849-05.2006. [DOI] [PMC free article] [PubMed] [Google Scholar]
- Trivedi D, Williams DS. Ciliary transport of opsin. Adv Exp Med Biol. 2010;664:185–191. doi: 10.1007/978-1-4419-1399-9_21. [DOI] [PMC free article] [PubMed] [Google Scholar]
- Trivedi D, Colin E, Louie CM, Williams DS. Live-cell imaging evidence for the ciliary transport of rod photoreceptor opsin by heterotrimeric kinesin-2. J Neurosci. 2012;32:10587–10593. doi: 10.1523/JNEUROSCI.0015-12.2012. [DOI] [PMC free article] [PubMed] [Google Scholar]
- Upadhyaya A, Sheetz MP. Tension in tubulovesicular networks of Golgi and endoplasmic reticulum membranes. Biophys J. 2004;86:2923–2928. doi: 10.1016/S0006-3495(04)74343-X. [DOI] [PMC free article] [PubMed] [Google Scholar]
- Vaughan DK, Fisher SK, Bernstein SA, Hale IL, Linberg KA, Matsumoto B. Evidence that microtubules do not mediate opsin vesicle transport in photoreceptors. J Cell Biol. 1989;109:3053–3062. doi: 10.1083/jcb.109.6.3053. [DOI] [PMC free article] [PubMed] [Google Scholar]
- Wang J, Morita Y, Mazelova J, Deretic D. The Arf GAP ASAP1 provides a platform to regulate Arf4- and Rab11-Rab8-mediated ciliary receptor targeting. EMBO J. 2012;31:4057–4071. doi: 10.1038/emboj.2012.253. [DOI] [PMC free article] [PubMed] [Google Scholar]
- Ward HH, Brown-Glaberman U, Wang J, Morita Y, Alper SL, Bedrick EJ, Gattone VH, 2nd, Deretic D, Wandinger-Ness A. A conserved signal and GTPase complex are required for the ciliary transport of polycystin-1. Mol Biol Cell. 2011;22:3289–3305. doi: 10.1091/mbc.E11-01-0082. [DOI] [PMC free article] [PubMed] [Google Scholar]
- Williams DS, Fisher SK. Prevention of rod disk shedding by detachment from the retinal pigment epithelium. Invest Ophthalmol Vis Sci. 1987;28:184–187. [PubMed] [Google Scholar]
- Young RW. Visual cells and the concept of renewal. Invest Ophthalmol Vis Sci. 1976;15:700–725. [PubMed] [Google Scholar]
- Young RW, Bok D. Participation of the retinal pigment epithelium in the rod outer segment renewal process. J Cell Biol. 1969;42:392–403. doi: 10.1083/jcb.42.2.392. [DOI] [PMC free article] [PubMed] [Google Scholar]
- Zhang L, Salom D, He J, Okun A, Ballesteros J, Palczewski K, Li N. Expression of functional G protein-coupled receptors in photoreceptors of transgenic Xenopus laevis. Biochemistry. 2005;44:14509–14518. doi: 10.1021/bi051386z. [DOI] [PubMed] [Google Scholar]