

Abstract
NMDA receptors are composed of two GluN1 (N1) and two GluN2 (N2) subunits. Constituent N2 subunits control the pharmacological and kinetic characteristics of the receptor. NMDA receptors in hippocampal or cortical neurons are often thought of as diheteromeric, meaning that they contain only one type of N2 subunit. However, triheteromeric receptors with more than one type of N2 subunit also have been reported, and the relative contribution of diheteromeric and triheteromeric NMDA receptors at synapses has been difficult to assess. Because wild-type hippocampal principal neurons express N1, N2A, and N2B, we used cultured hippocampal principal neurons from N2A and N2B knock-out mice as templates for diheteromeric synaptic receptors. However, summation of N1/N2B and N1/N2A EPSCs could not account for the deactivation kinetics of wild-type EPSCs. To make a quantitative estimate of NMDA receptor subtypes at wild-type synapses, we used the deactivation kinetics and the effects of the competitive antagonist NVP-AAM077. Our results indicate that three types of NMDA receptors contribute to wild-type EPSCs, with at least two-thirds being triheteromeric receptors. Functional isolation of synaptic triheteromeric receptors revealed deactivation kinetics and pharmacology that were distinct from either diheteromeric receptor subtype. Because of differences in open probability, synaptic triheteromeric receptors outnumbered N1/N2A receptors by 5.8 to 1 and N1/N2B receptors by 3.2 to 1. Our results suggest that triheteromeric NMDA receptors must either be preferentially assembled or preferentially localized at synapses.
Introduction
NMDA receptors are tetramers of GluN1 (N1) and GluN2 (N2) subunits, with two of each subunit type per receptor. One gene with several splice variants encodes N1 and several genes encode N2 subunits (N2A–N2D). Each type of N2 subunit confers a distinct kinetic and pharmacological profile to the receptor. Expression of N2 subunits is developmentally and anatomically regulated and results in extensive heterogeneity in NMDA receptor properties. Studying the molecular composition of synaptic NMDA receptors is challenging because neurons can make diheteromeric and triheteromeric receptors (Sheng et al., 1994). The roles of N2A or N2B subunits in synaptic plasticity and neurodevelopment have been studied using drugs that can distinguish between diheteromeric receptors. However, these drugs discriminate poorly between diheteromeric and triheteromeric receptors (Neyton and Paoletti, 2006). Therefore, the possible contribution of triheteromeric receptors to the synaptic response has often been ignored. However, recent evidence in hippocampal neurons in which N2A and N2B are highly expressed (Gray et al., 2011; Rauner and Köhr, 2011) suggests that triheteromeric receptors contribute to EPSCs.
Recombinant diheteromeric receptor subtypes differ in their pharmacological sensitivity to modulatory ligands such as zinc and ifenprodil, as determined by the constituent N2 receptor subunit. Receptor properties such as deactivation kinetics and open probability can also be indicative of the diheteromeric receptor subtype (Vicini et al., 1998; Chen et al., 1999). For example, the decay of NMDA receptor-mediated EPSCs can differ by several fold depending on the diheteromeric receptor subtype (Cathala et al., 2000; Logan et al., 2007; Tovar and Westbrook, 2012). In this context it becomes critical to know how synaptic NMDA receptor properties reflect the expression of more than one N2 subunit type, as is typical of mammalian CNS neurons. The pharmacological characteristics of recombinant triheteromeric receptors have been studied in heterologous cells (Hatton and Paoletti, 2005), but comparatively little is known about the behavior of triheteromeric NMDA receptors at synapses, particularly during phasic agonist presentation characteristic of neurotransmitter release.
We developed a method to quantify the contributions of NMDA receptor subtypes to EPSCs in principal excitatory neurons in the mouse hippocampus that express N1, N2A, and N2B (Monyer et al., 1994). We used neurons from N2A and N2B knock-out (KO) mice to define the properties of diheteromeric N1/N2B (B-type) or N1/N2A (A-type) receptors, respectively. The properties of wild-type EPSCs indicated that A-type or B-type receptors were present, but were not sufficient to account for the entire wild-type synaptic response. We conclude that three types of NMDA receptors contribute to EPSCs in wild-type neurons, with the predominant contribution being from triheteromeric receptors containing N2A and N2B subunits, along with N1.
Materials and Methods
Mouse hippocampal micro-island cell cultures.
All recordings were done on mouse hippocampal neurons cultured on glial micro-islands, as described previously (Tovar and Westbrook, 2012). Neurons from wild-type, N2A KO (Sakimura et al., 1995), N2B KO (Kutsuwada et al., 1996), and N2A/N2B double knock-out (DKO) mice were taken at P0 or P1 because of the early lethality of N2B KO mice (Kutsuwada et al., 1996). All mice were in a C57BL/6 genetic background. Male mouse pups were used for all cell cultures. Mouse pups were decapitated, the brains were removed from the skulls, and hippocampi were dissected from the brain. Glial micro-islands were prepared before culturing neurons by plating hippocampal cells at 125,000 cells/35 mm dish onto coverslips that had been sprayed with a collagen and poly-d-lysine mixture (Tovar and Westbrook, 2012). After 1 week, glial micro-islands were treated with 200 μm glutamate to kill neurons and then neurons were added at 25,000 cells/35 mm dish. All glia were from wild-type mice. Cultures were grown in a tissue culture incubator (37°C at 5% CO2) in a medium made with MEM with 2 mm Glutamax (Invitrogen), 5% heat-inactivated fetal calf serum (Lonza), and 1 ml/L Mito+ Serum Extender (BD Bioscience), and supplemented with glucose to an added concentration of 21 mm. Genotypes of N2A and N2B KO mice and DKO (lacking N2A and N2B) mice were verified with PCR using previously described primers (Tovar et al., 2000; Thomas et al., 2006). DKO mice were generated by crossing adults that were heterozygous at both alleles. All animals were treated in accord with Oregon Health & Science University and National Institutes of Health policies on animal care and use.
Solutions and electrophysiology.
Because contaminating concentrations of zinc prolongs the NMDA receptor-mediated EPSC deactivation (Tovar and Westbrook, 2012), we used tricine in all extracellular solutions to buffer zinc. During recordings, neurons were continuously perfused through gravity-fed flow pipes. Flow pipes were placed within 100 micrometers of the recorded neuron. The extracellular solution contained (in mm) 158 NaCl, 10 tricine, 2.4 KCl, 10 HEPES, 10 d-glucose, 1.3 CaCl2, and 0.02–0.05 glycine, in addition to 2.5 μm NBQX. High-purity salts and HPLC water were used for external solutions. The pipette solution contained the following (in mm): 140 potassium gluconate; 4 CaCl2, 8 NaCl, 2 MgCl2, 10 EGTA, 2 Na2ATP, and 0.2 Na2GTP. The pH was adjusted to 7.4 with KOH. The osmolality of external and internal solutions was adjusted to 320 mOsm. For zinc application experiments, the free zinc concentration was calculated as described previously (Fayyazuddin et al., 2000). Strychnine, NMDA, glycine, NVP-AAM077, and salts were obtained from Sigma-Aldrich or Fluka; NBQX, ifenprodil, and (+)-MK-801 were obtained from Ascent Scientific.
Whole-cell voltage-clamp recordings were done on neurons in micro-island culture using either single neurons (which made autapses) or pairs of neurons (which made reciprocal synaptic connections). To evoke synaptic currents, the command voltage was briefly stepped to +20 mV (for 0.5 ms) at the soma, producing an unclamped action potential, followed by the EPSC. Axopatch 1C amplifiers and AxoGraph X acquisition software were used for data acquisition. The series resistance was always <8 mΩ and was compensated by >80% by the amplifier circuitry. Data were low-pass filtered at 5 kHz and acquired at 10 kHz. Postsynaptic currents were evoked at low frequency (0.1–0.2 Hz). All recordings were done at room temperature. All recordings were done on neurons at 10–16 d in vitro. For this work, we only analyzed EPSCs that were on excitatory neurons to reduce variability in postsynaptic neuron phenotype.
Experimental design and data analysis.
To estimate the NMDA receptor channel latency to first opening, we used high concentrations of MK-801 (25 μm) to block channels immediately upon opening. This is based on well tested assumptions (Jahr, 1992), specifically that: (1) once channels open, the vast majority are blocked very quickly, leading to (2) very few channels opening more than once because (3) once a channel is blocked, MK-801 does not unbind during the EPSC (Huettner and Bean, 1988). The time course of charge transfer in 25 μm MK-801 thus provides an approximation of the latency to first opening of NMDA receptor channels after neurotransmitter binding. Furthermore, in MK-801, the ratio of the charge at the time of the control EPSC peak to the total charge is the probability that channels have opened by the time of the control EPSC peak (Po*).
We used the competitive antagonist NVP-AAM077 (Auberson et al., 2002) to characterize A- and B-type receptors and to separate NMDA receptor subtypes. Even though NVP-AAM077 is a competitive antagonist, and is therefore sensitive to agonist equilibrium affinity differences between receptor subtypes, using NVP to differentiate between receptor subtypes was possible because: (1) cells were equilibrated in NVP-AAM077, (2) the neurotransmitter glutamate was present very briefly (Clements et al., 1992), and (3) the glutamate binding rate of A- and B-type receptors is comparable (Chen et al., 2001). The tenfold difference in the NVP IC50 we measured between A-type and B-type receptor EPSCs confirmed this approach.
To estimate the fractional contributions of A-, B-, and AB-type receptors to the wild-type EPSC, we fit the deactivation kinetics of wild-type EPSCs at each of five NVP-AAM077 concentrations with a sum of three double-exponential functions using nonlinear least-squares curve fitting in MATLAB (MathWorks). Six to 10 random initial conditions were used for each fit to ensure that the global minimum had been achieved. The fractional contribution of each double exponential to the EPSC, but not the kinetics of the individual double-exponential functions, was allowed to change with NVP concentration. One double-exponential function had kinetic parameters and dose–response properties constrained to be within 1 or 2 SDs of the data from A-type EPSCs. A second double-exponential function was similarly constrained to match B-type EPSCs. The third double-exponential function had unconstrained kinetics and NVP dose–response characteristics. This third component provided an estimate of the fractional contribution to wild-type EPSCs, the triheterometeric receptor kinetics, and the NVP dose–response profile. Values generated from fits with ±1 and ±2 SD constraints were very similar, so only ±1 SD results are shown.
All other data were analyzed with Axograph X or Igor software. Measurements were done on at least eight EPSCs that had been averaged. The exception was for traces in MK-801, which, because of the use dependence of this drug, required that at most three EPSCs be averaged.
EPSC deactivations were fit using the function:
where If and Is are the relative amplitudes of the fast and slow components, respectively, τf and τs are the fast and slow deactivation time constants, respectively, and c is a constant that represents any residual current that was not fit (typically <0.5% of the total amplitude). Fits to wild-type EPSC deactivations were started from the peak and extended to 3.5 s after the peak, typically allowing for at least 8 time constants of the larger decay component. Fits of the deactivations from mutant neuron EPSCs were done using shorter (1.5 s for N2B-knock-out neurons) or longer (4.5 s for N2A-knock-out neurons) time windows.
Weighted time constants were calculated as follows:
where τw is the weighted time constant, If and Is are the relative amplitudes of the fast and slow components, respectively, and τf and τs are the fast and slow time constants, respectively.
Dose-inhibition curves were fit as follows:
where IEPSC is the peak EPSC amplitude, [ligand] is the ligand concentration, and nH is the Hill coefficient.
To enrich the wild-type EPSC with triheteromeric receptors, we first used NVP/MK-801 to progressively block EPSCs. This was done to block all contribution from B-type receptors (Fig. 6). After NVP/MK-801 treatment, we assumed that only A- and AB-type receptors should contribute to the residual EPSC. This assumption is based on the Po of B-type receptors (0.24), the fraction of receptors not blocked by 100 nm NVP (0.5), and an estimate of presynaptic release probability (0.2). At the concentration of (+)-MK-801 used, any open NMDA receptor channel will become blocked. Therefore, after 50 episodes in (+)-MK-801, the EPSC contribution from B-type receptors should be eliminated.
Figure 6.
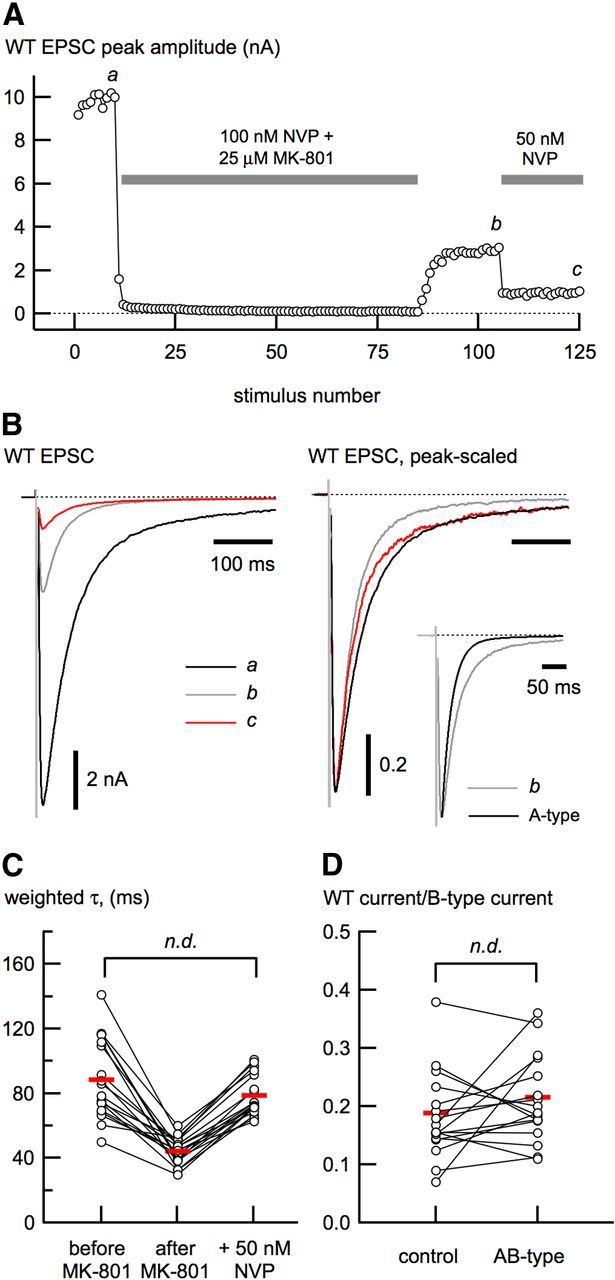
Functional isolation of synaptic triheteromeric (AB-type) receptors. A, Outline of our strategy for isolation of AB-type NMDA receptor-mediated EPSCs in wild-type (WT) neurons. EPSCs were evoked at low frequency (0.1 Hz) while cells were perfused with NVP and MK-801 to prevent A-type channels from opening and to progressively block the remaining channels (B-type and AB-type). The NVP/MK-801 solution was removed, leaving EPSCs that result from A- and AB-type receptors (b). To enrich the remaining EPSC with AB-type receptors, the neurons were perfused with 50 nm NVP to block the majority of A-type receptors. B, EPSCs shown from different times in the isolation protocol (a–c) shown in A, indicating their relative amplitudes (left) and peak-scaled (right) to show how the deactivation changes during the course of the experiment. The inset (right) shows the EPSC at b compared with the deactivation of A-type EPSCs alone. The τw (C) and the estimate of the maximal B-type receptor contribution (D) do not differ between control and enriched AB-type receptors.
To estimate the contribution of A-type receptors in the enriched triheteromeric receptor fraction (in 50 nm NVP) we used the following equation:
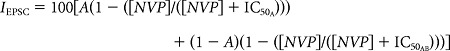 |
where IEPSC is the EPSC amplitude, in this case 30.0 ± 1.4% of control (n = 14) in 50 nm NVP-AAM077, [NVP] is the NVP-AAM077 concentration, IC50A and IC50AB are the IC50 values for NVP-AAM077 on A-type EPSCs and AB-type EPSCs, respectively, and A is the fractional contribution from A-type receptors to the EPSC. We estimated a mean IC50AB from 5-point dose-inhibition curves (30.0 ± 1.4 nm; n = 10). This fractional contribution (A), coupled with the known reduction of A-type receptors by 50 nm NVP-AAM077 (83%) and the reduction of the EPSC after treatment with NVP-AAM077 and (+)-MK-801 gives the maximal contaminating amount of A-type EPSC in the AB-type enriched EPSC.
The contribution of each NMDA receptor subtype to the wild-type EPSC amplitude and the probability of a channel having opened by the time of the EPSC peak (Po*) were used to estimate the relative amounts of NMDA receptor subtypes expressed at synapses, using the following relationship for any receptor type n:
where Rn is the fraction of receptor type n at synapses, F is the fractional contribution of that receptor type to the EPSC, and P is the Po* of that receptor type.
Figures and statistics.
For all two-axis plots, the y-axis (ordinate) label is placed above the plot rather than to the left of the axis. Statistical significance was determined using Student's unpaired or paired t test, as appropriate. The threshold for statistical significance was set at 0.05. IC50 and Hill coefficient data are reported as means ± SDs. All other data are reported as means ± SEM unless otherwise specified.
Results
To examine the contribution of diheteromeric and triheteromeric receptors to wild-type EPSCs, we used cultured hippocampal neurons from mice that lacked expression of N2A or N2B due to homologous recombination (Sakimura et al., 1995; Kutsuwada et al., 1996). Our experimental approach assumes that NMDA receptor-mediated EPSCs in KO neurons result from a homogenous diheteromeric receptor population. To validate this approach, we examined the kinetic and pharmacological characteristics of EPSCs in excitatory neurons. EPSC deactivations from N2A and N2B KO neurons were fit with the sum of two exponentials (τfast and τslow) and an average weighted time constant (τw) was calculated to allow easy comparison of kinetic parameters. As shown in Figure 1A,B, the EPSC deactivations from N2A and N2B KO neurons differed by more than an order of magnitude (N2B KO: 22.7 ± 2.2 ms; N2A KO: 314.9 ± 73.3; n = 35 for each). The τw values of EPSC deactivations in the KO neurons matched the deactivation in response to brief application of glutamate (1 mm for 1 ms) at the recombinant N1/N2A and N1/N2B receptors, respectively (Vicini et al., 1998). For brevity, we will refer to N1/N2A and N1/N2B diheteromeric NMDA receptors as A-type and B-type receptors, respectively, and to triheteromeric NMDA receptors containing N2A and N2B as AB-type receptors.
Figure 1.

Model system for diheteromeric synaptic NMDA receptors. A, EPSCs from N2A KO (gray trace) and N2B KO neurons (black trace), superimposed and peak-scaled, highlighting the difference in their deactivation time course. B, Weighted time constant of decay (τw) from N2A and N2B KO neuron EPSCs (n = 35). C, D, N2B and N2A KO EPSCs are sensitive to zinc (100 nm, free) and ifenprodil (3 μm), as expected for A-type or B-type receptors, respectively. E, EPSCs from wild-type (left) and DKO neurons (right). The wild-type EPSC has an (R)-CPP-sensitive component (black trace) and an NBQX-sensitive component (red trace), indicative of NMDA and AMPA receptors, respectively. The EPSCs from the DKO neuron have no contribution from NMDA receptors, as indicated by the similarity of the control and (R)-CPP traces. F, G, Whole-cell application of NMDA (100 μm) always (18/18) resulted in robust currents from wild-type (WT) neurons. In contrast, NMDA application to DKO neurons produced no current in most neurons (38/44) and small currents in six neurons.
Zinc and ifenprodil are canonical ligands that have been used to distinguish between diheteromeric receptor subtypes (Paoletti and Neyton, 2007). Zinc (100 nm free; see Materials and Methods) and ifenprodil (3 μm) reduced the EPSC peak from N2B and N2A KO neurons (Fig. 1C,D) to 44.3 ± 1.6 (n = 8) and 17.7 ± 1.5% of control (n = 15), respectively, comparable to values reported for A-type or B-type recombinant receptors (Perin-Dureau at el., 2002; Rachline et al., 2005). Therefore, the kinetic and pharmacological properties of synaptic receptors from N2A or N2B KO neurons are consistent with B-type and A-type NMDA receptors, respectively.
To investigate whether excitatory hippocampal neurons expressed other NMDA receptor subunits, we crossed the N2A and N2B KO mouse lines to generate DKO mice that lacked N2A and N2B. Neurons from these mice showed no NMDA receptor-mediated EPSCs (0/18), but had normal AMPA receptor-mediated EPSCs (Fig. 1E). In addition, most DKO neurons (38/44) lacked any current in response to exogenously applied NMDA (100 μm; Fig. 1F). In the 6 DKO neurons with NMDA-evoked currents, the mean peak amplitude of this current (Fig. 1G) was <0.5% (0.039 ± 0.013 nA) of the mean wild-type controls (8.2 ± 0.6 nA, n = 18). We were able to determine that two of these six were GABAergic interneurons; however, we did not determine the neurotransmitter phenotype of the other four neurons. Our data demonstrate that genetic deletion of both N2A and N2B results in excitatory hippocampal neurons with no NMDA receptor-mediated EPSCs and no NMDA-evoked currents.
In the absence of N2 subunits, NMDA receptors composed of N1 and N3 can form, but these receptors are gated by glycine exclusively rather than by glutamate and glycine (Chatterton et al., 2002). Glycine application (100 μm for 500 ms) in the presence of strychnine (2–10 μm, Vhold = −70 mV) resulted in small inward currents in DKO neurons (−4.6 ± 1.0 pA; n = 19). However, when the holding potential was shifted to −35 mV, glycine application produced small outward currents (32.4 ± 9.5 pA; n = 4), consistent with a glycine receptor-mediated chloride conductance. These results confirm that the predominant NMDA receptor subunits expressed in excitatory hippocampal neurons are N1, N2A, and N2B and validate our use of neurons from N2A and N2B KO mice as models for diheteromeric B-type and A-type NMDA receptors.
Diheteromeric synaptic receptors
To estimate the contribution of A- and B-type receptors to EPSCs in wild-type neurons, we measured the NMDA receptor-mediated EPSC deactivations from N2A and N2B KO neurons. The EPSC deactivations from wild-type and N2A and N2B KO neurons were well fit with the sum of two exponentials. As expected for A-type receptors, EPSC deactivations from N2B KO neurons were much faster than B-type EPSC deactivations from N2A KO neurons. Wild-type EPSCs had intermediate deactivation kinetics (Fig. 2A, Table 1). The behavior of wild-type EPSCs could result from the combination of two diheteromeric receptor subtypes or it could include a contribution from AB-type receptors. In A-type receptor EPSCs (from N2B KO neurons), τslow contributes minimally to the deactivation because of the small value of Islow. Therefore, the wild-type EPSC amplitude at long latency after the peak (>1000 ms) will lack any contribution from A-type receptors. The amplitude of the wild-type EPSC at this long latency then provides an estimate of the maximal contribution from B-type NMDA receptors to the wild-type EPSC deactivation if A- and B-type receptors are the only NMDA receptor subtypes present.
Figure 2.

Deactivation kinetics of NMDA receptor-mediated EPSCs. A, Fast and slow time constants (τfast and τslow) from fitting the A-type, B-type, and wild-type (WT) neuron EPSC deactivation are plotted individually (red traces) ± 1 SD (gray regions). The relative contributions ± 1 SD of each time constant are shown at left. The black traces represent the EPSC deactivation from a representative neuron from each cell type. For each group, n = 35 neurons. B, Traces on the left show the superimposed and peak-scaled two-exponential functions using the mean deactivation parameters from A-type EPSCs (black trace) and B-type EPSCs (gray trace). The deactivation from a representative wild-type EPSC is plotted in red. The plot on the right shows that at 1000 ms after the peak, the A-type EPSC has returned to baseline, whereas EPSCs from wild-type and B-type neurons contribute a small amount of current at this long latency. The dashed rectangle on the left shows the region indicated in the plot on the right. Dashed lines indicate the range (200 ms) over which the amplitude measurement was made. C, Cumulative distribution of the estimate of the maximum amount of B-type current in the wild-type EPSCs (n = 51). The mean (red line) and 1 SD (dashed lines) are shown. D, Black trace shows the plot of a two-exponential function using the mean parameters from wild-type EPSC deactivation superimposed on a simulated EPSC deactivation made from the sum of B-type and A-type exponential functions (gray) ± 1 SD (gray region). The black dashed line shows the mean (23.9% B-type plus 76.1% A-type). The red trace is the fit of the mean, constrained with the mean τfast and τslow from wild-type EPSCs. Note that ∼20% of the simulated EPSC deactivation could not be fit with these parameters.
Table 1.
Kinetic parameters of NMDA receptor-mediated EPSC deactivation
| Condition | τfast (ms) | Ifast | τslow (ms) | Islow | τw (ms) | Po* | Q60 (ms) |
|---|---|---|---|---|---|---|---|
| WT | 43.7 ± 11.2 | 0.803 ± 0.105 | 343.8 ± 99.3 | 0.198 ± 0.094 | 107.6 ± 61.3 | 0.35 ± 0.08 | 24.2 ± 7.1 |
| N2B KO (A-type) | 19.8 ± 2.1 | 0.993 ± 0.085 | 119.8 ± 69.7 | 0.036 ± 0.017 | 22.7 ± 2.2 | 0.52 ± 0.06 | 14.0 ± 1.8 |
| N2A KO (B-type) | 142.7 ± 31.0 | 0.369 ± 0.088 | 596.9 ± 137.8 | 0.606 ± 0.101 | 314.9 ± 73.3 | 0.24 ± 0.08 | 109.7 ± 25.2 |
| AB-type | 35.3 ± 3.3 | 0.841 ± 0.039 | 322.8 ± 71.9 | 0.143 ± 0.033 | 78.7 ± 12.6 | 0.28 ± 0.07 | 58.7 ± 26.8 |
| AB-type + ifenprodil | 41.5 ± 4.38 | 0.811 ± 0.069 | 370.5 ± 170 | 0.118 ± 0.048 | 78.3 ± 16.4 | ND | ND |
| AB-type + zinc | 44.9 ± 7.66 | 0.693 ± 0.044 | 317.1 ± 71.1 | 0.264 ± 0.038 | 118.9 ± 22.1 | ND | ND |
| AB-type, model | 41.6 ± 0.3 | 0.869 ± 0.039 | 164.3 ± 78.5 | 0.131 ± 0.039 | ND | ND | ND |
Data are shown as means ± SD. ND indicates not determined.
To make this estimate, we peak-scaled wild-type EPSCs with a two-exponential function made from the mean B-type EPSC deactivation parameters (from N2A KO neurons) and measured the ratio of the wild-type current amplitude to that of B-type at 1000 ms after the EPSC peak (>8 times τslow for A-type receptors; Fig. 2B). The amplitude of the wild-type EPSC measured in the time window (200 ms) corresponded to a maximal contribution from B-type receptors of 23.9 ± 2.3% (n = 51; Fig. 2C). This estimate assumes that there is no long latency contribution from triheteromeric receptors at 1000 ms after the peak. To determine whether linear summation of A-type and B-type receptors was sufficient to approximate the deactivation of wild-type EPSCs, we added the mean waveforms from A-type and B-type EPSCs, with our estimate of the maximal contribution to the EPSC from B-type receptors ± 1 SD (23.9 ± 16.6%) added to a balance from A-type receptors (76.1 ± 16.6%). The summed waveform did not match the wild-type deactivation waveform and was not well fit using a two-exponential function constrained by the mean wild-type deactivation time constants (Fig. 2D, red dashed line). Therefore, estimates based on combinations of diheteromeric EPSC waveforms fail to recapitulate the wild-type EPSC deactivation.
NVP-AAM077 and NMDA EPSCs
Our kinetic analysis suggested the presence of a third type of synaptic NMDA receptor. We used a pharmacological approach to address this possibility. An ideal subtype-specific competitive antagonist should simply prevent agonist binding and otherwise not affect channel gating. Although zinc and ifenprodil differ in their affinity for different NMDA receptor subtypes by >2 orders of magnitude (Neyton and Paoletti, 2006), these modulatory ligands prolong NMDA receptor-mediated EPSC deactivations (Tovar and Westbrook, 2012), making them unsuitable for our analysis strategy. We used the competitive antagonist NVP-AAM077 (NVP) because A-type and B-type receptors differ in their IC50 for NVP by an order of magnitude (Neyton and Paoletti, 2006). As expected, A-type receptor EPSCs were more sensitive to NVP by a factor of 10 than B-type receptor EPSCs (A-type: IC50 = 10.01 ± 0.82 nm, nH = 1.05 ± 0.06; B-type: IC50 = 119.41 ± 8.34 nm; nH = 1.14). Wild-type neuron EPSCs had an intermediate sensitivity to NVP (IC50 = 37.4 ± 6.2 nm; nH = 1.00 ± 0.10). The single-site isotherm fit to the wild-type dose-inhibition curve (Fig. 3A, red) was much better than a two-component isotherm using the IC50 for A-type and B-type receptors (Fig. 3A, solid black).
Figure 3.
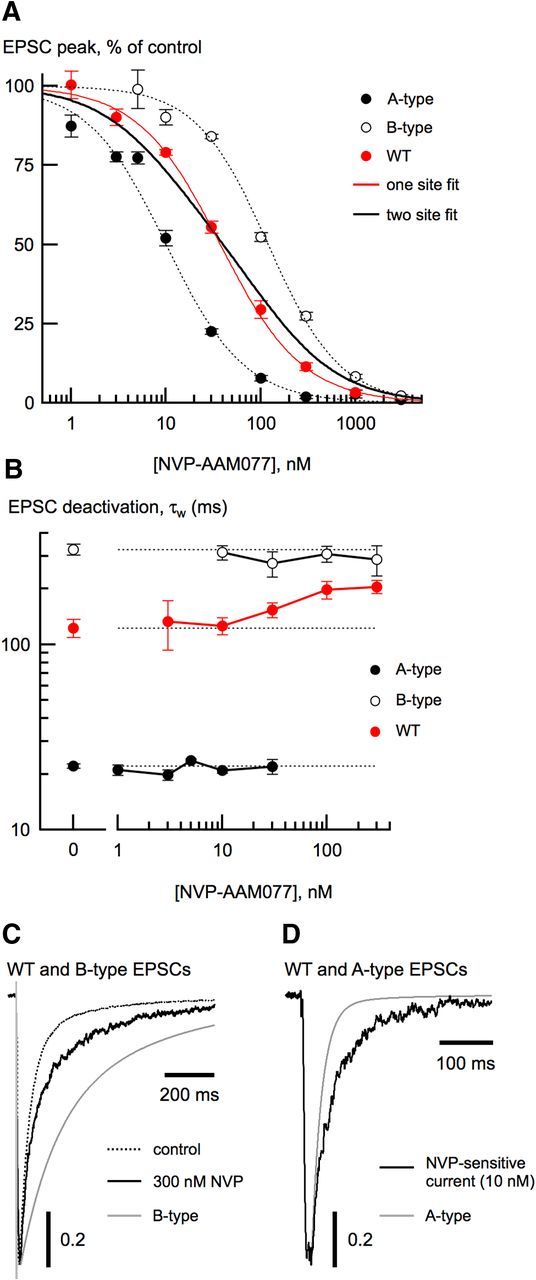
Using a competitive antagonist to separate NMDA receptor subtypes. A, NVP-AAM077 dose-inhibition curves from A-type (closed circles), B-type (open circles), and wild-type (WT; red circles) EPSCs. Data from all neuron types were well fit with a single site isotherm (see Materials and Methods). Fits to data from A-type and B-type EPSCs are shown with dashed lines. The single-site isotherm fit of the wild-type EPSC dose-inhibition data (red trace) was much better (χ2 = 0.34) than a fit using a two-site isotherm (χ2 = 6.71) with the IC50 values from A-type and B-type EPSCs and the contribution of each unconstrained (black trace). For this fit, the fractional contribution from B-type receptors was 0.54 ± 0.07. Each NVP concentration represented the mean reduction from 4 to 14 neurons from each of the three cell types. B, τw from A-type, B-type, and wild-type neuron EPSCs as a function of NVP concentration. As expected, τw of wild-type EPSCs increased with increasing NVP concentration, consistent with selective elimination of A-type receptors. Note that τw of wild-type EPSCs never became as slow as τw from B-type EPSCs. C, At high NVP concentration, the wild-type EPSC deactivation (black trace) was still slower than the mean B-type deactivation (gray trace). D, In wild-type neurons, the deactivation of the current resulting from subtracting the EPSC in 10 nm NVP (black trace) from the control EPSC is slower than the mean A-type EPSC deactivation (gray trace).
If wild-type EPSCs result solely from mixtures of A-type and B-type NMDA receptors, then the EPSC deactivation should become progressively slower with increasing NVP concentrations because low NVP concentrations will preferentially block the faster A-type receptors. Therefore, at high NVP concentrations (≥100 nm), the deactivation of the unblocked EPSC should be composed almost exclusively of B-type receptors. The weighted EPSC deactivation time constants of wild-type EPSCs became slower with increasing NVP concentrations (Fig. 3B), consistent with block of A-type receptors. However, wild-type EPSCs never became as slow as those from B-type NMDA receptors. Even at an NVP concentration (300 nm) at which 97% of the A-type receptors are expected to be blocked, the wild-type EPSC deactivation (τw = 204.5 ± 16.7 ms; n = 16) was still faster than the deactivation from B-type receptors (τw = 325 ± 22.2 ms; n = 14; p < 0.0001; Fig. 3C). NVP did not modulate receptor gating, because increasing the NVP concentration had no effect on EPSC deactivations of diheteromeric receptors in knock-out neurons (Fig. 3B).
By similar reasoning, if wild-type EPSCs are composed exclusively of A-type and B-type receptors, we should be able to isolate an NVP-sensitive A-type component because low concentrations of NVP (≤10 nm) have little effect on B-type receptors. We therefore subtracted the wild-type EPSC in 10 nm NVP from the control EPSC (Fig. 3D). The NVP-sensitive difference current deactivation was significantly slower (τw = 68.9 ± 12.6, n = 18) than the deactivation in N2B KO EPSCs (τw = 22.1 ± 0.5 ms, n = 20; p < 0.0005). Overall, the NVP data confirm the kinetic analysis that A-type and B-type receptors cannot be the sole receptor types contributing to wild-type EPSCs. In addition, the wild-type EPSC dose-inhibition data were well fit with a single-site isotherm, raising the possibility that a third receptor type with intermediate NVP sensitivity is the major component.
Receptor open probability and the NMDA receptor subtype
The opening kinetics of A-type and B-type synaptic receptors are distinct and result in differences in channel open probability, as measured in KO neurons (Tovar and Westbrook, 2012). We therefore investigated whether differences in the opening kinetics between receptor subtypes could be used to reveal a third NMDA receptor population. To examine the relative contribution of different synaptic NMDA receptor subtypes, we measured the latency to first opening (after neurotransmitter binding) and the conditional channel open probability of KO and wild-type neurons. We used the high-affinity NMDA receptor open channel blocker MK-801 for this purpose (Huettner and Bean, 1988; Fig. 4A), because only channels that open in response to synaptically released glutamate will be blocked and because blocked channels do not become unblocked during the experiment. Blocking by MK-801 is limited by the channel opening rate after glutamate binding (Jahr, 1992; Tovar and Westbrook, 2012). Therefore, the EPSC in high concentrations of MK-801 (>20 μm) is a distribution of how long it takes for channels to open after neurotransmitter binding (first latency), as shown in Figure 4A (top red trace). We used two measures to compare receptor types. We integrated the EPSC to measure the charge transfer and used the time at which 60% of charge transfer (Q60) in MK-801 has occurred (Fig. 4A, lower trace). We also measured the probability of a channel having opened by the time of the control EPSC peak (Po*), which is the ratio of charge at control EPSC peak to the total charge.
Figure 4.

Opening kinetics of synaptic NMDA receptor subtypes. A, Time course of the EPSC from a wild-type neuron (top, black trace) is accelerated in MK-801 (top, red trace) because channel openings are shortened. When the EPSC is integrated, the time at 60% charge transfer (Q60) of the EPSC in MK-801 (25 μm) can be used as a relative measurement of how quickly NMDA receptor channels open after binding to synaptically-released glutamate. This is because MK-801 only binds to open channels, binds quickly, and does not dissociate during the course of the experiment. In MK-801, the ratio of charge at the time of the control EPSC peak (a) to the total charge (b) gives the probability of a channel having opened by the time of the peak. The red arrow indicates the Q60 for this EPSC in MK-801. The Q60 of the control EPSC is shown with the black arrowhead. Q60 (B) and the Po* (C) from A-type, B-type, and wild-type (WT) EPSCs. Wild-type EPSCs differed from A-type and B-type EPSCs in Q60 (p < 10−5 and p < 0.001, respectively) and Po* (p < 10−5 and p < 0.005, respectively). D, Q60 of wild-type EPSCs (in red) as a function of NVP concentration. As shown, the Q60 became slower as A-type receptors were blocked by NVP but never became as slow as B-type receptors. The Q60 mean (dashed line) ± 1 SD (gray region) is shown for B-type (top) and A-type (bottom) EPSCs. Q60 values for A-type and B-type receptors are from B. E, Po* of wild-type EPSCs as a function of NVP concentration (in red). Po* mean (dashed line) ± 1 SD (gray region) is shown for A-type (top) and B-type (bottom) EPSCs. Po* values are from C.
The values of Q60 and Po* for wild-type EPSC differed significantly from either A-type or B-type receptors (Fig. 4B,C, respectively). To expand this analysis, when we eliminated fast A-type receptors in wild-type neurons with increasing concentrations of NVP, the Q60 increased, as expected from an increasing contribution from B-type receptors (Fig. 4D). However, even when we blocked 92% of A-type receptors with 100 nm NVP, the Q60 of the remaining wild-type EPSC (47.8 ± 2.2 ms; n = 7) was still much faster than for B-type receptors (109.7 ± 6.7 ms; n = 14; p < 10−6). Moreover, increasing NVP from 30 to 100 nm halved the EPSC peak, but the Q60 did not change (30 nm: 50.2 ± 8.2 ms; n = 7, p = 0.69). Similarly, the Po* of wild-type EPSCs changed only slightly in NVP (control: 0.35 ± 0.01; 100 nm NVP: 0.30 ± 0.01; p < 0.05; Fig. 4E). Therefore, the opening kinetics of wild-type EPSCs in the absence of A-type receptors must reflect a significant population of receptors other than B-type receptors.
Relative contribution of A-, B-, and AB-type receptors to wild-type EPSCs
We used the NVP dose-inhibition data and the deactivation kinetics of A-type and B-type receptors to estimate the relative contribution of NMDA receptor subtypes to the wild-type EPSCs. We tested five NVP concentrations on each neuron because wild-type EPSC deactivations were considerably more variable than EPSCs from KO neurons (Table 1), as expected if two or more receptor types contribute to wild-type EPSCs. Dose-inhibition data from several wild-type neurons are shown superimposed on fits to the dose-inhibition data from N2A and N2B KO neurons in Figure 5A. The single-site isotherm fits for each individual neuron were distinctly steeper than the theoretical mixes of A- and B-type receptors. The mean Hill coefficient for the individual neurons was 1.04 ± 0.03 (n = 10), consistent with a predominant contribution from a novel receptor–antagonist interaction.
Figure 5.

Quantitative estimate of the contribution of NMDA receptor subtypes to wild-type EPSCs. A, EPSCs from wild-type neurons were tested in five concentrations of NVP each and the data from each neuron were fit with a single-site isotherm. As shown, each fit (red lines) was steeper than predictions for mixtures of A-type and B-type receptors, ranging from 3:1 to 1:3 (gray shaded region). The solid black line describes where the contribution of A-type and B-type receptors is equal. The mean IC50 from these fits was 30.0 ± 1.4 nm (n = 10). B, Dose-inhibition data from each neuron were combined with the NVP-induced changes in the deactivation kinetics and the known reduction of A- and B-type EPSCs in NVP to estimate the contribution of A-type, B-type, and AB-type receptors to the EPSCs from each cell (see Materials and Methods).
The pharmacological and kinetic properties of A- and B-type receptor EPSCs were used to estimate the contribution of each NMDA receptor subtype to wild-type EPSCs. This estimate was based on the known reduction of A- and B-type receptors by NVP and the fact that the deactivation of wild-type EPSCs became slower with increasing NVP concentrations, whereas the deactivations of pure A-type or B-type in KO neurons did not. We used these data to constrain a series of two-exponential fits (A-type, B-type, and unconstrained) of the wild-type EPSC deactivation and dose-inhibition data at each of the five NVP concentrations tested. The unconstrained variables provided the kinetic and dose-inhibition characteristics of AB-type receptors (see Materials and Methods). The contribution of diheteromeric receptors to the wild-type EPSC was surprisingly small (A-type: 20.1 ± 2.8%; B-type: 16.8 ± 3.0%), whereas the contribution of triheteromeric AB-type NMDA receptors predominated (AB-type: 63.1 ± 4.1%; Fig. 5B). The model predicts that AB-type receptors have an NVP IC50 of 28.7 ± 1.2 nm with a Hill coefficient of 1.17 ± 0.08 (n = 9), comparable to the mean IC50 and Hill coefficient from fits of each of the 5-point dose-inhibition curves (30.0 ± 1.4 nm). Therefore, our data indicate that at least two-thirds of the wild-type EPSC results from activation of triheteromeric AB-type receptors.
Properties of triheteromeric NMDA receptor-mediated EPSCs
Although triheteromeric receptors have been implicated in synaptic transmission (Gray et al., 2011; Rauner and Köhr, 2011), it has not been possible to examine directly the properties of these receptors. To investigate triheteromeric receptors in relative isolation, we first evoked wild-type EPSCs in the presence of NVP (100–200 nm) and MK-801 (25 μm). At this concentration, NVP prevents opening of 92–97% of A-type receptors, thus masking their contribution to the EPSC. The remaining EPSC (resulting from B- and AB-type receptors) was repeatedly evoked in the presence of MK-801 (50–75 episodes; Fig. 6A), resulting in a progressive and permanent block of the receptors not protected by NVP (Rosenmund et al., 1993; see Materials and Methods for details). Because B-type receptors are less NVP sensitive, they should become permanently blocked during stimulation in NVP/MK-801, thus enriching the contribution of A-type receptors to the remaining EPSC. After removal of NVP and MK-801, the A- and AB-type receptors that had been masked by NVP constituted 36.4 ± 2.8% of the control EPSC (n = 17). Consistent with enrichment of A-type receptors, the τw of the remaining EPSC after removal of NVP/MK-801 was faster (44.2 ± 1.9 ms) than before NVP/MK-801 application (88.5 ± 5.8 ms; p < 10−6; Fig. 6B,C). Finally, to isolate AB-type receptors, EPSCs were recorded in 50 nm NVP, which blocks 86% of A-type receptors. With this enrichment method, coupled with the reduction of the EPSC by 50 nm NVP, we estimated the maximal contamination of A-type receptors in the triheteromeric-enriched EPSC to be <6% (see Materials and Methods).
The weighted deactivation time constant of the triheteromeric AB-type receptor-enriched EPSC was 78.7 ± 3.0 ms (n = 18). The deactivation of AB-type receptor EPSCs was similar to the EPSC kinetics preceding NVP/MK-801 application (p = 0.31, paired comparison; Fig. 6C), but substantially faster than B-type receptors. Because removal of the B-type receptors did not affect the deactivation, this result provides further evidence that AB-type NMDA receptors constitute the major receptor type at wild-type hippocampal neuron synapses. Because τslow contributes significantly to the deactivation of enriched AB-type EPSCs (Table 1), the contribution of B-type receptors to the wild-type EPSC may actually be much less than our previous maximal estimate based on EPSC deactivation (Fig. 2C). Consistent with this idea, the estimate of the maximal contribution of B-type receptors in the wild-type EPSCs from these neurons (Fig. 6D), done as in Figure 2C, was not affected by isolation of AB-type receptors (18.8 ± 1.9% before and 21.5 ± 1.7% after, n = 17, p = 0.23).
Functional isolation of AB-type receptors permitted us to examine their basic properties directly (Fig. 7, Table 1). The Po* from these receptors, as measured using the MK-801 method, was 0.28 ± 0.02 (n = 9), closer to the value for B-type than A-type receptors (Fig. 4C). The NMDA receptor ligands zinc and ifenprodil bind to homologous regions of the N2A and N2B amino-terminal domain, respectively (Paoletti, 2011) These ligands have been used extensively to examine A- and B-type receptors, but how these ligands affect AB-type receptors directly at synapses is unknown. As shown in Figure 7A, both ligands decreased the peak of the AB-type receptor-enriched EPSC, but only zinc prolonged the deactivation. This result indicates that, in AB-type receptors, occupancy of a single high-affinity zinc-binding site produces synaptic charge redistribution.
Figure 7.

Kinetic and pharmacological characteristics of AB-type receptors. A, Isolated AB-type EPSCs are reduced by zinc (left; 100 nm, free) or ifenprodil (right; 3 μm), but only zinc prolongs the EPSC deactivation, as shown by the peak-scaled EPSCs in the insets. Asterisk in the left panel indicates the point where the EPSC in zinc crosses the control EPSC, indicative of a prolongation, rather than simply revealing a slow EPSC component. WT indicates wild-type. B, For synaptic ligand-gated channels under nonequilibrium agonist conditions, the reduction in total charge as a function of reduction of the peak in response to competitive antagonists should fall on the unity line, as shown for NVP on A-type EPSCs (black circles and lines). The red dashed line is a linear fit to the data from NVP on A-type EPSCs, with the slope indicated in the figure (r2 = 0.99). Zinc or ifenprodil each produce a slight potentiation of charge of A-type (open red circle) and B-type (open black circles) EPSCs from KO neurons, as indicated in the upward departure of these points from unity. In AB-type receptors, only zinc (100 nm, free) prolongs the EPSC (closed red circle), whereas ifenprodil (3 μm) does not (closed black circle). The NVP concentrations used were as follows (in nm): 1, 3, 10, 30, and 100.
To compare the actions of these amino-terminal domain ligands, we plotted the ligand-induced change in total charge transfer as a function of the change in the EPSC peak amplitude (Fig. 7B). Competitive antagonists such as NVP are not expected to alter the EPSC deactivation kinetics. Therefore, for any dose of NVP, the reduction in EPSC peak and charge should fall on the unity line, as shown for NVP on A-type EPSCs. Ifenprodil (3 μm) reduced the EPSC peak and charge of AB-type receptors to similar degrees, consistent with its lack of effect on the deactivation, producing a result comparable to that of a competitive antagonist. In contrast, zinc (100 nm, free) greatly prolonged the EPSC deactivation of AB-type receptors, resulting in a significant redistribution of charge attributed to the τslow component of deactivation (60.3 ± 1.3% in control; 72.1 ± 1.9% in 100 nm zinc; n = 9; p < 0.001). AB-type receptors thus showed a departure from unity in Figure 7B that was comparable to A-type receptors.
Discussion
We used a kinetic and pharmacological approach to investigate the relative contribution of NMDA receptor subtypes to EPSCs in wild-type mouse hippocampal neurons. This approach revealed that the majority contribution to EPSCs was from receptors with a triheteromeric molecular composition containing N2A and N2B along with N1; diheteromeric receptors together accounted for at most one-third of the wild-type EPSC. Isolation of the triheteromeric population revealed kinetic and pharmacological properties that were distinct from either A- or B-type receptors. Our results indicate that NMDA receptor assembly, targeting, and function in synaptic plasticity could be largely determined by AB-type receptors.
Evidence for triheteromeric receptors
Although it has often been assumed that cortical synapses contain predominately (or exclusively) diheteromeric NMDA receptors with either N2A or N2B subunits, multiple lines of evidence have suggested that this view is too simplistic. N2A and N2B can assemble in the same biochemical protein complex in rodent cortex, suggesting the existence of triheteromeric receptors (Chazot et al., 1994; Sheng et al., 1994; Luo et al., 1997; Dunah and Standaert, 2003), although their relative abundance in postsynaptic density preparations from the hippocampus has been questioned (Al-Hallaq et al., 2007). From a functional perspective, triheteromeric receptors also have been identified in heterologous cells (Hatton and Paoletti, 2005). Recently, the fact that NMDA receptor-mediated EPSC properties cannot be explained based on diheteromeric receptor properties has implicated triheteromeric receptors at hippocampal synapses (Gray et al., 2011; Rauner and Köhr, 2011). Because hippocampal neurons in our experiments expressed only NR1, N2A, and N2B, we were able to characterize three subtypes of synaptic NMDA receptors. The wild-type EPSC deactivation time course could not be accounted for by summation of the deactivation time courses of A- and B-type receptors. Our analysis assumes that A-type and B-type receptors in KO and wild-type neurons have identical properties. We isolated functionally and characterized the third population, the AB-type receptor. These receptors had kinetic and pharmacological properties that reflected a contribution of both N2A and N2B. Neurons often express more than one type of N2 subunit. Therefore, triheteromeric NMDA receptors in other cell types may be more common than thought previously. For example, triheteromeric receptors have been suggested in cerebellar Golgi cells and in the basal ganglia (Cathala et al., 2000; Suárez et al., 2010). Splice variants of the NR1 subunit (Rumbaugh et al., 2000) could add further complexity to the functional properties of triheteromeric receptors.
Implications for assembly and localization of AB-type synaptic receptors
Because single cells express multiple types of NMDA receptors, neurons likely possess mechanisms that control receptor assembly and localization at synapses. For example, synaptic inputs onto single neurons from different pathways activate synaptic NMDA receptors with different properties (Kumar and Huguenard, 2003; Arrigoni and Greene, 2004). By using the differences in Po* between receptor subtypes and their relative contribution to the wild-type EPSC amplitude in excitatory hippocampal neurons, we calculated that AB-type receptors are 5.8 and 3.2 times more abundant at these synapses than A- or B-type receptors, respectively. Whether this selectivity for AB-type receptors results from preferential assembly or preferential localization has yet to be determined. The initial step in receptor assembly is the dimerization of N1 and N2 subunits, followed by association of dimers into tetramers (Furukawa et al., 2005; Schüler et al., 2008). If we assume equal expression levels of N2A and N2B (Monyer et al., 1994) and comparable association rates between N1 and N2A or N2B, then AB-type receptors should only be twice as abundant at synapses as either A- or B-type receptors. Because overexpression of individual subunits does not affect the synaptic NMDA receptors complement (Prybylowski et al., 2002), the excess of AB-type receptors may result from preferential retention at synapses. The preponderance of AB-type receptors at synapses indicates that localization or anchoring of NMDA receptors at synapses cannot be determined simply by the association of either N2A or N2B with postsynaptic density proteins. The intracellular C-terminal domains of N2A and N2B and their binding partners confer distinct roles in synaptic signaling (Ryan et al., 2013). It is therefore interesting that the majority of synaptic NMDA receptors have access to a broader than expected array of intracellular signaling pathways.
Influence of N2A and N2B in triheteromeric receptors
The vast majority of NMDA receptor activation occurs at synapses after phasic release of neurotransmitter. The time course of NMDA receptor activation reflects a combination of the nonstationary nature of transmitter presentation and the constituent receptor subtypes that are activated. Within this context, the nonequilibrium behavior of triheteromeric synaptic receptors revealed several interesting molecular outcomes. The EPSC deactivation kinetics of AB-type receptors were more similar to those of A-type than B-type receptors, indicating a predominant influence of the N2A subunit on deactivation. In contrast, the Po* of AB-type receptors was more similar to B-type than A-type receptors, suggesting that the N2B subunit has a predominant influence on gating steps that lead to the open state. The N2 subunits contain the binding site for glutamate and gating of NMDA receptors requires binding of two glutamate molecules (Clements and Westbrook, 1991). Therefore, the distinct kinetics of AB-type receptors could simply arise from the molecular compromise of rapid glutamate unbinding from N2A producing the fast phase of deactivation, whereas the influence of N2B is rate limiting for channel opening. However, more complex allosteric explanations are also possible. We did not measure the voltage dependence or calcium permeability of AB-type receptors. However, these properties of NMDA receptors, unlike the deactivation kinetics and open probability, are quite similar between A- and B-type receptors (Monyer et al., 1994), so AB-type receptors are likely to be similar to diheteromeric receptors.
Revisiting subunit-specific NMDA receptor antagonists
Ifenprodil, NVP, and zinc have been used to classify native NMDA receptor subtypes as either “N2A-containing” or “N2B-containing,” thus creating the perception that native receptors are predominantly diheteromeric. These antagonists have been used to study synaptic plasticity and in developmental and behavioral experiments to assign functional roles to particular NMDA receptor subunits. However, this pharmacological strategy is valid only if triheteromeric receptors are not present or if they can be similarly pharmacologically separated. Our results indicate that zinc or ifenprodil also reduce EPSCs directly from AB-type receptors, but less potently than for A- or B-type receptor EPSCs. This reduction is consistent with lower efficacy of these ligands for the AB-type receptor (Hatton and Paoletti, 2005). The intermediate effects of ifenprodil and zinc, as well as the competitive antagonist NVP on triheteromeric receptors, indicates that these ligands act on multiple NMDA receptor subtypes. Therefore, many of the experimental findings that have resulted from the use of ifenprodil or NVP could have arisen simply from a reduction in the NMDA receptor-mediated EPSC (Berberich et al., 2005) rather than from a subtype-specific action.
Implications for therapeutics
Allosteric modulators such as ifenprodil and its derivatives have been investigated extensively for their therapeutic potential for neurological and psychiatric disorders (Mony et al., 2009; Popescu et al., 2010). Drugs that alter channel gating may have greater therapeutic potential than competitive antagonists that simply prevent channel gating. The effects of benzodiazepines or barbiturates on IPSCs provide one such example (Zhang et al., 1993). Assessment of such modulators requires consideration of the phasic nature of neurotransmitter release and nonstationary receptor activation, the latter being the predominant form of NMDA receptor activation. Zinc and ifenprodil prolong EPSCs in A-type and B-type synaptic receptors, respectively, by increasing the total amount of time the fully bound receptor spends in a closed state (Tovar and Westbrook, 2012). Although these effects were pronounced in homogenous synaptic diheteromeric receptor populations, in wild-type EPSCs, only zinc prolonged the deactivation.
Drugs that target B-type receptors or the N2B amino-terminal domain have proven to be of limited clinical relevance (Villmann and Becker, 2007). Two observations from our work provide a potential explanation for the lack of efficacy of ifenprodil and its derivatives as therapeutics. First, B-type receptors, at least in the hippocampal neurons in our experiments, are a minor component of wild-type EPSCs. Second, the ifenprodil effect on AB-type receptors was functionally analogous to that of a competitive antagonist, whereas zinc prolonged EPSCs generated by triheteromeric AB-type receptors. This difference indicates that the amino-terminal domains of N2A and N2B contribute differentially to gating in the AB-type receptor complex (Gielen et al., 2009). If our results showing that AB-type receptors are predominant at synapses are generalizable to other neurons that express N2A and N2B, then drugs that target the amino-terminal domain of the N2A subunit may prove more promising as clinical therapeutics (Nozaki et al., 2011).
Footnotes
This work was supported by NIH (Grant #NS 26494 and Grant #MH 46613 to G.L.W.). We thank Dr. Masayoshi Mishina for the gift of the N2A- and N2B-knock-out mice, Dr. Yves Auberson (Novartis Pharma AG, Basel, Switzerland) for the gift from NVP-AAM077, Drs. Craig Jahr and Eric Schnell for their careful reading and comments on this manuscript, and AeSoon Bensen for technical assistance.
References
- Al-Hallaq RA, Conrads TP, Veenstra TD, Wenthold RJ. NMDA di-heteromeric receptor populations and associated proteins in rat hippocampus. J Neurosci. 2007;27:8334–8343. doi: 10.1523/JNEUROSCI.2155-07.2007. [DOI] [PMC free article] [PubMed] [Google Scholar]
- Arrigoni E, Greene RW. Schaffer collateral and perforant path inputs activate different subtypes of NMDA receptors on the same CA1 pyramidal cell. Br J Pharmacol. 2004;142:317–322. doi: 10.1038/sj.bjp.0705744. [DOI] [PMC free article] [PubMed] [Google Scholar]
- Auberson YP, Allgeier H, Bischoff S, Lingenhoehl K, Moretti R, Schmutz M. 5-Phosphonomethylquinoxalinediones as competitive NMDA receptor antagonists with a preference for the human 1A/2A, rather than 1A/2B receptor composition. Bioorg Med Chem Lett. 2002;12:1099–1102. doi: 10.1016/S0960-894X(02)00074-4. [DOI] [PubMed] [Google Scholar]
- Berberich S, Punnakkal P, Jensen V, Pawlak V, Seeburg PH, Hvalby Ø, Köhr G. Lack of NMDA receptor subtype selectivity for hippocampal long-term potentiation. J Neurosci. 2005;25:6907–6910. doi: 10.1523/JNEUROSCI.1905-05.2005. [DOI] [PMC free article] [PubMed] [Google Scholar]
- Cathala L, Misra C, Cull-Candy S. Developmental profile of the changing properties of NMDA receptors at cerebellar mossy fiber-granule cell synapses. J Neurosci. 2000;20:5899–5905. doi: 10.1523/JNEUROSCI.20-16-05899.2000. [DOI] [PMC free article] [PubMed] [Google Scholar]
- Chatterton JE, Awobuluyi M, Premkumar LS, Takahashi H, Talantova M, Shin Y, Cui J, Tu S, Sevarino KA, Nakanishi N, Tong G, Lipton SA, Zhang D. Excitatory glycine receptors containing the NR3 family of NMDA receptor subunits. Nature. 2002;415:793–798. doi: 10.1038/nature715. [DOI] [PubMed] [Google Scholar]
- Chazot PL, Coleman SK, Cik M, Stephenson FA. Molecular characterization of N-methyl-d-aspartate receptors expressed in mammalian cells yields evidence for the coexistence of three subunit types within a discrete receptor molecule. J Biol Chem. 1994;269:24403–24409. [PubMed] [Google Scholar]
- Chen N, Luo T, Raymond LA. Subtype-dependence of NMDA receptor channel open probability. J Neurosci. 1999;19:6844–6854. doi: 10.1523/JNEUROSCI.19-16-06844.1999. [DOI] [PMC free article] [PubMed] [Google Scholar]
- Chen N, Ren J, Raymond LA, Murphy TH. Changes in agonist concentration dependence that are a function of duration of exposure suggest N-methyl-d-aspartate receptor nonsaturation during synaptic stimulation. Mol Pharm. 2001;59:212–219. doi: 10.1124/mol.59.2.212. [DOI] [PubMed] [Google Scholar]
- Clements JD, Westbrook GL. Activation kinetics reveal the number of glutamate and glycine binding sites on the N-methyl-D-aspartate receptor. Neuron. 1991;7:605–613. doi: 10.1016/0896-6273(91)90373-8. [DOI] [PubMed] [Google Scholar]
- Clements JD, Lester RA, Tong G, Jahr CE, Westbrook GL. The time course of glutamate in the synaptic cleft. Science. 1992;258:1498–1501. doi: 10.1126/science.1359647. [DOI] [PubMed] [Google Scholar]
- Dunah AW, Standaert DG. Subcellular segregation of distinct heteromeric NMDA glutamate receptors in the striatum. J Neurochem. 2003;85:935–943. doi: 10.1046/j.1471-4159.2003.01744.x. [DOI] [PubMed] [Google Scholar]
- Fayyazuddin A, Villarroel A, Le Goff A, Lerma J, Neyton J. Four residues of the extracellular N-terminal domain of the NR2A subunit control high-affinity Zn2+ binding to NMDA receptors. Neuron. 2000;25:683–694. doi: 10.1016/S0896-6273(00)81070-3. [DOI] [PubMed] [Google Scholar]
- Furukawa H, Singh SK, Mancusso R, Gouaux E. Subunit arrangement and function in NMDA receptors. Nature. 2005;438:185–192. doi: 10.1038/nature04089. [DOI] [PubMed] [Google Scholar]
- Gielen M, Siegler Retchless BS, Mony L, Johnson JW, Paoletti P. Mechanism of differential control of NMDA receptor activity by NR2 subunits. Nature. 2009;459:703–707. doi: 10.1038/nature07993. [DOI] [PMC free article] [PubMed] [Google Scholar]
- Hatton CJ, Paoletti P. Modulation of triheteromeric NMDA receptors by N-terminal ligands. Neuron. 2005;46:261–274. doi: 10.1016/j.neuron.2005.03.005. [DOI] [PubMed] [Google Scholar]
- Huettner JE, Bean BP. Block of N-methyl-d-aspartate-activated current by the anticonvulsant MK-801: selective binding to open channels. Proc Natl Acad Sci U S A. 1988;85:1307–1311. doi: 10.1073/pnas.85.4.1307. [DOI] [PMC free article] [PubMed] [Google Scholar]
- Gray JA, Shi Y, Usui H, During MJ, Sakimura K, Nicoll RA. Distinct modes of AMPA receptor suppression at developing synapses by GluN2A and GluN2B: single-cell NMDA receptor subunit deletion in vivo. Neuron. 2011;71:1085–1101. doi: 10.1016/j.neuron.2011.08.007. [DOI] [PMC free article] [PubMed] [Google Scholar]
- Jahr CE. High probability opening of NMDA receptor channels by L-glutamate. Science. 1992;255:470–472. doi: 10.1126/science.1346477. [DOI] [PubMed] [Google Scholar]
- Kumar SS, Huguenard JR. Pathway-specific differences in subunit composition of synaptic NMDA receptors on pyramidal neurons in neocortex. J Neurosci. 2003;23:10074–10083. doi: 10.1523/JNEUROSCI.23-31-10074.2003. [DOI] [PMC free article] [PubMed] [Google Scholar]
- Kutsuwada T, Sakimura K, Manabe T, Takayama C, Katakura N, Kushiya E, Natsume R, Watanabe M, Inoue Y, Yagi T, Aizawa S, Arakawa M, Takahashi T, Nakamura Y, Mori H, Mishina M. Impairment of suckling response, trigeminal neuronal pattern formation, and hippocampal LTD in NMDA receptor ε2 subunit mutant mice. Neuron. 1996;16:333–344. doi: 10.1016/S0896-6273(00)80051-3. [DOI] [PubMed] [Google Scholar]
- Logan SM, Partridge JG, Matta JA, Buonanno A, Vicini S. Long-lasting NMDA receptor-mediated EPSCs in mouse striatal medium spiny neurons. J Neurophysiol. 2007;98:2693–2704. doi: 10.1152/jn.00462.2007. [DOI] [PubMed] [Google Scholar]
- Luo J, Wang Y, Yasuda RP, Dunah AW, Wolfe BB. The majority of N-methyl-d-aspartate receptor complexes in adult rat cerebral cortex contain at least three different subunits (NR1/NR2A/NR2B) Mol Pharmacol. 1997;51:79–86. doi: 10.1124/mol.51.1.79. [DOI] [PubMed] [Google Scholar]
- Mony L, Kew JN, Gunthorpe MJ, Paoletti P. Allosteric modulators of NR2B-containing NMDA receptors: molecular mechanisms and therapeutic potential. Br J Pharmacol. 2009;157:1301–1317. doi: 10.1111/j.1476-5381.2009.00304.x. [DOI] [PMC free article] [PubMed] [Google Scholar]
- Monyer H, Burnashev N, Laurie DJ, Sakmann B, Seeburg PH. Developmental and regional expression in the rat brain and functional properties of four NMDA receptors. Neuron. 1994;12:529–540. doi: 10.1016/0896-6273(94)90210-0. [DOI] [PubMed] [Google Scholar]
- Neyton J, Paoletti P. Relating NMDA receptor function to receptor subunit composition: limitations of the pharmacological approach. J Neurosci. 2006;26:1331–1333. doi: 10.1523/JNEUROSCI.5242-05.2006. [DOI] [PMC free article] [PubMed] [Google Scholar]
- Nozaki C, Vergnano AM, Filliol D, Ouagazzal AM, Le Goff A, Carvalho S, Reiss D, Gaveriaux-Ruff C, Neyton J, Paoletti P, Kieffer BL. Zinc alleviates pain through high-affinity binding to the NMDA receptor NR2A subunit. Nat Neurosci. 2011;14:1017–1022. doi: 10.1038/nn.2844. [DOI] [PMC free article] [PubMed] [Google Scholar]
- Paoletti P. Molecular basis of NMDA receptor functional diversity. Eur J Neurosci. 2011;33:1351–1365. doi: 10.1111/j.1460-9568.2011.07628.x. [DOI] [PubMed] [Google Scholar]
- Paoletti P, Neyton J. NMDA receptor subunits: function and pharmacology. Current Opinion in Pharmacology. 2007;7:39–47. doi: 10.1016/j.coph.2006.08.011. [DOI] [PubMed] [Google Scholar]
- Perin-Dureau F, Rachline J, Neyton J, Paoletti P. Mapping the binding site of the neuroprotectant ifenprodil on NMDA receptors. J Neurosci. 2002;22:5955–5965. doi: 10.1523/JNEUROSCI.22-14-05955.2002. [DOI] [PMC free article] [PubMed] [Google Scholar]
- Popescu GK, Murthy S, Borschel WF. Allosteric inhibitors of NMDA receptor functions. Pharmaceuticals. 2010;3:3240–3257. doi: 10.3390/ph3103240. [DOI] [Google Scholar]
- Prybylowski K, Fu Z, Losi G, Hawkins LM, Luo J, Chang K, Wenthold RJ, Vicini S. Relationship between availability of NMDA receptor subunits and their expression at the synapse. J Neurosci. 2002;22:8902–8910. doi: 10.1523/JNEUROSCI.22-20-08902.2002. [DOI] [PMC free article] [PubMed] [Google Scholar]
- Rachline J, Perin-Dureau F, Le Goff A, Neyton J, Paoletti P. The micromolar zinc-binding domain on the NMDA receptor subunit NR2B. J Neurosci. 2005;25:308–317. doi: 10.1523/JNEUROSCI.3967-04.2005. [DOI] [PMC free article] [PubMed] [Google Scholar]
- Rauner C, Köhr G. Triheteromeric NR1/NR2A/NR2B receptors constitute the major N-methyl-d-asparate receptor population in adult hippocampal synapses. J Biol Chem. 2011;286:7558–7566. doi: 10.1074/jbc.M110.182600. [DOI] [PMC free article] [PubMed] [Google Scholar]
- Rosenmund C, Clements JD, Westbrook GL. Nonuniform probability of glutamate release at a hippocampal synapse. Science. 1993;262:754–757. doi: 10.1126/science.7901909. [DOI] [PubMed] [Google Scholar]
- Rumbaugh G, Prybylowski K, Wang JF, Vicini S. Exon 5 and spermine regulate deactivation of NMDA receptor subtypes. J Neurophysiol. 2000;83:1300–1306. doi: 10.1152/jn.2000.83.3.1300. [DOI] [PubMed] [Google Scholar]
- Ryan TJ, Kopanitsa MV, Indersmitten T, Nithianantharajah J, Afinowi NO, Pettit C, Stanford LE, Sprengel R, Saksida LM, Bussey TJ, O'Dell TJ, Grant SG, Komiyama NH. Evolution of GluN2A/B cytoplasmic domains diversified vertebrate synaptic plasticity and behavior. Nat Neurosci. 2013;16:25–32. doi: 10.1038/nn.3277. [DOI] [PMC free article] [PubMed] [Google Scholar]
- Sakimura K, Kutsuwada T, Ito I, Manabe T, Takayama C, Kushiya E, Yagi T, Aizawa S, Inoue Y, Sugiyama H. Reduced hippocampal LTP and spatial learning in mice lacking NMDA receptor e1 subunit. Nature. 1995;373:151–155. doi: 10.1038/373151a0. [DOI] [PubMed] [Google Scholar]
- Schüler T, Mesic I, Madry C, Bartholomäus I, Laube B. Formation of NR1/NR2 and NR1/NR3 heterodimers constitutes the initial step in N-methyl_d-aspartate receptor assembly. J Biol Chem. 2008;283:37–46. doi: 10.1074/jbc.M703539200. [DOI] [PubMed] [Google Scholar]
- Sheng M, Cummings J, Roldan LA, Jan YN, Jan LY. Changing subunit composition of heteromeric NMDA receptors during development in rat cortex. Nature. 1994;368:144–147. doi: 10.1038/368144a0. [DOI] [PubMed] [Google Scholar]
- Suárez F, Zhao Q, Monaghan DT, Jane DE, Jones S, Gibb AJ. Functional heterogeneity of NMDA receptors in rat substantia nigra pars compact and reticulata neurones. Eur J Neurosci. 2010;32:359–367. doi: 10.1111/j.1460-9568.2010.07298.x. [DOI] [PMC free article] [PubMed] [Google Scholar]
- Thomas CG, Miller AJ, Westbrook GL. Synaptic and extrasynaptic NMDA receptor NR2 subunits in cultured hippocampal neurons. J Neurophysiol. 2006;95:1727–1734. doi: 10.1152/jn.00771.2005. [DOI] [PubMed] [Google Scholar]
- Tovar KR, Westbrook GL. Amino-terminal ligands prolong NMDA receptor-mediated EPSCs. J Neurosci. 2012;32:8065–8073. doi: 10.1523/JNEUROSCI.0538-12.2012. [DOI] [PMC free article] [PubMed] [Google Scholar]
- Tovar KR, Sprouffske K, Westbrook GL. Fast NMDA receptor-mediated synaptic currents in neurons from mice lacking the e2 (NR2B) subunit. J Neurophysiol. 2000;83:616–620. doi: 10.1152/jn.2000.83.1.616. [DOI] [PubMed] [Google Scholar]
- Vicini S, Wang JF, Li JH, Zhu WJ, Wang YH, Luo JH, Wolfe BB, Grayson DR. Functional and pharmacological differences between recombinant N-methyl-d-aspartate receptors. J Neurophysiol. 1998;79:555–566. doi: 10.1152/jn.1998.79.2.555. [DOI] [PubMed] [Google Scholar]
- Villmann C, Becker CM. On the hypes and falls in neuroprotection: targeting the NMDA receptor. Neuroscientist. 2007;13:594–615. doi: 10.1177/1073858406296259. [DOI] [PubMed] [Google Scholar]
- Zhang L, Weiner JL, Carlen PL. Potentiation of gamma-aminobutyric acid type A receptor-mediated synaptic currents by pentobarbital and diazepam in immature hippocampal CA1 neurons. J Pharmacol Exp Ther. 1993;266:1227–1235. [PubMed] [Google Scholar]