

Abstract
Objective
Vitamin D deficiency is highly prevalent in high-risk patient populations, but the prevalence among otherwise healthy adults is less well-defined. The goal of this study was to determine the prevalence and predictors of low 25-hydroxyvitamin D [25(OH)D] levels in healthy younger adults.
Methods
This was a cross-sectional study of 634 healthy volunteers aged 18-50 years performed between January, 2006 and May, 2008. We measured serum 25(OH) D and parathyroid hormone and recorded demographic variables including age, sex, race, and use of multivitamin supplements.
Results
Thirty-nine percent of subjects had 25(OH)D ≤20 ng/mL and 64% had 25(OH)D ≤30 ng/mL. Predictors of lower 25(OH)D levels included male sex, black or Asian race, and lack of multivitamin use (P<0.001 for each predictors). Seasonal variation in 25(OH)D levels was present in the overall cohort but was not observed in multivitamin users. Lower 25(OH)D levels were associated with increased risk of elevated parathyroid hormone. Regression models predicted 25(OH)D levels ≤20 or ≤30 ng/mL with areas under the receiver operating characteristic curves of 0.76 and 0.80, respectively.
Conclusion
Low 25(OH)D levels are prevalent in healthy adults and may confer risk of skeletal disease. Black and Asian adults are at increased risk of deficiency and multivitamin use appears partially protective. Our models predicting low 25(OH)D levels may guide decision-making regarding whom to screen for vitamin D deficiency.
INTRODUCTION
Vitamin D is critical for bone health. Vitamin D deficiency causes impaired calcium absorption which can lead to rickets and osteomalacia (1–3). Additionally, vitamin D deficiency is associated with osteoporosis and an increased risk of fractures (4–6). Finally, accumulating observational evidence suggests that low vitamin D levels are associated with extraskeletal sequelae including increased risks of cancer, cardiovascular disease, infection, and autoimmune disease (4).
Serum 25-hydroxyvitamin D [25(OH)D] levels reflect body stores of vitamin D (4). A substantial fraction of the United States population has low 25(OH)D levels. For example, in a recent population-based National Health and Nutrition Examination Survey from 2001 to 2006, 32% of participants had serum 25(OH)D levels ≤20 ng/mL (7). Multiple populations are at particularly high risk for vitamin D deficiency, including children, the elderly, and people with increased skin pigmentation (8–10). Recommendations regarding whom to screen vary, though most experts suggest screening only populations at higher risk (11,12). The use of vitamin D-containing supplements is associated with increased 25(OH)D levels, thereby decreasing the likelihood of deficiency, however, recommendations regarding optimal supplement dose also vary widely (9,12–14).
We hypothesized that, in a population lacking significant risk factors, low vitamin D levels would, nonetheless, be highly prevalent. Because of the logistical and economic challenges associated with universal screening, we sought to identify demographic and behavioral factors predictive of low vitamin D levels that are easily assessed in a clinical setting.
SUBJECTS AND METHODS
Study Subjects
Healthy volunteers, aged 18 to 50 years, were recruited for endocrine research studies through mass mailings and advertisements in local newspapers and Internet sites (15,16). Visits occurred between January 2006 and May 2008. Subjects were excluded if they had significant cardiac, hepatic, oncologic, psychiatric disease, or disorders known to affect bone mineral metabolism including hyperthyroidism, hyperparathyroidism, osteomalacia, or Paget’s disease. Subjects using medications affecting either vitamin D or bone were also excluded. Multivitamin use and/or vitamin D supplementation up to 2,000 IU daily was allowed.
Measurements
All blood samples were drawn in the nonfasting state, and measurements were made immediately on fresh samples. Serum 25(OH)D levels were measured using a chemiluminescent immunoassay (LIAISON, DiaSorin, Stillwater, Minnesota) with a detection limit of 2 ng/mL and intra-assay and interassay coefficients of variation of 6% to 8% and 12% to 16%, respectively. Plasma parathyroid hormone (PTH) was measured in a subset of subjects (n = 334) using a two-site radioimmunoassay (RIA) (Nichols Institute Diagnostics, San Clemente, California) with a detection limit of 1 pg/mL and intra-assay and interassay coefficients of variation of 2% to 3% and 6%, respectively. A subset of subjects (n = 406) was assessed for multivitamin use; any use of a multivitamin was coded as “yes”. Study protocols were approved by the Human Research Committee of Partners HealthCare Systems (the responsible Institutional Review Board), and all subjects provided written informed consent.
Subjects were classified by sex, self-identified race (American Indian or Alaska Native, Asian, Black or African-American, Native Hawaiian or Other Pacific Islander, and White) and self-identified ethnicity (Hispanic or Latino or not Hispanic or Latino). The season of blood draw was classified as winter (January through March), spring (April through June), summer (July through September), or fall (October through December).
Statistical Analysis
Data are expressed as mean ± standard deviation unless otherwise specified. Unpaired t-test or analysis of variance (ANOVA) was used, as appropriate, to evaluate differences in 25(OH)D levels. Pair-wise comparisons were assessed only if the overall ANOVA was statistically significant; Bonferroni correction for multiple comparisons was used. Two-way ANOVA was used to test for the interaction of season with race and with multivitamin use. Either χ2 testing or Fisher exact test was used to compare proportions of subjects with low 25(OH)D levels. The Pearson correlation coefficient for PTH and 25(OH)D was determined. The subset of the cohort in which multivitamin use was assessed was used for regression modeling and was randomly divided into training (n = 305) and validation (n = 101) sets. Logistic regression modeling was used to determine if race, ethnicity, sex, multivitamin use, age, or season predicted the likelihood of a subject having a 25(OH)D level ≤20 (14) or ≤30 ng/mL. Only subjects with race defined as “white,” “black,” or “Asian” were included in the model. All variables with P<0.1 as well as additional variables considered clinically relevant were retained in the model. Goodness of fit was assessed with the Hosmer-Lemeshow test. Statistical analyses were performed using Stata 11 (College Station, Texas).
RESULTS
Subject Demographics
Six hundred sixty-four subjects were enrolled. Thirty subjects were excluded because race/ethnicity data were not recorded, leaving a final cohort of 634 subjects. The demographic makeup of the cohort is described in Table 1. Mean age was 29 ± 8 years (range, 18–48 years).
Table 1.
Demographic Characteristics of Study Subjects
| Characteristics | No. (%) |
|---|---|
| Total | 634 |
| Sex | |
| Male | 346 (55) |
| Female | 288 (45) |
| Race | |
| White | 435 (69) |
| Black | 103 (16) |
| Asian | 60 (9) |
| Othera | 36 (6) |
| Season | |
| Spring | 171 (27) |
| Summer | 165 (26) |
| Fall | 145 (23) |
| Winter | 153 (24) |
| Multivitamin use assessed | |
| Total | 406 |
| Multivitamin user | 122 (30) |
| Multivitamin nonuser | 284 (70) |
Includes American Indian (n = 2), multiple races (n = 25), and subjects who did not self-identify with any of the above categories (n = 9).
25(OH)D Levels
The mean 25(OH)D level for the cohort was 27 ± 14 ng/mL. Figure 1 shows the median and interquartile ranges of 25(OH)D levels for specified subgroups. 25(OH) D levels varied with sex, race, season, and multivitamin use. Females had significantly higher 25(OH)D levels compared with males (30 ± 15 versus 24 ± 12 ng/mL, P<0.001). White subjects had significantly higher 25(OH) D levels compared with black, Asian, and “other” race subjects (30 ± 14, 17 ± 10, 20 ± 11, and 22 ± 10 ng/mL respectively; P<0.001 for each pairwise comparison). After stratification by race, there were no significant differences between Hispanic and non-Hispanic subjects (Table 2). The 25(OH)D levels were higher in summer (31 ± 14 ng/mL) than in fall (27 ± 13 ng/mL), winter (25 ± 16 ng/mL), and spring (24 ± 12 ng/mL) (P = 0.03, P = 0.002, and P<0.001, respectively). Multivitamin users had higher 25(OH)D levels in comparison with nonusers (35 ± 15 versus 26 ± 14 ng/mL; P<0.001).
Fig. 1.

Box plot of 25-hydroxyvitamin D [25(OH)D] levels in different subgroups. The center band within each box indicates the median; the boundaries of the box indicate the 25th and 75th percentiles; whiskers represent minimum and maximum values less than 1.5 times the interquartile range; outliers are indicated by circles. A = Asian; B = black; F = female; M = male; MVI = multivitamin; O = other; Spr = spring; Sum = summer; W = white; Win = winter. *P<.05, †P<0.01, and ‡P<0.001. To convert 25(OH)D to nmol/L, multiply ng/mL by 2.496.
Table 2.
25-Hydroxyvitamin D Levels by Race and Ethnicity Subgroupsa
| Race/ethnicity | No. (%) | 25-hydroxy-vitamin D (ng/mL) | P valueb |
|---|---|---|---|
| Non-Hispanic White | 398 (63) | 31 ± 14 | 0.12 |
| Hispanic White | 37 (6) | 27 ± 12 | 0.12 |
| Non-Hispanic Black | 95 (15) | 17 ± 10 | 0.99 |
| Hispanic Black | 8 (1) | 17 ± 5 | 0.99 |
| Non-Hispanic Asian | 60 (9) | 20 ± 11 | NA |
| Non-Hispanic other | 13 (2) | 24 ± 12 | 0.30 |
| Hispanic other | 23 (4) | 20 ± 8 | 0.30 |
Abbreviation: NA = not available.
25-hydroxyvitamin D levels are expressed as mean ± standard deviation.
P values are for the comparison between Hispanic and Non-Hispanic subjects of each race.
To convert 25-hydroxyvitamin D to nmol/L, multiply ng/mL by 2.496.
Seasonal Variation, Race, and Multivitamin Use
Figure 2A shows the mean 25(OH)D levels by season after stratification by race. Seasonal variation of 25(OH)D levels was present in each racial group (P = 0.45 for the interaction of season and race by twoway ANOVA). This seasonal variation, however, was quantitatively less among black subjects when compared with white and Asian subjects. For example, the difference between spring and summer 25(OH)D levels was 8 ng/mL (95% confidence interval [CI]: 5–11 ng/mL) among white subjects, 11 ng/mL (95% CI: 6–17 ng/mL) among Asian subjects, and 2 ng/mL (95% CI: 5–9 ng/mL) among black subjects.
Fig. 2.

Mean 25-hydroxyvitamin D [25(OH)D] ± standard error of the mean (SEM) by season stratified by race (panel A) and by multivitamin (MVI) use (panel B). (†P = 0.01 and ‡P<0.001 for difference between the no multivitamin and multivitamin groups at the indicated season after Bonferroni correction for multiple comparisons). To convert 25(OH)D to nmol/L, multiply ng/mL by 2.496.
Figure 2B shows the mean 25(OH)D levels by season after stratification by multivitamin use. There was a significant effect of multivitamin use on seasonal variation (P = 0.01 for the interaction of season and multivitamin use by two-way ANOVA). Specifically, there was significant seasonal variation in 25(OH)D levels among subjects who did not use multivitamins (P = 0.001 by one-way ANOVA), but seasonal variation was not observed among multivitamin users. In pair-wise comparisons, multivitamin users had higher 25(OH)D levels in winter and spring in comparison with nonusers (P<0.001 and P = 0.01, respectively). Multivitamin users also had quantitatively higher 25(OH) D levels than nonusers in summer and fall, though these differences were not statistically significant.
Prevalence of Vitamin D Deficiency
Table 3 shows the prevalence of vitamin D deficiency defined by three different thresholds of 25(OH)D: ≤ 10, ≤20, and ≤30 ng/mL (12,17). Consistent with the mean 25(OH)D data, the prevalence of vitamin D deficiency among male subjects was higher than among female subjects at each threshold (P = 0.05, P<0.001, and P<0.001, respectively). Similarly, the prevalence of vitamin D deficiency differed by race and by season for each threshold (P<0.001 at all thresholds for the effect of race and for the effect of season). The prevalence of vitamin D deficiency was lower among multivitamin users when compared to nonusers at each threshold (P = 0.002, P<0.001, and P<0.001, respectively).
Table 3.
Prevalence of Hypovitaminosis D by Threshold and Characteristic (%)
| Characteristic | Percentage of prevalence of 25-hydroxyvitamin D level below threshold (ng/mL) | ||
|---|---|---|---|
|
| |||
| ≤10 | ≤20 | ≤30 | |
| Total | 7 | 39 | 64 |
| Sex | |||
| Male | 9 | 46 | 71 |
| Female | 5 | 31 | 56 |
| Race | |||
| White | 2 | 27 | 54 |
| Black | 25 | 70 | 88 |
| Asian | 15 | 63 | 83 |
| Other | 14 | 56 | 81 |
| Season | |||
| Spring | 6 | 46 | 73 |
| Summer | 3 | 27 | 50 |
| Fall | 6 | 39 | 65 |
| Winter | 14 | 45 | 69 |
| Multivitamin use assessed | 6 | 35 | 58 |
| Multivitamin user | 1 | 16 | 45 |
| Multivitamin nonuser | 8 | 42 | 64 |
To convert 25-hydroxyvitamin D to nmol/L, multiply ng/mL by 2.496.
25(OH)D and PTH
As shown in Figure 3A, lower 25(OH)D levels were associated with higher levels of PTH (r = −0.28; P<0.001). As shown in Figure 3B, when stratified by the 25(OH)D thresholds described above, mean PTH levels decreased from 48 ± 14 pg/mL for 25(OH)D ≤10 ng/mL to 36 ± 16 pg/mL for 25(OH)D >30 ng/mL (P for ANOVA <0.001). As shown in Figure 3C, the prevalence of hyperparathyroidism (PTH >60 pg/mL) decreased from 25% to 3% in the groups with the lowest to highest 25(OH)D levels, respectively (P for ANOVA = 0.009).
Fig. 3.
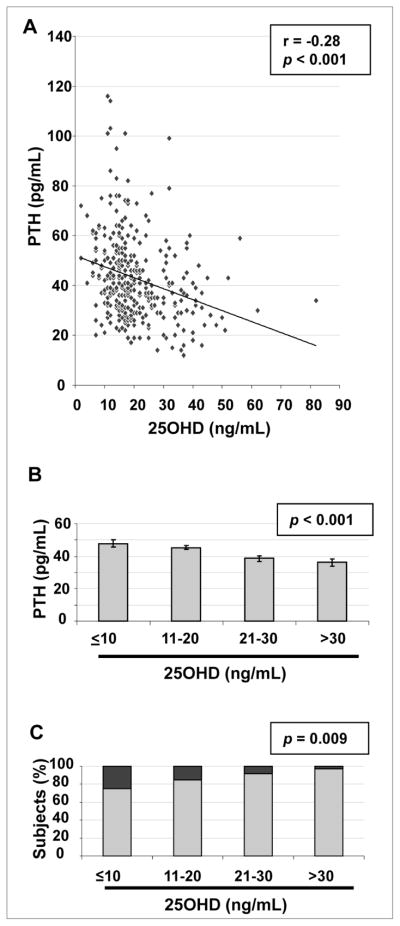
A, Scatterplot and regression line of 25-hydroxyvitamin D [25(OH)D] with parathyroid hormone (PTH). B, Mean PTH ± standard error of the mean (SEM) by 25(OH)D at the thresholds indicated. C, Percentage of subjects at each 25(OH)D threshold with PTH ≤60 pg/mL (light gray) and with PTH >60 pg/mL (dark gray).
Modeling
We developed a linear regression model for 25(OH)D levels using sex, age, self-identified race, self-identified ethnicity, season, and multivitamin use as potential predictors. After backwards step-wise selection, all variables except self-identified ethnicity (P = 0.22 in the initial model) were found to be independent clinical predictors. We randomly divided our sample into a training set (75% of the cohort) and a validation set (25% of the cohort), and performed logistic regression analysis using these variables in the training set to predict vitamin D deficiency at 2 thresholds: 25(OH)D ≤20 and ≤30 ng/mL (Table 4). Goodness-of-fit, assessed by the Hosmer-Lemeshow test, showed that the models fit the data well [P = 0.29 for the 25(OH)D ≤20 ng/mL model and P = 0.91 for the 25(OH)D ≤30 ng/mL model, indicating that the number of deficient subjects observed is not significantly different from that predicted]. Using our model, areas under the receiver operating characteristic (ROC) curves in the validation set were 0.76 and 0.80 for the 25(OH)D ≤20 ng/mL and 25(OH)D ≤30 ng/mL models, respectively, indicating good discrimination of 25(OH)D deficient versus sufficient subjects.
Table 4.
Logistic Regression Models for the Probability of Vitamin D Deficiency
| 25-Hydroxyvitamin D | ||||
|---|---|---|---|---|
|
| ||||
| ≤20 ng/mL | ≤30 ng/mL | |||
|
|
|
|||
| Coefficient | Odds ratio (95% confidence interval) | Coefficient | Odds ratio (95%confidence interval) | |
| Multivitamin use | ||||
| User | −1.63a | 0.20 (0.09–0.42)a | −0.78b | 0.46 (0.26–0.80)b |
| Nonuser | Referent | Referent | Referent | Referent |
| Race | ||||
| Black | 1.86a | 6.41 (3.16–13.01)a | 1.74a | 5.68 (2.49–12.97)a |
| Asian | 1.92a | 6.83 (2.94–15.85)a | 1.19b | 3.30 (1.37–7.92)b |
| White | Referent | Referent | Referent | Referent |
| Sex | ||||
| Female | −0.57d | 0.57 (0.31–1.05)d | −0.64c | 0.53 (0.30–0.94)c |
| Male | Referent | Referent | Referent | Referent |
| Age (y) | 0.01 | 1.01 (0.97–1.04) | 0.03c | 1.03 (1.00–1.06)d |
| Season | ||||
| Fall | −0.02 | 0.98 (0.47–2.04) | 0.59d | 1.80 (0.93–3.45)d |
| Winter | 0.25 | 1.29 (0.58–2.87) | 0.56d | 1.76 (0.88–3.52)d |
| Spring | 0.82d | 2.28 (0.96–5.38)d | 1.09b | 2.97 (1.31–6.72)b |
| Summer | Referent | Referent | Referent | Referent |
| Constant | −0.96c | NA | −0.66 | NA |
Abbreviation: NA = not available.
P<0.001.
P<0.01.
P<0.05.
P<0.1.
To convert 25-hydroxyvitamin D to nmol/L, multiply ng/mL by 2.496.
Table 5 shows the predicted probability of vitamin D deficiency (defined as 25(OH)D ≤20 ng/mL) in hypothetical 30-year-old patients of different race, sex, and multi-vitamin use status, if tested in the summer [highest predicted 25(OH)D level] or in the spring [lowest predicted 25(OH)D level]. In this model, the probability of vitamin D deficiency ranges from 5% (for a white female, taking a multivitamin, tested in the summer) to 87% (for a black or Asian male, not taking a multivitamin, tested in the spring).
Table 5.
Predicted Probabilities of Vitamin D Deficiency for Hypothetical 30-Year-Old Individuals of Varying Race, Sex, and Multivitamin Use Status if Tested in the Summer or Spring
| Race | Sex | Likelihood of 25-hydroxyvitamin D ≤20 ng/mL (%) | |||
|---|---|---|---|---|---|
|
| |||||
| Summer | Spring | ||||
|
|
|
||||
| Use of multivitamin | No multivitamin | Use of multivitamin | No multivitamin | ||
| Black | Male | 36 | 74 | 56 | 87 |
| Black | Female | 24 | 62 | 42 | 79 |
| Asian | Male | 38 | 75 | 58 | 87 |
| Asian | Female | 25 | 64 | 44 | 80 |
| White | Male | 8 | 31 | 17 | 51 |
| White | Female | 5 | 20 | 10 | 37 |
To convert 25(OH)D to nmol/L, multiply ng/mL by 2.496.
DISCUSSION
This study examined the rates of vitamin D deficiency in healthy younger adults in the Boston, Massachusetts area. Current recommendations suggest that only patients with a known risk factor should be screened for vitamin D deficiency, excluding a substantial portion of the population. Overall, we found high rates of vitamin D deficiency in this “lower-risk” cohort.
Many previous studies of vitamin D deficiency have been conducted in population-based samples (7,18) or in populations thought to be at unusually high risk (8,19,20). Fewer studies have examined rates of deficiency in healthy, nonelderly adults. In a previous study of patients admitted to a general medical service, we found that 40% of those 65 and younger, despite having no chronic medical problems, had 25(OH)D levels <15 ng/mL (21). In another study that sought to select a healthier cohort by excluding those with malabsorption, 30% of the subjects had 25(OH)D levels ≤20 ng/mL at the end of winter (22). Our study, in which 39% of subjects had 25(OH)D levels ≤20 ng/mL, extends these findings to an even healthier cohort.
The Institute of Medicine recently proposed that a 25(OH)D level ≤20 ng/mL be used to define vitamin D deficiency (14). Using this definition, vitamin D deficiency was highly prevalent in black subjects (70%), who are known to be a high-risk group (23,24), but also prevalent in white and Asian subjects (27% and 63%, respectively). These data are particularly concerning given the observed increase in PTH levels with decreasing 25(OH)D levels, suggesting that our otherwise healthy subjects were at risk for increased bone turnover, impaired bone mineralization, and bone loss (25). Interestingly, even at the lowest levels of 25(OH) D, only a minority of subjects had elevated levels of PTH. Conversely, 2 subjects with 25(OH)D levels ≥30 ng/mL, considered adequate by most experts, had elevated PTH levels. These data point to the likely critical role of dietary calcium intake in modulating the effect of low 25(OH)D levels on PTH levels, and thus on skeletal health (6).
25(OH)D levels >30 ng/mL have been proposed as “vitamin D sufficiency” by many authors (4,17,26). This classification is based on data regarding the 25(OH)D threshold required for optimal suppression of PTH (27–29), calcium absorption (30), and prevention of osteomalacia (31). Additionally, several nonskeletal health outcomes including decreased risk of autoimmunity, cardiovascular disease, and cancer, have been associated with 25(OH)D levels >30 ng/mL in observational studies (32). Randomized controlled trials are underway to further evaluate this association (33). Using this definition, 36% of our cohort would be classified as “vitamin D sufficient”, including only 12% of black and 17% of Asian subjects.
As in previous studies, we found higher 25(OH)D levels in white in comparison with black subjects (34). Seventy percent of our black subjects had 25(OH)D levels ≤20 ng/mL with 25% of the black subjects having 25(OH) D ≤10 ng/mL. Most previous studies (35), though not all (36), have reported that the increase in 25(OH)D level in response to ultraviolet B (UVB) exposure is blunted in people with increased skin pigmentation in comparison with people with less skin pigmentation. Our finding of an attenuated increase in 25(OH)D levels in black subjects during the summer months is consistent with prior reports and supports a primary role for skin pigmentation in mediating the observed differences among racial groups (37).
The Asian subjects in our study also had significantly lower 25(OH)D levels and higher rates of deficiency than white subjects. While high rates of vitamin D deficiency have been previously reported in Asia (38), few studies have examined 25(OH)D levels in Asian-Americans (39,40). These studies have been limited by small numbers and by restriction to high-risk groups such as children and older adults (8,39,40). Our data suggest that young adult Asian-Americans comprise a previously unrecognized group at high risk for vitamin D deficiency.
The observation that female subjects had higher 25(OH)D levels was surprising, as previous studies have found higher levels in male subjects (34). The 2001 to 2004 National Health and Nutrition Examination survey, unlike older surveys, however, showed no difference in 25(OH)D levels by sex (18). This altered pattern may be due to trends of decreased outdoor activity among males (18). Potential explanations for the higher 25(OH)D levels among females in our cohort include increased adherence to multivitamin use, particularly as the females in this study were of child-bearing age. There may also have been differences in outdoor activities, southern travel, or other sources of UVB exposure.
Importantly, our data suggest that even routine multivitamin use, that is, without adhering to a strict protocol, offers protection against the development of vitamin D deficiency. Because subjects were taking these supplements not as part of a study, daily adherence was likely variable, representing “typical” rather than “perfect” use. These subjects are thus similar in their multivitamin use to patients seen in an average clinical practice. When analyzed by season, multivitamin users did not have the post-summer decline in 25(OH)D levels seen in multivitamin nonusers. This finding suggests that increased oral intake of vitamin D compensated for decreased UVB exposure. It is possible, however, that the observed association of multivitamin use with 25(OH)D levels is mediated by unmeasured confounding factors, including higher dietary intake of vitamin D or higher UVB exposure among vitamin users.
Our logistic regression model provides a prediction of the likelihood of vitamin D deficiency using readily available clinical data. In this model, black and Asian race were the strongest predictors of risk of deficiency, followed by absence of multivitamin use. Spring season and male sex had significant but smaller effects. Overall, this model indicates that white individuals taking multivitamins are at relatively low risk of deficiency regardless of age, sex, or season (probability of deficiency ranging from 4% to 18%). All other groups, including those not traditionally thought to be at higher risk, however, were at risk of being vitamin D deficient (with probabilities ranging from 19% to 89%).
Models predictive of 25(OH)D levels have been developed by other investigators from large prospective cohort studies (41,42). Predictors found in those studies have included race, age, sex, region of residence, vitamin D intake, total energy intake, body mass index, physical activity, smoking status, and season (41,42). These models predicted 25(OH)D levels and the risk of deficiency similarly to our model. They differed from ours, however, in the homogeneous demographic makeup of the subjects who were, for the most part, older, male (41), or Caucasian (42). Additionally, subjects with potentially confounding medical conditions were not systematically excluded, thus, those subjects were not as “healthy” as our cohort. Finally, those models included predictors such as dietary vitamin D intake and physical activity score, which may be challenging to measure in a busy clinical setting.
Our study had some limitations. We did not collect information regarding dietary vitamin D intake, UVB exposure, or measures of adiposity. Regarding multi-vitamin use, we do not have data on vitamin D content or adherence, which may confound the effects of multivitamin use in different subgroups. Finally, our data are cross-sectional; thus, we do not have insight on longitudinal changes in 25(OH)D.
CONCLUSION
Our data demonstrate a high prevalence of vitamin D deficiency in otherwise healthy young adults in the Boston, Massachusetts area. The prevalence was particularly high among black subjects, who are known to be at higher risk, as well as among Asian subjects who are less well-described. Otherwise healthy white subjects also had significant rates of vitamin D deficiency. The predictions generated from this logistic regression model may serve as a guide to clinicians faced with the challenge of deciding whom to screen or empirically treat for vitamin D deficiency.
Acknowledgments
We wish to thank the staff of the Mallinckrodt General Clinical Research Center, Massachusetts General Hospital, Boston, Massachusetts, for their care of the subjects in these studies and Brian Healy, PhD, for statistical advice.
This work was supported by the following grants: National Institutes of Health grants K23DK073356 (to Dr. Sherri-Ann M. Burnett-Bowie), R01AG030545 (to Dr. Joel S. Finkelstein), K24DK02759 (to Dr. Joel S. Finkelstein), and M01RR01066 (to the Harvard Clinical and Translational Science Center, Boston, Massachusetts); an investigator-initiated grant from Solvay Pharmaceuticals, Inc., Brussels, Belgium (to Dr. Joel S. Finkelstein); a Massachusetts General Hospital Physician-Scientist Development Award, a Boston Area Diabetes and Endocrinology Research Center Grant, and a Claflin Distinguished Scholar Award (to Dr. Sherri-Ann M. Burnett-Bowie).
Abbreviations
- 25(OH)D
25-hydroxyvitamin D
- ANOVA
analysis of variance
- CI
confidence interval
- IU
International Units
- PTH
parathyroid hormone
- RIA
radioimmunoassay
- ROC
receiver operating characteristic
- UVB
ultraviolet B
Footnotes
DISCLOSURE The authors have no multiplicity of interest to disclose.
References
- 1.Kumar R. Vitamin D and calcium transport. Kidney Int. 1991;40:1177–1189. doi: 10.1038/ki.1991.332. [DOI] [PubMed] [Google Scholar]
- 2.Holick MF. Resurrection of vitamin D deficiency and rickets. J Clin Invest. 2006;116:2062–2072. doi: 10.1172/JCI29449. [DOI] [PMC free article] [PubMed] [Google Scholar]
- 3.Bhan A, Rao AD, Rao DS. Osteomalacia as a result of vitamin D deficiency. Endocrinol Metab Clin North Am. 2010;39:321–331. doi: 10.1016/j.ecl.2010.02.001. [DOI] [PubMed] [Google Scholar]
- 4.Holick MF. Vitamin D deficiency. N Engl J Med. 2007;357:266–281. doi: 10.1056/NEJMra070553. [DOI] [PubMed] [Google Scholar]
- 5.Dawson-Hughes B, Harris SS, Krall EA, Dallal GE. Effect of calcium and vitamin D supplementation on bone density in men and women 65 years of age or older. N Engl J Med. 1997;337:670–676. doi: 10.1056/NEJM199709043371003. [DOI] [PubMed] [Google Scholar]
- 6.Bell TD, Demay MB, Burnett-Bowie SM. The biology and pathology of vitamin D control in bone. J Cell Biochem. 2010;111:7–13. doi: 10.1002/jcb.22661. [DOI] [PMC free article] [PubMed] [Google Scholar]
- 7.Looker AC, Johnson CL, Lacher DA, Pfeiffer CM, Schleicher RL, Sempos CT. Vitamin D status: United States, 2001–2006. NCHS Data Brief. 2011;(59):1–8. [PubMed] [Google Scholar]
- 8.Gordon CM, DePeter KC, Feldman HA, Grace E, Emans SJ. Prevalence of vitamin D deficiency among healthy adolescents. Arch Pediatr Adolesc Med. 2004;158:531–537. doi: 10.1001/archpedi.158.6.531. [DOI] [PubMed] [Google Scholar]
- 9.Nesby-O’Dell S, Scanlon KS, Cogswell ME, et al. Hypovitaminosis D prevalence and determinants among African American and white women of reproductive age: third National Health and Nutrition Examination Survey, 1988–1994. Am J Clin Nutr. 2002;76:187–192. doi: 10.1093/ajcn/76.1.187. [DOI] [PubMed] [Google Scholar]
- 10.Yetley EA. Assessing the vitamin D status of the US population. Am J Clin Nutr. 2008;88:558S–564S. doi: 10.1093/ajcn/88.2.558S. [DOI] [PubMed] [Google Scholar]
- 11.Kennel KA, Drake MT, Hurley DL. Vitamin D deficiency in adults: when to test and how to treat. Mayo Clin Proc. 2010;85:752–757. doi: 10.4065/mcp.2010.0138. [DOI] [PMC free article] [PubMed] [Google Scholar]
- 12.Holick MF, Binkley NC, Bischoff-Ferrari HA, et al. Evaluation, treatment, and prevention of vitamin D deficiency: an Endocrine Society clinical practice guideline. J Clin Endocrinol Metab. 2011;96:1911–1930. doi: 10.1210/jc.2011-0385. [DOI] [PubMed] [Google Scholar]
- 13.Bischoff-Ferrari HA, Shao A, Dawson-Hughes B, Hathcock J, Giovanucci E, Willett WC. Benefit-risk assessment of vitamin D supplementation. Osteoporos Int. 2010;21:1121–1132. doi: 10.1007/s00198-009-1119-3. [DOI] [PMC free article] [PubMed] [Google Scholar]
- 14.Institute of Medicine of the National Academies. Dietary Reference Intakes for Calcium and Vitamin D. Washington, DC: The National Academies Press; Mar, 2011. [Accessed for verification July 16, 2012]. http://www.iom.edu/~/media/Files/Report%20Files/2010/Dietary-Reference-Intakes-for-Calcium-and-Vitamin-D/Vitamin%20D%20and%20Calcium%20201%20Report%20Brief.pdf. [Google Scholar]
- 15.Finkelstein JS, Burnett-Bowie SM, Leder BZ, et al. Hypogonadism with Estrogen Removal (HER): effects of androgens and estrogens on body composition in young adult men [abstract] Endocr Rev. 2011;32 [Google Scholar]
- 16.Burnett-Bowie SM, Leder BZ, Henao MP, Baldwin CM, Hayden DL, Finkelstein JS. Randomized trial assessing the effects of ergocalciferol administration on circulating FGF23. Clin J Am Soc Nephrol. 2012;7:624–631. doi: 10.2215/CJN.10030911. [DOI] [PMC free article] [PubMed] [Google Scholar]
- 17.Adams JS, Hewison M. Update in vitamin D. J Clin Endocrinol Metab. 2010;95:471–478. doi: 10.1210/jc.2009-1773. [DOI] [PMC free article] [PubMed] [Google Scholar]
- 18.Ginde AA, Liu MC, Camargo CA., Jr Demographic differences and trends of vitamin D insufficiency in the US population, 1988–2004. Arch Intern Med. 2009;169:626–632. doi: 10.1001/archinternmed.2008.604. [DOI] [PMC free article] [PubMed] [Google Scholar]
- 19.Wortsman J, Matsuoka LY, Chen TC, Lu Z, Holick MF. Decreased bioavailability of vitamin D in obesity. Am J Clin Nutr. 2000;72:690–693. doi: 10.1093/ajcn/72.3.690. [DOI] [PubMed] [Google Scholar]
- 20.Pappa HM, Gordon CM, Saslowsky TM, et al. Vitamin D status in children and young adults with inflammatory bowel disease. Pediatrics. 2006;118:1950–1961. doi: 10.1542/peds.2006-0841. [DOI] [PMC free article] [PubMed] [Google Scholar]
- 21.Thomas MK, Lloyd-Jones DM, Thadhani RI, et al. Hypovitaminosis D in medical inpatients. N Engl J Med. 1998;338:777–783. doi: 10.1056/NEJM199803193381201. [DOI] [PubMed] [Google Scholar]
- 22.Tangpricha V, Pearce EN, Chen TC, Holick MF. Vitamin D insufficiency among free-living healthy adults. Am J Med. 2002;112:659–662. doi: 10.1016/s0002-9343(02)01091-4. [DOI] [PMC free article] [PubMed] [Google Scholar]
- 23.Harris SS. Vitamin D and African Americans. J Nutr. 2006;136:1126–1129. doi: 10.1093/jn/136.4.1126. [DOI] [PubMed] [Google Scholar]
- 24.Cosman F, Nieves J, Dempster D, Linsay R. Vitamin D economy in blacks. J Bone Miner Res. 2007;22(suppl 2):V34–V38. doi: 10.1359/jbmr.07s220. [DOI] [PubMed] [Google Scholar]
- 25.Chapuy MC, Schott AM, Garnero P, Hans D, Delmas PD, Meunier PJ. Healthy elderly French women living at home have secondary hyperparathyroidism and high bone turnover in winter. J Clin Endocrinol Metab. 1996;81:1129–1133. doi: 10.1210/jcem.81.3.8772587. [DOI] [PubMed] [Google Scholar]
- 26.Giovannucci E. Expanding roles of vitamin D. J Clin Endocrinol Metab. 2009;94:418–420. doi: 10.1210/jc.2008-2695. [DOI] [PubMed] [Google Scholar]
- 27.Chapuy MC, Preziosi P, Maamer M, et al. Prevalence of vitamin D insufficiency in an adult normal population. Osteoporos Int. 1997;7:439–443. doi: 10.1007/s001980050030. [DOI] [PubMed] [Google Scholar]
- 28.Holick MF, Siris ES, Binkley N, et al. Prevalence of vitamin D inadequacy among postmenopausal North American women receiving osteoporosis therapy. J Clin Endocrinol Metab. 2005;90:3215–3224. doi: 10.1210/jc.2004-2364. [DOI] [PubMed] [Google Scholar]
- 29.Durazo-Arvizu RA, Dawson-Hughes B, Sempos CT, et al. Three-phase model harmonizes estimates of the maximal suppression of parathyroid hormone by 25-hydroxyvitamin D in persons 65 years of age and older. J Nutr. 2010;140:595–599. doi: 10.3945/jn.109.116681. [DOI] [PMC free article] [PubMed] [Google Scholar]
- 30.Heaney RP, Dowell MS, Hale CA, Bendich A. Calcium absorption varies within the reference range for serum 25-hydroxyvitamin D. J Am Coll Nutr. 2003;22:142–146. doi: 10.1080/07315724.2003.10719287. [DOI] [PubMed] [Google Scholar]
- 31.Priemel M, von Domarus C, Klatte TO, et al. Bone mineralization defects and vitamin D deficiency: histomorphometric analysis of iliac crest bone biopsies and circulating 25-hydroxyvitamin D in 675 patients. J Bone Miner Res. 2010;25:305–312. doi: 10.1359/jbmr.090728. [DOI] [PubMed] [Google Scholar]
- 32.Bischoff-Ferrari HA, Giovannucci E, Willett WC, Dietrich T, Dawson-Hughes B. Estimation of optimal serum concentrations of 25-hydroxyvitamin D for multiple health outcomes. Am J Clin Nutr. 2006;84:18–28. doi: 10.1093/ajcn/84.1.18. [DOI] [PubMed] [Google Scholar]
- 33.Manson JE, Bassuk SS, Lee IM, et al. The VITamin D and OmegA-3 TriaL (VITAL): rationale and design of a large randomized controlled trial of vitamin D and marine omega-3 fatty acid supplements for the primary prevention of cancer and cardiovascular disease. Contemp Clin Trials. 2012;33:159–171. doi: 10.1016/j.cct.2011.09.009. [DOI] [PMC free article] [PubMed] [Google Scholar]
- 34.Looker AC, Dawson-Hughes B, Calvo MS, Gunter EW, Sayhoun NR. Serum 25-hydroxyvitamin D status of adolescents and adults in two seasonal subpopulations from NHANES III. Bone. 2002;30:771–777. doi: 10.1016/s8756-3282(02)00692-0. [DOI] [PubMed] [Google Scholar]
- 35.Armas LA, Dowell S, Akhter M, et al. Ultraviolet-B radiation increases serum 25-hydroxyvitamin D levels: the effect of UVB dose and skin color. J Am Acad Dermatol. 2007;57:588–593. doi: 10.1016/j.jaad.2007.03.004. [DOI] [PubMed] [Google Scholar]
- 36.Bogh MK, Schmedes AV, Philipsen PA, Thieden E, Wulf HC. Vitamin D production after UVB exposure depends on baseline vitamin D and total cholesterol but not on skin pigmentation [correction appears in J Invest Dermatol. 2010;130:1751] J Invest Dermatol. 2010;130:546–553. doi: 10.1038/jid.2009.323. [DOI] [PubMed] [Google Scholar]
- 37.Harris SS, Dawson-Hughes B. Seasonal changes in plasma 25-hydroxyvitamin D concentrations of young American black and white women. Am J Clin Nutr. 1998;67:1232–1236. doi: 10.1093/ajcn/67.6.1232. [DOI] [PubMed] [Google Scholar]
- 38.Fraser DR. Vitamin D-deficiency in Asia. J Steroid Biochem Mol Biol. 2004;89–90:491–495. doi: 10.1016/j.jsbmb.2004.03.057. [DOI] [PubMed] [Google Scholar]
- 39.Harris SS, Soteriades E, Coolidge JA, Mudgal S, Dawson-Hughes B. Vitamin D insufficiency and hyper-parathyroidism in a low income, multiracial, elderly population. J Clin Endocrinol Metab. 2000;85:4125–4130. doi: 10.1210/jcem.85.11.6962. [DOI] [PubMed] [Google Scholar]
- 40.Cauley JA, Danielson ME, Boudreau R, et al. Serum 25-hydroxyvitamin D and clinical fracture risk in a multiethnic cohort of women: the Women’s Health Initiative (WHI) J Bone Miner Res. 2011;26:2378–2388. doi: 10.1002/jbmr.449. [DOI] [PMC free article] [PubMed] [Google Scholar]
- 41.Giovannucci E, Liu Y, Rimm EB, et al. Prospective study of predictors of vitamin D status and cancer incidence and mortality in men. J Natl Cancer Inst. 2006;98:451–459. doi: 10.1093/jnci/djj101. [DOI] [PubMed] [Google Scholar]
- 42.Liu E, Meigs JB, Pittas AG, et al. Predicted 25-hydroxyvitamin D score and incident type 2 diabetes in the Framingham Offspring Study. Am J Clin Nutr. 2010;91:1627–1633. doi: 10.3945/ajcn.2009.28441. [DOI] [PMC free article] [PubMed] [Google Scholar]