

Abstract
Prenatal alcohol exposure (PAE) is associated with various adverse effects on human brain and behavior. Recently, neuroimaging studies have begun to identify PAE effects on specific brain structures. Investigation of such specific PAE effects is important for understanding the teratogenic mechanism of PAE on human brain, which is critical for differentiating PAE from other disorders. In this structural MRI study with young adults, PAE effects on the volumes of automatically segmented cortical and subcortical regions of interest (ROIs) were evaluated both through a group difference approach and a parametric approach. In the group difference approach (comparing among two PAE and a control groups), a disproportionate PAE effect was found in several occipital and temporal regions. This result is inconsistent with previous studies with child samples. Moreover, a gender difference in PAE effect was shown in some cortical ROIs. These findings suggest that sampling and gender may be important factors for interpreting specific PAE effects on human brain. With the parametric approach, it was demonstrated that the higher the PAE level, the smaller the entire brain, the lower the IQ. Several cortical and subcortical ROIs also exhibited a negative correlation between the PAE level and ROI volume. Furthermore, our data showed that the PAE effect on the brain could not be interpreted by the PAE effect on general physical growth until the young adult age. This study provides valuable insight into specific effects of PAE on human brain and suggests important implications for future studies in this field. Hum Brain Mapp, 2011. © 2011 Wiley‐Liss, Inc.
Keywords: prenatal alcohol exposure, structural MRI, brain segmentation, volume
INTRODUCTION
Alcohol is a neurotoxin and a teratogen [Guerri, 1998; Spampinato et al., 2005]. As a result, it is generally believed that prenatal alcohol exposure (PAE) may impair or delay the development of brain structures and functions [Niccols, 2007], an assumption that is supported by neuropsychological, postmortem, and neuroimaging studies. When behavioral functions are observed, adverse effects of PAE are pervasive and include deficits in attention, executive control, learning, memory, language, visuospatial/visuomotor functions, and motor skills [Riley and McGee, 2005]. Because these cognitive functions are underpinned by widespread networks of brain structures, the results from neuropsychological studies suggest that alcohol may exert teratogenic effects globally on the human brain. Consistent with this view, results of autopsy investigations on the most severe cases of PAE show that brain malformations are widespread and variable, suggesting that there may be no specific pattern of deficits [Clarren, 1986] in these severe cases. In contrast, recent neuroimaging studies using MRI (magnetic resonance imaging) on living human subjects prenatally exposed to alcohol have reported that some brain structures, specifically the caudate nucleus [Archibald et al., 2001; Astley et al., 2009], the parietal region [Archibald et al., 2001; Sowell et al., 2002], the frontal lobe [Astley et al., 2009], the temporal–parietal conjunction [Sowell et al., 2001b], and the left orbitofrontal areas [Sowell et al., 2002], were more influenced by PAE than other areas. In addition, abnormality of corpus callosum is one of the most consistently reported brain structural outcomes associated with PAE [Bookstein et al., 2001, 2002a, b; Lebel et al., 2008; Li et al. 2009; Ma et al., 2005; Riley et al., 1995; Sowell et al., 2001a, 2008; Wozniak et al., 2006, 2009]. These results suggest that there may be specific patterns of PAE‐related effects in addition to an overall change in brain size [Spadoni et al., 2007].
Although the postmortem and neuropsychological data converge on the same inference that the developing brain may be widely affected by alcohol, understanding of specific patterns of PAE effect on brain structures in living individuals is still limited and somewhat speculative. For example, reduced whole brain size in PAE samples has been reported in many previous studies. However, a question that arises in interpretation of these reports concerns whether this effect is due to a widespread volume reduction in most brain structures, or whether it is specific to only a few regions, an issue that has not been examined in detail as yet. To investigate this issue, brains of studied samples should be segmented into different cortical and subcortical regions of interest (ROIs) although it is difficult to efficiently perform this segmentation manually. This was the approach used by Archibald et al. [2001] in a previous study, in which the cerebrum was manually divided into the frontal, parietal, occipital and temporal lobes. Studies with more detailed segmentation of cerebrum have not yet been done. Therefore, in this study, 68 cortical ROIs (34 for each hemisphere), and 20 subcortical ROIs (including the corpus callosum which was divided into five portions) were defined through an automated segmentation method. Thus, more detailed information could be obtained to resolve the issues discussed above.
Investigation of specific PAE effects on the brain structures is important for understanding the teratogenic mechanism of PAE on human brain and, therefore, on human behavior, which is key for discriminating the deficits of PAE from those of other disorders. Although the previous MRI studies mentioned above have focused on specific patterns of PAE effect on brain structures, their findings still have some limitations. Most of these studies were completed by using clinically identified PAE samples that included a broad age range (school‐aged children, adolescents, and young adults). Unfortunately, due to the sampling methods used, detailed information about prenatal exposure to alcohol and other drugs often was not available. Thus, the samples used could be unique and further research is necessary to determine whether these findings are specific to or independent of these samples. In this study, the availability of a longitudinal cohort allowed the recruitment of relatively large sample of PAE participants who have been followed since the prenatal period [Coles et al., 1985, 1991, 1997, 2002] and whose prenatal alcohol exposure is well documented. In addition, these participants were young adults within a narrow age span, suggesting that their brains were at a relatively consistent and stable stage of development. It should be valuable to compare the data collected with such a sample to those reported in previous studies using clinical samples. Consistency among different studies would suggest that findings can be generalized.
There are three aims in this study. First, it was our intention to determine, using a group difference approach, whether or not PAE effects on the brain structures are affected by sampling and gender factors. PAE effects are usually demonstrated as the differences between PAE and unexposed control groups. With this group difference approach, disproportionate PAE effects on specific brain regions have been reported [Archibald et al., 2001; Astley et al., 2009]. Such effects also were investigated in this study so that, by comparison with the previous studies, the issue of whether these disproportionate PAE effects are sample‐specific or not could be evaluated. Because this study examined more detailed ROIs on the cerebral cortex than the previous studies, it is predicted that more specific patterns of PAE effect could be found in these cortical ROIs.
In addition, gender differences in PAE effect have not been investigated in human samples. In animal models, different PAE effects on brain structures, hormonal activities and behaviors have been shown between males and females [Hofmann et al., 2005; Lee and Rivier, 1996; Osborn et al., 1998, 1996; Weinberg, 1988; Weinberg and Jerrells, 1991; Zimmerberg and Mickus, 1990; Zimmerberg and Scalzi, 1989], also see reviews [Hellemans et al., 2010; Weinberg et al., 2008]. In this study, the relatively large sample size allowed the investigation of possible gender differences in PAE effects on human brain structures.
Second, because we had quantitative information available about the amount of PAE, a specific PAE effect on the brain structures could be examined through a parametric approach. In this approach, the quantitative relationship between the PAE level and brain volume was evaluated. First, this parametric approach was validated by correlating the PAE level with whole brain volume and cognitive ability (IQ). As PAE is supposed to exert adverse effects on the human brain, a negative correlation between the PAE level and brain volume is required. The causal link between PAE, alteration in whole brain volume and alteration in IQ was also evaluated through a mediation analysis [Preacher and Hayes, 2008]. Then, a significant negative correlation between the PAE level and brain volume was used as the criterion to identify the brain structures specifically affected by PAE.
Negative correlation between level of PAE and volumes of brain regions has been reported in a previous study, in which only a few brain ROIs (hippocampus, caudate, putamen, frontal lobe, gray matter and white matter of the frontal lobe, and total brain volume) were examined and the data of PAE level were obtained in a retrospective way [Astley et al., 2009]. In this study, more detailed ROIs were evaluated and the amount of PAE (maternal report of alcohol consumed) collected during pregnancy were used with this parametric approach. Thus, more valuable information would be obtained.
Third, we had collected physical growth data for the participants at birth and when imaged as young adults in this study. With these data, PAE effect on general physical growth could be examined and compared with the PAE effect on the brain. If the effect of PAE on brain development is not attributable to the effect of PAE on general physical growth until the young adult age, it can be inferred that PAE may exert a specific influence on the brain. Examining this hypothesis will further improve our understanding of specific PAE effects on the human brain.
MATERIALS AND METHODS
Participants
The sample was drawn from a longitudinal cohort recruited prenatally from a large urban hospital serving a predominantly low socioeconomic status, African–American population. Recruitment took place between 1980 and 1986. Mothers were interviewed prenatally using a measure of quantity/frequency of alcohol use during pregnancy. Those who reported consuming at least one ounce of absolute alcohol per week (one ounce of AAPW; equivalent to two drinks) and those who reported consuming no alcohol while pregnant were invited to participate in the initial study. Amount of alcohol consumed by those who met criteria for inclusion as drinkers ranged from 1 to 75 (mean: 10.3, SD: 11.88) ounces of AAPW, that is, more than 20 drinks a week. The mothers who drank during pregnancy were advised that it could have negative health consequences for the baby and that they should stop. Those who agreed were provided with referrals to treatment programs. The infants were evaluated after birth and followed periodically into early adulthood. At follow‐up evaluations, the participants were assessed for physical features and characteristics associated with PAE with the Dysmorphia checklist [Coles et al., 1985]. Based on the mother's report of prenatal alcohol use and the dysmorphia ratings completed at birth, age 7, and at midadolescence, three groups of participants were included in this study: (1) dysmorphic (14 males and 16 females), participants whose mothers reported prenatal alcohol use and who had a dysmorphia score at least one standard deviation above the sample mean in at least one of the three evaluations; (2) exposed, nondysmorphic (10 males and 27 females), participants whose mothers reported prenatal alcohol use and who had no dysmorphia scores one standard deviation above the mean; and (3) control (12 males and 15 females), participants whose mothers denied alcohol use during pregnancy and who were well‐matched with the exposed groups to avoid potentially confounding effects of race/ethnicity, socioeconomic status, clinical status, age, education level, and resident community.
The demographic, socioeconomic, current substance use, and prenatal drug exposure data of all three groups are shown in Table I. Based on the selection criteria, the three participant groups were differentiated by dysmorphia ratings, full‐scale IQ scores and level of PAE (Table I).
Table I.
Demographic, current substance use, and prenatal exposure characteristics of participants
| Variable | Group | Statistics | P | ||
|---|---|---|---|---|---|
| Ctrla (n = 27) | NDysa (n = 37) | Dysa (n = 30) | |||
| Gender, % male | 44.4 | 27.0 | 46.7 | χ2 2 = 3.310 | n.s. |
| Ethnicity, % African–American | 100.0 | 97.3 | 100.0 | χ2 2 = 1.557 | n.s. |
| Age at imaging (years), mean (SD) | F 2,88 = 1.372b | n.s. | |||
| Male | 22.0 (1.3) | 23.9 (1.4) | 22.8 (1.9) | ||
| Female | 23.0 (2.1) | 22.7 (1.6) | 23.3 (2.5) | ||
| Education completed (years), mean (SD) | F 2,87 = 0.923b | n.s. | |||
| Male | 12.4 (1.6)c | 12.5 (1.2) | 11.9 (1.3) | ||
| Female | 12.2 (1.6) | 11.3 (1.6) | 11.7 (1.4) | ||
| Dysmorphia rating, mean (SD) | F 2,87 = 10.14b | <0.001 | |||
| Male | 4.2 (3.4) | 3.6 (3.8) | 8.5 (8.6) | ||
| Female | 2.9 (3.3) | 5.1 (3.7)c | 10.3 (7.2) | ||
| Adult full‐scale IQ, mean (SD) | F 2,87 = 4.760b | 0.011 | |||
| Male | 86.2 (7.5) | 89.0 (11.6) | 76.9 (14.0) | ||
| Female | 81.9 (9.0)c | 77.1 (10.6) | 75.3 (10.5) | ||
| Adult—AAPW, mean (SD)d | F 2,87 = 2.229b | n.s. | |||
| Male | 1.3 (2.4) | 2.6 (2.5) | 1.1 (1.2) | ||
| Female | 0.5 (1.6)c | 0.8 (1.4) | 0.7 (1.6) | ||
| PAE—AAPW, mean (SD)d | F 2,88 = 9.957b | <0.001 | |||
| Male | 0.0 (0.0) | 4.1 (3.2) | 12.0 (12.6) | ||
| Female | 0.0 (0.0) | 8.9 (14.9) | 14.8 (14.8) | ||
| Cocaine during pregnancy, % using | 0.0 | 13.5 | 7.7 (n = 26) | χ2 2 = 3.974 | n.s. |
| Marijuana during pregnancy, % using | 18.5 | 35.1 | 30.0 | χ2 2 = 2.140 | n.s. |
| Cigarette during pregnancy, % using | 33.3 | 66.7 (n = 36) | 83.3 | χ2 2 = 15.599 | <0.001 |
Ctrl: control group, NDys: nondysmorphic group, Dys: dysmorphic group.
Two‐way group × gender analyses of variance were completed for the variables. The effects of group are reported in table. The effect of gender was significant for the adult full‐scale IQ and the adult alcohol use (adult AAPW). No group × gender interaction effects were significant.
Data are not available for one participant.
AAPW: absolute alcohol per week (ounces), PAE: prenatal alcohol exposure.
Procedure
Individuals who were eligible for the study were identified from the cohort database and were contacted by mail or phone. The nature of this research study was explained to them and their participation was requested. Those who agreed completed an informed consent procedure approved by the University's Institutional Review Committee. During this procedure, the information obtained previously from the participants' mothers regarding their alcohol use was kept confidential. The experiments were undertaken with the understanding and written consent of each participant, with the approval of the appropriate local ethics committee and in compliance with national legislation and the Code of Ethical Principles for Medical Research Involving Human Subjects of the World Medical Association (Declaration of Helsinki). Participants were transported by study staff to the research laboratory for an evaluation and to the University hospital where neuroimaging was carried out. Usually, these activities took place on separate days. On the first day, participants completed the consent procedures and the ability (IQ) testing with the Wechsler Abbreviated Scale of Intelligence (WASI) [Wechsler, 1999] and were screened to assure that they could be imaged. Conditions screened for included pregnancy, presence of metal in the body, obesity that would prevent imaging, handedness, and fear of being inside the magnet. On the second day, participants completed the imaging protocol. Participants received compensation for their time.
MRI Data Acquisition and Analysis
For each participant, high‐resolution T1‐weighted images were collected on a 3.0 T Siemens Magnetom TRIO scanner (Siemens Medical Solutions, Malvern, PA) with an MPRAGE sequence (TR = 2,600 ms, TE = 3.02 ms, TI = 900 ms, flip angle = 8, voxel size = 1 × 1 × 1 mm3). With these images, FreeSurfer (http://surfer.nmr.mgh.harvard.edu/fswiki, version 4.5.0) was used to segment subcortical structures, gray and white matter, and cortical regions automatically [Dale et al., 1999; Desikan et al., 2006; Fischl et al., 1999, 2002, 2004] through FreeSurfer's troubleshooting reconstruction work flow (see details on: https://surfer.nmr.mgh.harvard.edu/fswiki/RecommendedReconstruction). During this procedure, the segmentation was checked slice by slice for each participant, and manual edits were carried out to remove part of the dura which was incorrectly segmented as gray matter. After the reconstruction was finished, volumetric data for the segmented cortical and subcortical ROIs (see Fig. 1) were also automatically calculated by FreeSurfer.
Figure 1.
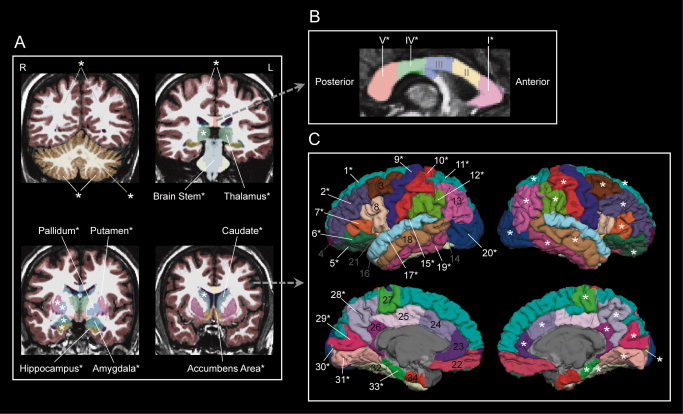
Cortical and subcortical ROIs examined in this study. * : ROI exhibiting significant (P < 0.05) group effect in the ANOVA analysis (see details in “Methods” section). A: Gross volumes (the left and right cerebral cortex and white matter, the left and right cerebellar cortex and white matter) and subcortical ROIs. R: right hemisphere, L: left hemisphere. B: Five portions of corpus callosum. I: anterior, II: midanterior, III: central, IV: midposterior, V: posterior. C: Thirty‐four ROIs on the cerebral cortex. 1: superior frontal gyrus, 2: rostral middle frontal gyrus, 3: caudal middle frontal gyrus, 4: frontal pole, 5: lateral orbital frontal cortex, 6: pars orbitalis, 7: pars triangularis, 8: pars opercularis, 9: precentral gyrus, 10: postcentral gyrus, 11: superior parietal lobule, 12: supramarginal gyrus, 13: inferior parietal lobule, 14: banks of superior temporal sulcus, 15: transverse temporal gyrus, 16: temporal pole, 17: superior temporal gyrus, 18: middle temporal gyrus, 19: inferior temporal gyrus, 20: lateral occipital cortex, 21: insula, 22: middle orbital frontal cortex, 23: rostral anterior cingulate cortex, 24: caudal anterior cingulate cortex, 25: posterior cingulate cortex, 26: isthmus of cingulate cortex, 27: paracentral lobule, 28: precuneus cortex, 29: cuneus cortex, 30: pericalcarine cortex, 31: lingual gyrus, 32: fusiform gyrus, 33: parahippocampal gyrus, and 34: entorhinal cortex.
Statistical Analysis
SPSS 18 (http://www.spss.com) was used in statistical analysis. First, the volumetric data for individual cortical and subcortical ROIs were analyzed with multivariate analysis of variance (MANOVA). Two between‐subject factors were included in the MANOVA: group (three levels: control, nondysmorphic, and dysmorphic) and gender (two levels: male and female). For regions showing the group main effect, pair‐wise comparisons among the three participant groups were performed with the least significant difference (LSD) method. Because the sample sizes for the males and the females were not equal, the estimated marginal means for the group factor were used in this post hoc analysis. Also, volumes of the regions showing the group effect were normalized by the whole brain volume (excluding the ventricles) for each participant, and the normalized volumes were analyzed with the same MANOVA and post hoc analysis.
The group × gender interaction in the above MANOVA on the original volume data was also examined. For regions showing the group × gender interaction, further one‐way ANOVA of the group factor on the original volume data was performed for the male and the female participants respectively.
A partial correlation analysis also was performed between the whole brain volume (excluding the ventricles) and the IQ score while controlling the gender factor for the three participant groups respectively. Because similar results were observed for the two PAE groups, they were combined to obtain higher statistical power. The same correlation analysis was performed between the whole brain volume and the IQ score, as well as between the PAE level and the whole brain volume for all the PAE participants. Quantitative relationships between these factors were further estimated with linear regression (controlling the gender factor). Moreover, the causal link between the PAE level, whole brain volume and IQ (an indirect effect: PAE affects IQ by altering the whole brain volume) was assessed with mediation analysis, in which a bootstrapping method was used [Preacher and Hayes, 2008] and the gender factor was also controlled. As the AAPW data were exponentially distributed, log10(AAPW) data were used in these analysis. Finally, the partial correlation analysis (controlling the gender factor) was applied between the PAE level and volume data for all the cortical and subcortical ROIs.
The physical growth data of participants were analyzed with ANOVA (two‐way group × gender). Since the three participant groups were different in gestational age, it was set as a covariate in the ANOVA. Moreover, each growth factor also was set as another covariate in the ANOVA of the whole brain volume (two‐way group × gender, gestational age as a covariate), respectively, to examine which factors could be important for interpreting the group difference in the whole brain volume. In addition, a partial correlation analysis was carried out between the physical growth data and the PAE level (gender as a control factor). Then, the gestational age was set as another control factor in this partial correlation analysis. If there were growth factors still showing significant relationship with the PAE level, each of these factors would be set as the third control factor in the partial correlation analysis respectively to evaluate which factors were important for interpreting the correlation between the whole brain volume and the PAE level.
RESULTS
Disproportionate PAE Effect
Cortical and subcortical ROIs examined in this study are shown in Figure 1. The MANOVA of the volume data of these ROIs showed that many of them exhibited a significant main effect of group (see Fig. 1), indicating a global and widespread influence of PAE on human brain structures. Within these affected ROIs, a disproportionate PAE effect was further evaluated.
A common way through which specific patterns of PAE effect were investigated in previous studies was to control the entire brain size. For volumetric studies, this can be achieved through dividing the volumes of individual regions by the whole brain volume to generate normalized volumes. Similar normalization was performed in this study. The MANOVA of the normalized volume data showed that the left and right caudate nucleus (left: F 2,88 = 3.284, P = 0.042; right: F 2,88 = 3.221, P = 0.045), as well as several occipital and temporal regions, including the left cuneus cortex (F 2,88 = 3.295, P = 0.042) and lingual gyrus (F 2,88 = 3.096, P = 0.050), and the right inferior temporal gyrus (F 2,88 = 3.624, P = 0.031) and lingual gyrus (F 2,88 = 3.346, P = 0.040) exhibited significant differences among the three participant groups. Further pair‐wise comparisons (LSD) showed that the control group had larger normalized volume than the dysmorphic group, while there was no significant difference between the control and nondysmorphic groups in five of these six regions, except for the right inferior temporal gyrus (in this region, control > nondysmorphic, while no significant difference between control and dysmorphic).
Disproportionate PAE effects on volumes of the parietal regions [Archibald et al., 2001; Sowell et al., 2001b, 2002] and the frontal lobe [Astley et al., 2009] have been reported. To more appropriately compare our results with those previous studies, normalized volume of the parietal cortex was obtained by summing up the normalized volumes of the parietal ROIs, including the superior parietal lobule, inferior parietal lobule, postcentral gyrus, supramarginal gyrus, and precuneus cortex for the left and right hemisphere, respectively. ANOVA of the normalized parietal volumes showed that there were no significant group differences in either of the left and right parietal cortices (left: F 2,88 = 0.119, P = 0.888; right: F 2,88 = 0.390, P = 0.678). The same analysis also was performed with the normalized volume of the frontal cortex by summing up the normalized volumes of the superior frontal gyrus, rostral middle frontal gyrus, caudal middle frontal gyrus, frontal pole, lateral orbital frontal cortex, pars orbitalis, pars triangularis, pars opercularis, precentral gyrus, and middle orbital frontal cortex. The results showed that there were no significant group differences in either of the left and right frontal cortices (left: F 2,88 = 1.114, P = 0.333; right: F 2,88 = 2.842, P = 0.064).
Gender Difference in PAE Effect
Different patterns of PAE effect on the brain structures between the male and female participants, which were reflected by a significant group × gender interaction in the MANOVA of the original volume data, were found in a few cortical regions (Table II). These regions included the supramarginal gyrus, middle temporal gyrus, inferior temporal gyrus, transverse temporal gyrus, and lateral occipital cortex in the left hemisphere, and the supramarginal gyrus, middle temporal gyrus, caudal anterior cingulate cortex, and posterior cingulate cortex in the right hemisphere. Furthermore, one‐way ANOVA showed that PAE significantly affected the volumes of these regions in the male, but not in the female participants, except for the right caudal anterior and posterior cingulate cortices (Table II).
Table II.
ROIs exhibiting gender difference in PAE effect
| Brain Regions | Volume (cm3), mean (SD) | Statistics | P | ||
|---|---|---|---|---|---|
| Ctrla | NDysa | Dysa | |||
| Left Hemisphere | |||||
| Supramarginal gyrus | F 2,88 = 4.305b | 0.016 | |||
| Male | 12.21 (2.05) | 10.13 (1.94) | 10.34 (1.46) | F 2,33 = 4.682c | 0.016 |
| Female | 9.62 (1.46) | 9.99 (1.17) | 8.91 (1.65) | F 2,55 = 3.092c | n.s. |
| Middle temporal gyrus | F 2,88 = 4.183b | 0.018 | |||
| Male | 12.06 (1.71) | 10.10 (1.72) | 10.14 (1.82) | F 2,33 = 4.845c | 0.014 |
| Female | 8.78 (1.64) | 9.08 (1.43) | 8.96 (1.56) | F 2,55 = 0.188c | n.s. |
| Inferior temporal gyrus | F 2,88 = 4.101b | 0.020 | |||
| Male | 10.22 (2.41) | 8.06 (1.77) | 8.48 (1.52) | F 2,33 = 4.092c | 0.026 |
| Female | 7.73 (1.26) | 8.00 (1.42) | 7.30 (1.28) | F 2,55 = 1.385c | n.s. |
| Transverse temporal gyrus | F 2,88 = 3.834b | 0.025 | |||
| Male | 1.36 (0.15) | 1.08 (0.16) | 1.13 (0.18) | F 2,33 = 9.221c | 0.001 |
| Female | 1.13 (0.24) | 1.15 (0.19) | 1.10 (0.22) | F 2,55 = 0.240c | n.s. |
| Lateral occipital cortex | F 2,88 = 3.430b | 0.037 | |||
| Male | 13.27 (1.52) | 13.16 (1.99) | 10.73 (1.91) | F 2,33 = 8.086c | 0.001 |
| Female | 10.78 (1.57) | 10.81 (1.42) | 10.31 (1.91) | F 2,55 = 0.537c | n.s. |
| Right Hemisphere | |||||
| Supramarginal gyrus | F 2,88 = 3.171b | 0.047 | |||
| Male | 11.76 (1.89) | 10.05 (1.18) | 9.89 (1.36) | F 2,33 = 5.675c | 0.008 |
| Female | 9.63 (1.65) | 9.89 (1.11) | 9.14 (1.84) | F 2,55 = 1.297c | n.s. |
| Middle temporal gyrus | F 2,88 = 3.870b | 0.024 | |||
| Male | 12.14 (1.35) | 9.99 (1.34) | 10.63 (2.20) | F 2,33 = 4.602c | 0.017 |
| Female | 9.47 (1.79) | 9.63 (1.34) | 8.73 (1.40) | F 2,55 = 1.906c | n.s. |
| Caudal anterior cingulate cortex | F 2,88 = 4.956b | 0.009 | |||
| Male | 2.18 (0.29) | 1.67 (0.40) | 2.01 (0.67) | F 2,33 = 2.933c | n.s. |
| Female | 1.98 (0.49) | 1.93 (0.29) | 1.59 (0.35) | F 2,55 = 5.405c | 0.007 |
| Posterior cingulate cortex | F 2,88 = 3.467b | 0.036 | |||
| Male | 3.93 (0.46) | 3.38 (0.56) | 3.58 (0.95) | F 2,33 = 1.691c | n.s. |
| Female | 2.92 (0.53) | 3.16 (0.38) | 2.85 (0.54) | F 2,55 = 2.689c | n.s. |
Ctrl: control group, NDys: nondysmorphic group, Dys: dysmorphic group.
Two‐way group × gender analyses of variance (ANOVA) were completed for the data. Group × gender interaction effects are reported in table.
One‐way ANOVA of group factor was completed for the male and the female participants, respectively.
Relationship Between PAE, Alteration in Whole Brain Volume, and Alteration in IQ
To examine whether the alteration in overall brain volume is related to a deficit in cognitive ability, partial correlation analysis was performed between the IQ score and the whole brain volume (excluding the ventricles) for the three participant groups respectively. Because there was a significant gender difference in the whole brain volume (F 1,88 = 49.845, P < 0.001) and also in IQ score (F 1,87 = 6.392, P = 0.013), the gender factor was controlled in this and the following analysis. As shown in Figure 2A, the IQ score and the whole brain volume were significantly correlated in the two PAE groups, but not in the control group. When the data for the two exposed groups were combined, correlation between the IQ score and the whole brain volume was still significant (Fig. 2B, middle). Moreover, the PAE level was also significantly correlated with the whole brain volume (Fig. 2B, left). The PAE level and the IQ score were not significantly correlated (Fig. 2B, right). Mediation analysis showed that PAE affected the IQ score by altering the whole brain volume (a significant indirect effect: 10,000 bootstrapping re‐samples, P < 0.010). These relationships could be quantitatively expressed with the following linear regression results for all of the PAE participants: For the PAE level (AAPW) and the whole brain volume: brain volume = 1266.04 − 61.12 × log10(AAPW) − 114.78 × gender (gender = 1, 2; 1: male, 2: female). For the whole brain volume and the IQ score: IQ = 14.28 + 0.05954 × brain volume +1.630 × gender (gender = 1, 2; 1: male, 2: female). As predicted, a negative correlation was shown between the PAE level and the whole brain volume.
Figure 2.
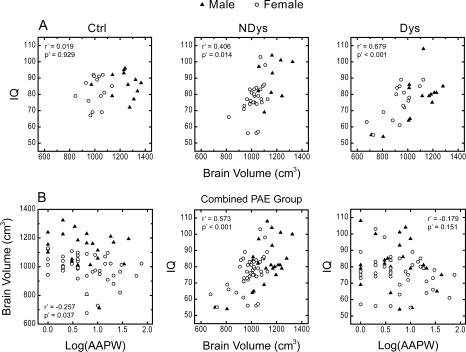
Correlation between PAE, alteration in brain and alteration in behavior. r′, P′: correlation coefficient and significance level when controlling the gender factor. A: Whole brain volume and IQ. Ctrl: control group, NDys: nondysmorphic group, Dys: dysmorphic group. B: Relationship between PAE, whole brain volume and IQ for the combined PAE group. Log(AAPW): Log10 of absolute alcohol per week (ounces).
Brain Regions Identified With a Negative Correlation Between the PAE Level and Volume
The above correlation analysis confirms that there was an adverse effect of PAE on the whole brain volume in the PAE participants. The same approach was applied to the original volume data of the cortical and subcortical ROIs defined in this study. The results showed that volumes of several ROIs were significantly negatively correlated with the PAE level. In the subcortical structures, these ROIs included the left amygdala (correlation coefficient, r = −0.258, P = 0.037) and the posterior portion of corpus callosum (r = −0.244, P = 0.048). The left and right cerebellums also showed a negative correlation (left: r = −0.322, P = 0.008; right: r = −0.326, P = 0.006). In the cortical ROIs, the inferior parietal lobule (r = −0.322, P = 0.008), lateral orbital frontal cortex (r = −0.255, P = 0.039), lingual gyrus (r = −0.404, P = 0.001), pars opercularis (r = −0.288, P = 0.019), and pericalcarine cortex (r = −0.278, P = 0.024) in the left hemisphere, the banks of superior temporal sulcus (r = −0.268, P = 0.029), isthmus of cingulate cortex (r = −0.293, P = 0.017), lingual gyrus (r = −0.437, p < 0.001), pars opercularis (r = −0.279, P = 0.024), pericalcarine cortex (r = −0.328, P = 0.007), precentral gyrus (r = −0.263, P = 0.033), and superior parietal lobule (r = −0.291, P = 0.018) in the right hemisphere demonstrated this negative PAE—volume relationship. These cortical ROIs are shown in Figure 3.
Figure 3.
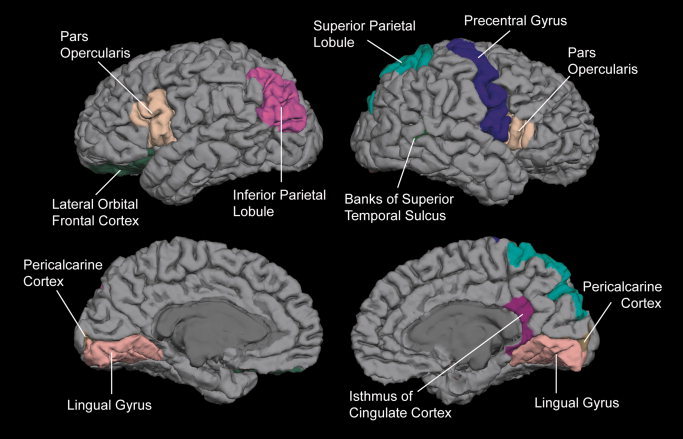
Cortical regions whose volumes were negatively correlated with the PAE level.
Effects of PAE on General Physical Growth
As shown in Table III, physical growth data, including length/height, weight and head circumference, were collected for the participants at birth and when imaged. Since physical growth data at birth usually vary with gestational age, which was different among the three participant groups (F 2,87 = 4.675, P = 0.012) in this study, the gestational age was set as a covariate in ANOVA. The results showed that there were significant group difference in birth weight (F 2,86 = 8.280, P = 0.001), birth head circumference (F 2,76 = 6.801, P = 0.002), adult weight (F 2,84 = 6.229, P = 0.003), and adult head circumference (F 2,85 = 4.074, P = 0.020), but not in birth length (F 2,81 = 1.380, P = 0.257) and adult height (F 2,84 = 0.445, P = 0.642). When each of these growth factors was set as another covariate (in addition to the gestational age) respectively in the ANOVA on the whole brain volume, the group difference was still significant for all these factors (birth length: F 2,80 = 6.280, P = 0.003; birth weight: F 2,85 = 3.817, P = 0.026; adult height: F 2,83 = 7.304, P = 0.001; adult weight: F 2,83 = 4.858, P = 0.010; adult head circumference: F 2,84 = 3.478, P = 0.035), except for the birth head circumference (F 2,75 = 1.786, P = 0.175).
Table III.
Physical growth characteristics of participants
| Group | |||||
|---|---|---|---|---|---|
| Variable | Ctrla, mean (SD), N | NDysa, mean (SD), N | Dysa, mean (SD), N | ANOVA | |
| Gestational age (weeks) | b, * | — | |||
| Male | 39.92 (0.97), 12 | 40.22 (0.62), 10 | 39.65 (1.38), 14 | ||
| Female | 39.51 (1.28), 15 | 40.04 (1.51), 27 | 37.85 (3.27), 15 | ||
| Birth length (cm) | c | d, * | |||
| Male | 50.82 (3.03), 11 | 50.27 (1.29), 9 | 48.82 (2.84), 14 | ||
| Female | 47.21 (4.56), 14 | 48.32 (2.77), 25 | 44.83 (4.29), 15 | ||
| Birth weight (kg) | c, * | d, * | |||
| Male | 3.403 (0.489), 12 | 3.196 (0.273), 10 | 2.875 (0.566), 14 | ||
| Female | 3.029 (0.379), 15 | 3.204 (0.560), 27 | 2.320 (0.632), 16 | ||
| Birth head circumference (cm) | c, * | d, n.s. | |||
| Male | 34.50 (1.11), 10 | 34.11 (1.24), 9 | 33.17 (1.65), 13 | ||
| Female | 33.79 (1.16), 12 | 33.85 (1.39), 24 | 31.07 (2.75), 15 | ||
| Adult height (cm) | c | d, * | |||
| Male | 179.41 (6.50), 11 | 175.35 (7.80), 10 | 177.14 (6.81), 14 | ||
| Female | 163.26 (3.85), 15 | 164.69 (6.46), 26 | 161.66 (9.16), 16 | ||
| Adult weight (kg) | c, * | d, * | |||
| Male | 92.33 (25.03), 11 | 89.95 (23.81), 10 | 73.29 (21.55), 14 | ||
| Female | 78.72 (20.75), 15 | 77.53 (21.60), 26 | 58.99 (13.42), 16 | ||
| Adult head circumference (cm) | c, * | d, * | |||
| Male | 59.93 (1.75), 11 | 58.55 (1.59), 10 | 56.68 (3.45), 14 | ||
| Female | 57.01 (3.86), 15 | 57.16 (2.82), 27 | 55.46 (3.51), 16 | ||
| Adult brain volume (cm3) | c, * | — | |||
| Male | 1236.0 (109.2), 12 | 1152.8 (93.4), 10 | 1077.0 (162.5), 14 | ||
| Female | 1023.8 (96.4), 15 | 1024.0 (64.2), 27 | 930.7 (117.2), 16 | ||
Ctrl: control group, NDys: nondysmorphic group, Dys: dysmorphic group, N: number of participants.
Two‐way group × gender analysis of variance (ANOVA) was completed for the variable.
Two‐way group × gender ANOVA (with controlling the gestational age) was completed for the variable.
Two‐way group × gender ANOVA (with controlling both the gestational age and the variable) was completed on the adult brain volume.
The effect of group in the ANOVA was significant (P < 0.05).
Partial correlation analysis (gender as a control factor) showed that there were significant correlations between the PAE level and these factors: gestational age (r = −0.305, P = 0.013), birth length (r = −0.318, P = 0.012), birth weight (r = −0.296, P = 0.016), and birth head circumference (r = −0.307, P = 0.017), but not adult height (r = −0.227, P = 0.069), adult weight (r = −0.092, P = 0.465), and adult head circumference (r = −0.073, P = 0.562). When the gestational age was set as another control factor (in addition to the gender factor), none of these factors (birth length: r = −0.152, P = 0.241; birth weight: r = −0.124, P = 0.329; birth head circumference: r = −0.136, P = 0.303; adult height: r = −0.157, P = 0.219; adult weight: r = −0.033, P = 0.795; adult head circumference: r = −0.017, P = 0.893), as well as the whole brain volume (r = −0.177, P = 0.163) was significantly correlated with the PAE level.
DISCUSSION
In this study, analysis of the original volume data of the cortical and subcortical ROIs indicates a global and widespread influence of PAE on human brain structures (see Fig. 1). Since the goal of this study is to investigate specific patterns of PAE effect on the brain, this global effect will not be discussed further. However, it is worth stating that this result confirms that the reduced entire brain size in PAE individuals is due to a global PAE effect on most brain structures. This result is also consistent with previous behavioral studies showing various adverse PAE effects on cognitive functions including attention, executive control, learning, memory, language, visuospatial/visuomotor functions, and motor skills [Riley and McGee, 2005] because taken together, these functions are underpinned by widespread networks of brain structures.
In contrast to this global PAE effect, specific PAE effects are referred to as localized effects on a few brain structures in this study. These PAE effects were investigated in two ways: (1) a volumetric difference between the PAE and the control groups (a group difference approach) and (2) a negative correlation between the PAE level and the volume of brain regions (a parametric approach). With the group difference approach, two aspects of PAE effect were examined. First, a disproportionate PAE effect was found in several occipital and temporal regions in both hemispheres, a pattern not reported previously. Second, a gender difference in PAE effect was shown in several cortical ROIs, which suggests that males may be more vulnerable to PAE than females. Using a parametric approach, quantitative relationships between the PAE level, alteration in whole brain volume and alteration in cognitive ability (IQ) were evaluated first, and then a negative correlation between the PAE level and the ROI volume was used to identify the brain regions specifically affected by PAE. In addition, the PAE effects on the brain could be differentiated from the PAE effects on general physical growth in young adults, suggesting that the brain can be specifically influenced by PAE. More details about these findings are discussed below.
Disproportionate PAE Effect on Cortical and Subcortical Regions
After normalization by the whole brain volume, regions still showing PAE effect can be considered to be more affected by, or more sensitive to PAE than other regions. For the subcortical regions, the left and right caudate nuclei were more influenced by PAE, a finding consistent with previous reports [Archibald et al., 2001; Astley et al., 2009]. These convergent results from different groups with different PAE samples suggest that the caudate nucleus may be a sensitive target of alcohol abuse during gestation.
In the cortical ROIs, several occipital and temporal regions exhibited the disproportionate PAE effect. Alterations in cortical regions disproportionate to the entire brain size have been reported in previous studies, but in the parietal regions [Archibald et al., 2001; Sowell et al., 2001b, 2002] or in the frontal lobe [Astley et al., 2009]. In contrast, our results did not show significant disproportionate PAE effect in the parietal and frontal lobes. In one of our previous studies, we found a PAE‐related reduction of the gray and white matter volume in the occipital‐temporal areas. Although a different method of analysis was used, this PAE sample had similar characteristics to those in this study [Li et al., 2008], suggesting that the discrepancy in observed disproportionate PAE effects between our results and those of other groups may be attributable to the differences in sample characteristics (e.g., age range of the participants, exposure levels, research sample vs. clinical sample).
Gender: An Important Factor for PAE Effect
An intriguing finding in this study was the identification of gender differences in PAE effect in some cortical regions (Table II). Further analysis revealed that the male but not the female participants were significantly affected by PAE in most of these regions (Table II). This finding suggests that males may be more vulnerable to PAE than females. Previously, gender differences in PAE effect have been shown only in animal studies [Hellemans et al., 2010; Weinberg et al., 2008]. For example, male rats were more affected than female rats in corpus callosum [Zimmerberg and Mickus, 1990; Zimmerberg and Scalzi, 1989]. PAE‐related alterations in hormonal activities and concomitant behavior alterations also showed differences between two genders [Hofmann et al., 2005; Lee and Rivier, 1996; Osborn et al., 1996, 1998; Weinberg, 1988; Weinberg and Jerrells, 1991]. It is possible that the adverse effects of alcohol on fetal development are modulated by the hormonal system in human samples as well.
Gender difference in PAE effect on brain structure of human subjects has never been reported in previous imaging studies. It is possible that this issue was not evaluated previously because smaller sample sizes did not permit it. The gender difference reported in this study may be sample specific and these findings need to be replicated. Nevertheless, our results suggest that gender may be an important factor for PAE effects that should be taken into account in the future studies.
Parametric Approach vs. Group Difference Approach
To date, various PAE effects, representing the difference between PAE and control groups, have been noted. However, it is important to be cautious in drawing inferences based on these PAE “effects” because they might not come from real changes induced by PAE, but from confounding factors that can generate group differences. For example, if a PAE group has a higher percentage of females than the control group, the difference in brain volume between these two groups may be caused by this unbalanced sampling in gender, given that females on average have smaller brain volume than males. Thus, a comprehensive description of both PAE and control groups is important to rule out confounding factors. To make the case more complicated, even if the greatest effort is made to match PAE and control samples, the PAE “effect” (group difference) still could be problematic because there could be other unknown confounding factors that may contribute to the group difference. Thus, it is important to validate the results that came from the group difference approach by using other approaches.
To provide converging evidence for adverse effect of PAE on the brain, the quantitative relationship between maternal alcohol use during gestation, as quantified by ounces of AAPW, and its outcomes was evaluated. The results showed a significant correlation between the IQ score and the whole brain volume (excluding the ventricles) in the two PAE groups (Fig. 2A, middle and right), but not in the control group (Fig. 2A, left). These results indicate that, in the PAE groups, the smaller the brain, the lower the IQ. Further analysis using the combined PAE group showed a negative correlation between the PAE level and the whole brain volume (Fig. 2B, left), and a positive correlation between the whole brain volume and IQ score (Fig. 2B, middle). Mediation analysis indicates that an indirect effect (from the PAE level on the whole brain volume and then on the IQ scores) was significant, supporting a causal link between PAE, whole brain volume and IQ score: the more alcohol used per week, the smaller the brain, and then the lower the IQ. Although such a relationship has been assumed, this is the first time it has been documented in a human sample. These results from the parametric approach are consistent with previous reports and ours (using the group difference approach) that the entire brain size is reduced by PAE. Thus, the information about the PAE level for the participants of this study is valid and can be used to evaluate the specific pattern of PAE effect on the cortical and subcortical ROIs though the parametric approach.
Specific PAE Effect Evaluated With the Parametric Approach
Through the parametric approach, we found that two subcortical regions, the left amygdala and the posterior portion of corpus callosum, were specifically affected by PAE. This study is the first to reveal a specific PAE effect on the left amygdala. In contrast, PAE effects on the posterior portion of corpus callosum are consistently reported across research groups with different PAE samples [Lebel et al., 2008; Li et al., 2009; Ma et al., 2005; Riley et al., 1995; Sowell et al., 2001a, 2008; Wozniak et al., 2006, 2009]. In line with these results, our data from the group difference approach (Fig. 1B) and the parametric approach support that the posterior portion of corpus callosum is specifically affected by PAE. Similarly, our results also suggest that the left and right cerebellums are specific targets of PAE, which is consistent with the previous study by O'Hare et al. [2005].
Negative correlation between PAE quantity (maximum number of alcoholic drinks per drinking occasion) and the volume of hippocampus was reported in a previous study [Astley et al., 2009]. This result is different from what was observed in this study (controlling gender, left hippocampus: r = −0.048, P = 0.701; right hippocampus: r = −0.185, P = 0.137; not controlling gender, left: r = −0.063, P = 0.611; right: r = −0.196, P = 0.112). This discrepancy may be attributed to the difference in quantifying the PAE level (obtained retrospectively vs. collected during pregnancy) and/or in age of the participants (children vs. young adults) between the previous study and ours.
In addition to a general reduction in the whole brain volume, several cortical regions were found to exhibit this specific PAE effect (see Fig. 3). Compared with the results from the group difference approach (see Fig. 1), fewer ROIs were highlighted by the parametric approach, and some of them did not even show significant group difference in Figure 1. Although this pattern of effect, including that of the left amygdala, may be sample specific and, therefore, need to be replicated, the parametric approach applied in this study should provide unique information for understanding the neural substrate of PAE effects on the human brain, as well as for the future studies.
PAE Effects on the Brain vs. PAE Effects on General Physical Growth
As discussed above, PAE exerts adverse effects on the brain in two ways: general and widespread across the entire brain (see Fig. 1), as well as specifically in some brain structures. To a larger extent, does PAE alter the whole body physical growth and the brain (part of the body) development differently? To investigate this issue, physical growth data collected for the participants at birth and when imaged as young adults were analyzed with both the group difference and parametric approaches. Analysis of the group difference showed that the physical growth factors (weight and head circumference) were significantly different among the three participant groups both at birth and in young adult age. However, when each of these factors was set as a covariate in ANOVA, only the birth head circumference was important for interpreting the group difference in adult whole brain volume (Table III). With the parametric approach, the results showed that only the gestational age, physical growth factors at birth and adult brain volume, but not the adult growth factors, were significantly correlated with the PAE level. After controlling the gestational age, none of these relationships was significant. Taken all these results together, it is possible to infer that the PAE effect on the adult brain is closely related to the PAE effect on the head development during the gestational period, and the PAE effect on the brain development is different from the PAE effect on the general physical growth until the young adult age. Thus, PAE may exert a specific influence on the brain development when compared with the PAE effect on the whole body physical growth.
Possible Effects of Other Substance Uses
Prenatal exposure to other drugs (cigarettes, marijuana, and cocaine) was also recorded for our participants (Table I). Because frequent cocaine abuse was very rare in the population at the beginning of the 1980s, it can be ruled out as a contributing factor to the effects we found. Prenatal cigarette exposure has been associated with adverse effects in a few brain structures [Paus et al., 2008; Toro et al., 2008]. Compared with other drugs (including cocaine, alcohol and tobacco), prenatal marijuana exposure induces less significant effects on the brain volume [Rivkin et al., 2008]. Based on these previous studies, cigarette and marijuana may not have as much impact as alcohol on fetal brain, given that such a widespread PAE effect on the cortical and subcortical regions was found in this study (see Fig. 1). Thus, these two drugs may not be major contributing factors to the effects we found as well.
Participants' self‐reports for ever using and currently using tobacco, alcohol, marijuana, cocaine, amphetamines, and ecstasy also were recorded and analyzed. No significant group differences were found for all these types of substance use. Furthermore, lab tests for these participants showed that no one was positive to amphetamines, barbiturates, benzodiazepines, opiates, or PCP (phencyclidine). There were no significant group differences in positive response to cocaine and marijuana. ANOVA on blood GGTP (γ‐glutamyl transpepsidate, a liver enzyme associated with alcohol use) level showed no significant difference among the three participant groups. Actually, all group means of GGTP were in normal range.
To summarize, although the roles of these substance uses may not be completely ruled out, PAE is considered the major contributing factor to the adverse effects observed in this study.
CONCLUSION
In this study, we first applied a traditional group difference approach to investigate the specific effects of PAE on the human brain structures. Some discrepancies in PAE effect was found between the previous studies using the same approach and ours although we also confirmed some previous findings. In addition, a gender difference in PAE effect was observed, for the first time, in a human PAE sample. These results indicate that sampling and gender factors may alter the difference between the PAE and control groups, which may confound the real PAE outcomes. Then, a parametric approach was applied by correlating the PAE level, alteration in whole brain volume and alteration in cognitive ability (IQ). The results confirm, for the first time in human PAE sample, that the more alcohol used per week, the smaller the brain, and the lower the IQ. With this approach, cortical and subcortical regions specifically affected by PAE were identified. Moreover, our data suggest that PAE may exert specific effect on the brain when compared with the PAE effects on general body physical growth. Although this is a structural MRI study, our findings have important implications for future studies in this field. First, possible influence of sampling on PAE effect should be discussed. Second, gender factor should be considered in paradigm design and data analysis. Third, when possible, both group difference approach and parametric approach should be applied. Fourth, the cortical and subcortical regions specifically affected by PAE found in this study may be the potential neural substrate for various behavioral deficits induced by PAE, which should be investigated with functional MRI technique and behavioral studies.
Acknowledgements
The authors thank the families and young adults who have participated in this research. They also acknowledge the significant contribution of Sharron Paige to this research effort.
Contributor Information
Xiangchuan Chen, Email: xiangchuan.chen@emory.edu.
Claire D. Coles, Email: ccoles@emory.edu.
REFERENCES
- Archibald SL, Fennema‐Notestine C, Gamst A, Riley EP, Mattson SN, Jernigan TL ( 2001): Brain dysmorphology in individuals with severe prenatal alcohol exposure. Dev Med Child Neurol 43: 148–154. [PubMed] [Google Scholar]
- Astley SJ, Aylward EH, Olson HC, Kerns K, Brooks A, Coggins TE, Davies J, Dorn S, Gendler B, Jirikowic T, Kraegel P, Maravilla K, Richards T. ( 2009): Magnetic resonance imaging outcomes from a comprehensive magnetic resonance study of children with fetal alcohol spectrum disorders. Alcohol Clin Exp Res 33: 1671–1689. [DOI] [PMC free article] [PubMed] [Google Scholar]
- Bookstein FL, Sampson PD, Streissguth AP, Connor PD ( 2001): Geometric morphometrics of corpus callosum and subcortical structures in the fetal‐alcohol‐affected brain. Teratology 64: 4–32. [DOI] [PubMed] [Google Scholar]
- Bookstein FL, Sampson PD, Connor PD, Streissguth AP ( 2002a): Midline corpus callosum is a neuroanatomical focus of fetal alcohol damage. Anat Rec 269: 162–174. [DOI] [PubMed] [Google Scholar]
- Bookstein FL, Streissguth AP, Sampson PD, Connor PD, Barr HM ( 2002b): Corpus callosum shape and neuropsychological deficits in adult males with heavy fetal alcohol exposure. NeuroImage 15: 233–251. [DOI] [PubMed] [Google Scholar]
- Clarren SK ( 1986): Neuropathology in fetal alcohol syndrome In: West JR, editor. Alcohol and Brain Development. New York: Oxford University Press; pp 158–166. [Google Scholar]
- Coles CD, Smith I, Fernhoff PM, Falek A ( 1985): Neonatal neurobehavioral characteristics as correlates of maternal alcohol use during gestation. Alcohol Clin Exp Res 9: 454–460. [DOI] [PubMed] [Google Scholar]
- Coles CD, Brown RT, Smith IE, Platzman KA, Erickson S, Falek A ( 1991): Effects of prenatal alcohol exposure at school age. I. Physical and cognitive development. Neurotoxicol Teratol 13: 357–367. [DOI] [PubMed] [Google Scholar]
- Coles CD, Platzman KA, Raskind‐Hood CL, Brown RT, Falek A, Smith IE ( 1997): A comparison of children affected by prenatal alcohol exposure and attention deficit, hyperactivity disorder. Alcohol Clin Exp Res 21: 150–161. [PubMed] [Google Scholar]
- Coles CD, Platzman KA, Lynch ME, Freides D ( 2002): Auditory and visual sustained attention in adolescents prenatally exposed to alcohol. Alcohol Clin Exp Res 26: 263–171. [PubMed] [Google Scholar]
- Dale AM, Fischl B, Sereno MI ( 1999): Cortical surface‐based analysis. I. Segmentation and surface reconstruction. NeuroImage 9: 179–194. [DOI] [PubMed] [Google Scholar]
- Desikan RS, Segonne F, Fischl B, Quinn BT, Dickerson BC, Blacker D, Buckner RL, Dale AM, Maguire RP, Hyman BT, Albert MS, Killiany RJ. 2006): An automated labeling system for subdividing the human cerebral cortex on MRI scans into gyral based regions of interest. Neuroimage 31: 968–980. [DOI] [PubMed] [Google Scholar]
- Fischl B, Sereno MI, Dale AM ( 1999): Cortical surface‐based analysis. II. Inflation, flattening, and a surface‐based coordinate system. NeuroImage 9: 195–207. [DOI] [PubMed] [Google Scholar]
- Fischl B, Salat DH, Busa E, Albert M, Dieterich M, Haselgrove C, van der Kouwe A, Killiany R, Kennedy D, Klaveness S, Montillo A, Makris N, Rosen B, Dale AM. ( 2002): Whole brain segmentation: automated labeling of neuroanatomical structures in the human brain. Neuron 33: 341–355. [DOI] [PubMed] [Google Scholar]
- Fischl B, van der Kouwe A, Destrieux C, Halgren E, Segonne F, Salat DH, Busa E, Seidman LJ, Goldstein J, Kennedy D, Caviness V, Makris N, Rosen B, Dale AM. ( 2004): Automatically parcellating the human cerebral cortex. Cereb Cortex 14: 11–22. [DOI] [PubMed] [Google Scholar]
- Guerri C ( 1998): Neuroanatomical and neurophysiological mechanisms involved in central nervous system dysfunctions induced by prenatal alcohol exposure. Alcohol Clin Exp Res 22: 304–312. [DOI] [PubMed] [Google Scholar]
- Hellemans KG, Sliwowska JH, Verma P, Weinberg J ( 2010): Prenatal alcohol exposure: Fetal programming and later life vulnerability to stress, depression and anxiety disorders. Neurosci Biobehav Rev 34: 791–807. [DOI] [PMC free article] [PubMed] [Google Scholar]
- Hofmann CE, Patyk IA, Weinberg J ( 2005): Prenatal ethanol exposure: Sex differences in anxiety and anxiolytic response to a 5‐HT1A agonist. Pharmacol Biochem Behav 82: 549–558. [DOI] [PubMed] [Google Scholar]
- Lebel C, Rasmussen C, Wyper K, Walker L, Andrew G, Yager J, Beaulieu C ( 2008): Brain diffusion abnormalities in children with fetal alcohol spectrum disorder. Alcohol Clin Exp Res. [DOI] [PubMed] [Google Scholar]
- Lebel C, Rasmussen C, Wyper K, Walker L, Andrew G, Yager J, Beaulieu C. ( 2008): Brain diffusion abnormalities in children with fetal alcohol spectrum disorder. Alcohol Clin Exp Res 32 ( 10): 1732–1740. [DOI] [PubMed] [Google Scholar]
- Li Z, Coles CD, Lynch ME, Ma X, Peltier S, Hu X ( 2008): Occipital‐temporal reduction and sustained visual attention deficit in prenatal alcohol exposed adults. Brain Imaging Behav 2: 39–48. [DOI] [PMC free article] [PubMed] [Google Scholar]
- Li L, Coles CD, Lynch ME, Hu X. ( 2009): Voxelwise and skeleton‐based region of interest analysis of fetal alcohol syndrome and fetal alcohol spectrum disorders in young adults. Hum Brain Mapp 30: 3265–3274. [DOI] [PMC free article] [PubMed] [Google Scholar]
- Ma X, Coles CD, Lynch ME, Laconte SM, Zurkiya O, Wang D, Hu X ( 2005): Evaluation of corpus callosum anisotropy in young adults with fetal alcohol syndrome according to diffusion tensor imaging. Alcohol Clin Exp Res 29: 1214–1222. [DOI] [PubMed] [Google Scholar]
- Niccols A ( 2007): Fetal alcohol syndrome and the developing socio‐emotional brain. Brain Cogn 65: 135–142. [DOI] [PubMed] [Google Scholar]
- O'Hare ED, Kan E, Yoshii J, Mattson SN, Riley EP, Thompson PM, Toga AW, Sowell ER ( 2005): Mapping cerebellar vermal morphology and cognitive correlates in prenatal alcohol exposure. Neuroreport 16: 1285–1290. [DOI] [PubMed] [Google Scholar]
- Osborn JA, Kim CK, Steiger J, Weinberg J ( 1998): Prenatal ethanol exposure differentially alters behavior in males and females on the elevated plus maze. Alcohol Clin Exp Res 22: 685–696. [PubMed] [Google Scholar]
- Osborn JA, Kim CK, Yu W, Herbert L, Weinberg J ( 1996): Fetal ethanol exposure alters pituitary‐adrenal sensitivity to dexamethasone suppression. Psychoneuroendocrinology 21: 127–143. [DOI] [PubMed] [Google Scholar]
- Paus T, Nawazkhan I, Leonard G, Perron M, Pike GB, Pitiot A, Richer L, Veillette S, Pausova Z ( 2008): Corpus callosum in adolescent offspring exposed prenatally to maternal cigarette smoking. NeuroImage 40: 435–441. [DOI] [PubMed] [Google Scholar]
- Preacher KJ, Hayes AF ( 2008): Asymptotic and resampling strategies for assessing and comparing indirect effects in multiple mediator models. Behav Res Methods 40: 879–891. [DOI] [PubMed] [Google Scholar]
- Riley EP, Mattson SN, Sowell ER, Jernigan TL, Sobel DF, Jones KL ( 1995): Abnormalities of the corpus callosum in children prenatally exposed to alcohol. Alcohol Clin Exp Res 19: 1198–1202. [DOI] [PubMed] [Google Scholar]
- Riley EP, McGee CL ( 2005): Fetal alcohol spectrum disorders: An overview with emphasis on changes in brain and behavior. Exp Biol Med (Maywood) 230: 357–365. [DOI] [PubMed] [Google Scholar]
- Rivkin MJ, Davis PE, Lemaster JL, Cabral HJ, Warfield SK, Mulkern RV, Robson CD, Rose‐Jacobs R, Frank DA ( 2008): Volumetric MRI study of brain in children with intrauterine exposure to cocaine, alcohol, tobacco, and marijuana. Pediatrics 121: 741–750. [DOI] [PMC free article] [PubMed] [Google Scholar]
- Sowell ER, Johnson A, Kan E, Lu LH, van Horn JD, Toga AW, O'Connor MJ, Bookheimer SY ( 2008): Mapping white matter integrity and neurobehavioral correlates in children with fetal alcohol spectrum disorders. J Neurosci 28: 1313–1319. [DOI] [PMC free article] [PubMed] [Google Scholar]
- Sowell ER, Mattson SN, Thompson PM, Jernigan TL, Riley EP, Toga AW ( 2001a): Mapping callosal morphology and cognitive correlates: Effects of heavy prenatal alcohol exposure. Neurology 57: 235–244. [DOI] [PubMed] [Google Scholar]
- Sowell ER, Thompson PM, Mattson SN, Tessner KD, Jernigan TL, Riley EP, Toga AW ( 2001b): Voxel‐based morphometric analyses of the brain in children and adolescents prenatally exposed to alcohol. Neuroreport 12: 515–523. [DOI] [PubMed] [Google Scholar]
- Sowell ER, Thompson PM, Mattson SN, Tessner KD, Jernigan TL, Riley EP, Toga AW ( 2002): Regional brain shape abnormalities persist into adolescence after heavy prenatal alcohol exposure. Cereb Cortex 12: 856–865. [DOI] [PubMed] [Google Scholar]
- Spadoni AD, McGee CL, Fryer SL, Riley EP ( 2007): Neuroimaging and fetal alcohol spectrum disorders. Neurosci Biobehav Rev 31: 239–245. [DOI] [PMC free article] [PubMed] [Google Scholar]
- Spampinato MV, Castillo M, Rojas R, Palacios E, Frascheri L, Descartes F ( 2005): Magnetic resonance imaging findings in substance abuse: Alcohol and alcoholism and syndromes associated with alcohol abuse. Top Magn Reson Imaging 16: 223–230. [DOI] [PubMed] [Google Scholar]
- Toro R, Leonard G, Lerner JV, Lerner RM, Perron M, Pike GB, Richer L, Veillette S, Pausova Z, Paus T ( 2008): Prenatal exposure to maternal cigarette smoking and the adolescent cerebral cortex. Neuropsychopharmacology 33: 1019–1027. [DOI] [PubMed] [Google Scholar]
- Wechsler D ( 1999): Wechsler Abbreviated Scale of Intelligence (WASI). San Antonio, TX: Harcourt Assessment. [Google Scholar]
- Weinberg J ( 1988): Hyperresponsiveness to stress: Differential effects of prenatal ethanol on males and females. Alcohol Clin Exp Res 12: 647–652. [DOI] [PubMed] [Google Scholar]
- Weinberg J, Jerrells TR ( 1991): Suppression of immune responsiveness: Sex differences in prenatal ethanol effects. Alcohol Clin Exp Res 15: 525–531. [DOI] [PubMed] [Google Scholar]
- Weinberg J, Sliwowska JH, Lan N, Hellemans KG ( 2008): Prenatal alcohol exposure: Foetal programming, the hypothalamic‐pituitary‐adrenal axis and sex differences in outcome. J Neuroendocrinol 20: 470–488. [DOI] [PMC free article] [PubMed] [Google Scholar]
- Wozniak JR, Mueller BA, Chang PN, Muetzel RL, Caros L, Lim KO ( 2006): Diffusion tensor imaging in children with fetal alcohol spectrum disorders. Alcohol Clin Exp Res 30: 1799–1806. [DOI] [PMC free article] [PubMed] [Google Scholar]
- Wozniak JR, Muetzel RL, Mueller BA, McGee CL, Freerks MA, Ward EE, Nelson ML, Chang PN, Lim KO ( 2009): Microstructural corpus callosum anomalies in children with prenatal alcohol exposure: An extension of previous diffusion tensor imaging findings. Alcohol Clin Exp Res 33: 1825–1835. [DOI] [PMC free article] [PubMed] [Google Scholar]
- Zimmerberg B, Scalzi LV ( 1989): Commissural size in neonatal rats: Effects of sex and prenatal alcohol exposure. Int J Dev Neurosci 7: 81–86. [DOI] [PubMed] [Google Scholar]
- Zimmerberg B, Mickus LA ( 1990): Sex differences in corpus callosum: Influence of prenatal alcohol exposure and maternal undernutrition. Brain Res 537: 115–122. [DOI] [PubMed] [Google Scholar]