

Abstract
Osteosarcoma (OS) is the common histological form of primary bone cancer and one of the leading aggressive cancers in children under age fifteen. Although several genetic predisposing conditions have been associated with OS the understanding of its molecular etiology is limited. Here, we show that microRNAs (miRNAs) at the chr.14q32 locus are significantly downregulated in osteosarcoma compared to normal bone tissues. Bioinformatic predictions identified that a subset of 14q32 miRNAs (miR-382, miR-369-3p, miR-544 and miR-134) could potentially target cMYC transcript. The physical interaction between these 14q32 miRNAs and cMYC was validated using reporter assays. Further, restoring expression of these four 14q32 miRNAs decreased cMYC levels and induced apoptosis in Saos2 cells. We also show that exogenous expression of 14q32 miRNAs in Saos2 cells significantly downregulated miR-17∼92, a transcriptional target of cMYC. The pro-apoptotic effect of 14q32 miRNAs in Saos2 cells was rescued either by overexpression of cMYC cDNA without the 3′UTR or with miR-17∼92 cluster. Further, array comparative genomic hybridization studies showed no DNA copy number changes at 14q32 locus in OS patient samples suggesting that downregulation of 14q32 miRNAs are not due to deletion at this locus. Together, our data support a model where the deregulation of a network involving 14q32 miRNAs, cMYC and miR-17∼92 miRNAs could contribute to osteosarcoma pathogenesis.
Keywords: bone neoplasm, cMYC, osteosarcoma, miR-17∼92, 14q32 miRNAs
Introduction
Osteosarcoma (OS) is the most common primary bone malignancy, affecting primarily children and young adolescents. The health impact and sociological burden of this cancer is disproportionate to the number of affected patients, given the significant morbidity associated with the disease and years of life lost. While the molecular basis of OS has received considerable attention during the past decade, it remains incompletely understood. The standard of care for appendicular OS in children leads to an overall 5-year survival rate of ∼70%. Despite this encouraging clinical outcome, 30% of children diagnosed with OS will not survive for more than five years, and fewer than 50% will live beyond 10 years [1, 2]. Therefore, an in-depth understanding of the pathobiology of OS is needed in order to develop rational treatment options for OS.
A number of recurrent chromosome aberrations have been identified in OS at the genomic level, even while these tumors exhibit unstable karyotypes [3]. For instance, amplification of the 6p12 region containing CDC5L and RUNX2 [4] and amplification of cMYC at 8q24 [5-7] have been observed in OS. Similarly, gene expression profiling has identified recurrent abnormalities and characteristic patterns of gene expression in OS, including the association of overexpression of BMPs and MMPs with poor prognoses [8, 9]. RB and p53 mutations have been demonstrated to be involved in osteosarcomagenesis [10, 11]. Interestingly, in contrast to some other cancer types, little is known about the role of microRNAs (miRNAs) in the pathogenesis of OS and regulation of abnormal gene expression [12-14].
miRNAs are evolutionarily conserved, small, non-coding RNA molecules of 18-22 nucleotides in length that can control gene function through mRNA degradation, translational inhibition or chromatin-based silencing mechanisms [15]. Each miRNA can potentially regulate hundreds of targets either directly or indirectly. Differential miRNA expression between tumors and normal tissue has been described for many tumor types [16-19], and individual miRNAs such as miR-206 and miR-2861 have been demonstrated to play roles in normal osteoblast differentiation [20, 21]. We therefore hypothesized that miRNAs play important roles in the etiology and/or progression of OS. In this study we have identified a unique miRNA expression profile for OS and have demonstrated that loss of 14q32 miRNAs stabilizes the expression of cMYC.
Materials and Methods
Tissue samples and RNA isolation
Frozen OS tissue samples and normal bone samples (femur/ tibia) of similar age group individuals were obtained through the tissue procurement facility at the University of Minnesota (Supplementary Table 1). Total RNA was isolated from 75-100 mg of frozen tissue using the miRvana total RNA isolation kit (Ambion Inc, Austin TX, USA) following the manufacturer's protocol. RNA was quantified using the Nanodrop 8000 (Nanodrop Technologies LLC, Wilmington, DE, USA). The quality of the RNA was tested on a 1.2% formaldehyde agarose gel with ethidium bromide staining, and RNA integrity was analyzed using a Nano Labchip (Agilent). Samples with RNA index number (RIN) values of 6 or more were included in this study.
Whole genome miRNA expression profiling
The miRNA expression patterns of OS samples were profiled using the human Illumina miRNA microarrays with 1135 miRNA assay probes (Illumina Inc, San Diego, CA) following the manufacturer's instructions [22]. The array matrix was imaged using an Illumina BeadArray Reader, which measured the fluorescence intensity at each addressed bead location. Intensity files were analyzed using BeadStudio version 3, and expression levels were converted to an average Beta value. Data analysis was carried out based on the criteria mentioned in Sarver 2010 [23].
qRT-PCR
cDNA was quantified with the miRscript SYBR green detection kit (Qiagen) using an miRNA-specific forward primer and a universal primer, following the manufacturer's instructions, in an ABI 7500 optical cycler (Applied Biosystems). The oligonucleotide primer sequence used for analysis is provided in Supplementary Table 2. U6 snRNA and GAPDH were used as controls for miRNA and mRNA qRT-PCR analyses, respectively. Threshold cycle (Ct) values calculated by the SDS v1.2.1 software (Applied Biosystem, USA) were exported and subjected to statistical analysis. Cycle threshold values obtained from duplicate reactions were subjected to statistical analysis, and expression was calculated following the comparative Ct method [24]. qRT-PCR reactions were carried out in triplicates and the average values were plotted as mean +_SD values.
Cell culture
Saos2 and U2os cells were grown in McCoy's5A medium (Lonza) with 15% fetal bovine serum. Hos cells were grown in Iscove's Modified Dulbecco's Medium (Lonza) with 15% fetal bovine serum, and HEK 293 cells were grown in DMEM (Thermofisher) with 15% fetal bovine serum. All cells were grown at 37°C with 5% CO2.
Luciferase reporter assays
A PSGG luciferase reporter construct containing the firefly luciferase sequence and the 3′UTR of cMYC cloned into Nhe I and Xho I sites were purchased from Switchgear genomics (Menlo Park, CA). HEK 293 cells (0.8 × 10⁶ cells) were transfected with 500 ng of PSGG plasmid and 75 ng of miRNA over-expression plasmid, pRL-TK (Promega, Madison, WI), with or without double stranded RNA oligonucleotides (5.0 μl of 10 μM solution) in duplicate using Lipofectamine 2000 and following the manufacturer's protocol (Invitrogen). Cells were collected after 48 hrs and assayed using the dual luciferase reporter system (Promega) following the manufacturer's protocol. Firefly luciferase values were normalized using Renilla luciferase expression, and average values were calculated from 2 sets of experiments. Cells transfected with pSGG plasmid containing only firefly luciferase were used as controls.
Nucleofection of miRNA mimics
miRNA-specific miRNA mimics were purchased from a commercial manufacturer (Dharmacon). Cells grown in T-75 flasks were trypsinized, and 0.1 × 10⁶ cells were nucleofected with double-stranded RNA oligonucleotides (10 nM final concentration) in 99.3 μl of nucleofection solution V using Nucleofector II equipment (Lonza), in duplicate. Nucleofected cells were transferred to 1.5 ml microcentrifuge tubes, incubated in a 37°C incubator for 20 min, transferred to 12-well plates after changing the media 6 hrs after treatment the cells were incubated up to 72 hrs at 37°C with 5% CO2. Programs Q-01, D-024 and X-001 were used to nucleofect HEK293, Saos2 and U2os cells, respectively. Cells were subjected to qualitative analysis at 48 hrs after nucleofection, with sham treated and nonnucleofected cells as controls. The efficiency of nucleofection was calculated by nucleofecting cells with 2.0 μg of pmaxGFP plasmid (Lonza) and monitoring the expression 20 hrs after nucleofection.
Apoptosis assay and ZVAD-fmk treatment
The rate of apoptosis was determined by flow cytometry following the quick method of Riccardi and Nicoletti, 2006 [25]. Briefly, cells were stained with subsaturation quantity of propidium iodide(PI) as recommended and fluorescence data was collected in logarithmic scale. PI-stained cells (n=10,000) were subjected to flow cytometry analysis 48 hrs after treatment in a FACS Calibur (BD Biosciences, San Jose, CA) using the FL2 channel. As the intake of PI is proportional to the fraction of cells with damaged membranes resulted by apoptotic events, PI positive cells with the fluorescence value of more than 2 logs relative to sham and control cells were scored positive. For the apoptosis inhibition experiments, cells were continuously incubated with 20 μM of ZVAD-fmk (#550377, BD Biosciences) immediately after nucleofection until analysis.
RNAi for cMYC
Saos2 cells (0.1 × 10⁶) were nucleofected with 500 ng of plasmid DNA expressing shRNA against cMYC (origene #TGS311323, construct GI345288 and GI345287) with scrambled controls (#TR30013) using the programs D-024, in duplicates.
Western blot for cMYC
Treated cells were harvested and lysed in lysis buffer (25 mM Hepes pH 7.6, 300 mM NaCl, 1.5 mM Mgcl2, 0.2 mM EDTA and 0.1 % Triton x-100) containing a protease inhibitor cocktail (Sigma 8340). Protein was estimated by Bradford dye binding with a colorimetric assay (BioRad 500-0006). Total cellular protein (15 μg) was resolved on a precast 10% Tris-Hcl Criterion 18-well gel (Biorad) at 100 V (300 mAmp) for the first 15 min and later at 200 V (300 mAmp) for 1 hr. The gel was wet-transferred to a PVDF membrane for 1 hr, blocked with PBST containing 5% instant dry non-fat milk powder for 30 minutes at room temperature and incubated with anti-cMYC (9E10) mouse monoclonal antibody (Sc40, Santacruz) at 1:200. All primary and secondary antibody incubations were carried out with 5% milk powder at 4°C for overnight and 1.0 hr respectively, after which the membrane was washed with PBST for 5 minutes (×5 times). The washed blot was incubated with goat anti-mouse IgG-AP (Santa Cruz sc-2008) diluted to 1:5000 and developed with ECF reagent (GE Healthcare 9RPN-5785). The membrane was stripped using western blot stripping buffer (Pierce 21059), incubated with rabbit Anti-GAPDH (Sigma G9545) at 1:10000, washed and incubated with goat anti-rabbit IgG-AP (Santa Cruz sc-2007) at 1:5000 and developed as described above.
Osteoblast cell culture and differentiation assay
Human (hFOB1 19, ATCC CRL-11372) was purchased from ATCC and grown as recommended [26, 27]. For osteoblast differentiation assays, hFOB and MC3T3 cells were seeded separately at 80% confluence (0.8×10⁶ cells/ well) in 6-well plates with or without 50 μg/mL ascorbic acid and 10 mM β-glycerol-phosphate for 3 weeks. Media was replaced every alternate day and cells were assayed for differentiation by staining with alizarin red dye following the protocol of the manufacturer (osteogenesis assay kit, #ECM815, Millipore). Briefly the cells were fixed in 4% formalin for 10 minutes, washed 4 times with PBS and stained with alizarin red for 20 minutes, washed with PBS and imaged at 100× magnification.
Cell proliferation assay
CellTiter 96 Aqueous One Solution Cell Proliferation Assay (Promega, Madison, WI) was used according to manufacturer's instruction. Briefly, 50 μl of CellTiter 96 Aqueous One Solution Reagent was added into each well of the 24-well assay plates containing cells in 1ml of culture medium. After 1 hr of incubation, 100 μl of culture medium from each well were transferred to a white opaque 96-well plate (Falcon, BD) for measuring absorbance at 490 nm using Synergy2 microplate reader (BioTek).
Cell migration assay
24-well cell migration assay (Cultrex, Trevigen, Gaithersburg, MD) were used to investigate cell migration following the manufacturer's instructions with minor modifications. Briefly, 1 × 10⁵ cells were seeded into the top inserts after being starved in DMEM containing 0.5% FBS for 24 hrs. DMEM containing 10% FBS was added into the receiver wells to trigger cell migration. After 24 hours incubation, both top inserts and bottom receiving wells were washed with PBS, and Calcein AM/ Cell dissociation solution was added into the bottom chamber of each well. After 1 hr of incubation, top inserts were discarded and the Calcein AM /cell dissociation solution with cells detached from the bottom chamber were transferred to a black 96 well plate (Fluotrac 200, Greiner Bio-One, Monroe, NC 28110), which was then read by Synergy 2 (BioTek) at 485nm excitation, 520nm emission. Standard curves were generated to convert relative fluorescence units into cell number.
Cell invasion assay
Transwell Inserts coated with Cultrex basement membrane extract (Corning, Cat No. 3458) were used for cell invasion assay according to the instructions of manufacturer. Briefly, human osteoblasts nucleofected as mentioned elsewhere were starved in DMEM with 0.5% FBS for 24hrs before being seeded into the inserts (105 cells/insert). DMEM with 10%FBS was added into the receiver wells to promote cell invasion. After 24 hours incubation, both top inserts and bottom receiving wells were washed with PBS, and Calcein AM/ Cell dissociation solution was added into the bottom chamber of each well. After 1.0 hr of incubation, top inserts were discarded and the Calcein AM /cell dissociation solution with cells from the bottom chamber were transferred to a black plate (Fluotrac 200, Greiner Bio-One, Monroe, NC 28110), which was then read by Synergy 2 (BioTek) at 485nm excitation, 520nm emission. Standard curves were generated to convert relative fluorescence units into cell number.
DNA isolation
Genomic DNA was isolated from patient samples using Gentrapure DNA isolation kits (Qiagen, Valencia, CA) following the manufacturer's protocol.
Array Comparative Genome Hybridization
Hybridizations were performed using a Human 1Mb BAC array (HuCGH v1.1.1) (Sanger Institute, UK) (Fiegler et al., 2003), which consisted of over 3,000 clones spaced at approximately 1 Mb intervals across the entire genome, and the Agilent Human CGH 8×60K microarrays, which contain unique 60-mer oligonucleotide probes (∼50 kb resolution) and 60,000 features (Agilent Technologies). Reference DNA consisted of genomic DNA from unaffected female or male blood sample mixes (Promega). The Bioprime Labeling Kit (Invitrogen) was used to label 1 μg of tumor and reference DNA for the 1 Mb BAC array platforms with Cyanine-3-dCTP and Cyanine-5-dCTP, respectively. The probe mixture containing sex-mismatched labeled Cy3 and Cy5 probes and 135 μl (1 mg/ml) of human Cot1 DNA (Invitrogen) was precipitated at -80°C for 45 min and resuspended in 44 μl of hybridization buffer (50% deionized formamide, 2.5% dextran sulfate, 2X SSC, 0.1% Tween 20, and 0.01 mM Tris HCL, pH 8.0). The probe mixture was then denatured at 72°C for 10 min and incubated at 37°C for 1 hr. Next, the mixture was applied to the microarray for 48 hr at 37°C. Following posthybridization stringency washes, the arrays were scanned at 10 μm resolutions (using a Perkin Elmer ScanArray Express), and the fluorescence intensity at each genomic locus was quantified and used to calculate the log2 test: reference ratio for each locus on the array.
For the Agilent 8×60K human aCGH platform, 500 ng of tumor and reference DNA were labeled using the Bioprime Labeling Kit (Invitrogen) and then combined in the presence of 2 μl (1 mg/ml) of human Cot1 DNA (Invitrogen). The sex-mismatched probe mixture was then precipitated at -80°C for 45 min and resuspended in 22 μl of HPLC water, 5.5 μl of Agilent 10X blocking agent, and 27.5 μl of Agilent HI-RPM hybridization buffer. This mixture was denatured at 95°C for 5 min and incubated at 37°C for 30 min before application to the array. Hybridization was carried out for 24 hr at 65°C using an Agilent microarray hybridization chamber in a rotating oven. Arrays were washed according to the manufacturer's recommendations, air dried, and scanned at 3 μm resolution using an Agilent DNA Microarray Scanner with SureScan High resolution technology (Agilent Technologies).
DNA copy number analysis
To detect DNA copy number aberrations, using the 1 Mb aCGH platform, fluorescence intensities were quantified, threshold limits of log2 ratio values of tumor DNA to reference DNA were set as 1.5:1 (copy number gain) and 0.667:1 (copy number loss), and data were analyzed by Bluefuse for microarray software (Cambridge, UK). Bluefuse analysis was performed using the aCGH Smoothing Algorithm, which contains a clustering-based approach to identify homogenous groups of probes that define regions of gain or loss. The Agilent 8×60K arrays were assessed for data quality by the ‘Quality Metrics’ report produced in Agilent's Feature extraction software (v10.5) (Agilent Technologies). The data report from Feature Extraction was then imported into Agilent Genome Workbench Software (v5.0) (Agilent Technologies). To produce aberration calls and also assess overall array quality, an estimate of the noise was obtained by calculating the spread of the ratio differences between consecutive probes (DLRspread) along all chromosomes. The ADM-2 algorithm was then used to scan for chromosomal intervals of any length, for which the mean interval ratio was significantly different from zero and had ratios outside the threshold standard deviations. The threshold value for the ADM-2 algorithm was set 6 to 6 to reduce inherent sample noise without losing true consistent intervals along each chromosome. Also, to detect the extent of the copy number aberrations, we set the mean aberration log2 ratio thresholds at or above 0.5.
Results
miRNA profiling reveals systematic dysregulation of miRNA clusters in OS
In a comprehensive expression profiling of miRNAs from over 300 human sarcoma samples representing 22 sarcoma types [28], we identified a unique miRNA expression signature among OS cases. A cluster of miRNAs found in chromosome 14q32 locus displayed a significantly decreased expression, whereas miR-17∼92 cluster miRNAs showed increased expression in OS relative to other sarcomas. To determine whether these miRNA perturbations were a feature of OS or simply a reflection of osteogenic cells, we profiled miRNAs in normal bone (n=6) and in a second independent set of OS tumors (n=6). Unsupervised hierarchical clustering of all 1135 miRNA probes clearly distinguished normal bone profiles from OS profiles (Figure 1A). A greater than two-fold change in expression levels between normal bone and OS was observed for 36 miRNAs (p-value < 0.001) (Figure 1B). Relative to normal bone, OS samples showed a consistent downregulation (5- to 6-fold) of miRNAs from the 14q32 region and an upregulation of miR-17∼92 cluster miRNAs. We further validated these data in OS cell lines, which allowed us to address the mechanisms behind these observations. miRNA levels from Saos2, U2os and Hos cell lines showed similar trends to those observed in OS tissues (Figure 1B). Importantly, all three OS cell lines showed decreased expression of 14q32-associated miRNAs as well as increased expression of miR-17∼92 miRNAs (Figure 1B and C).
Figure 1. miRNA expression patterns in osteosarcoma.
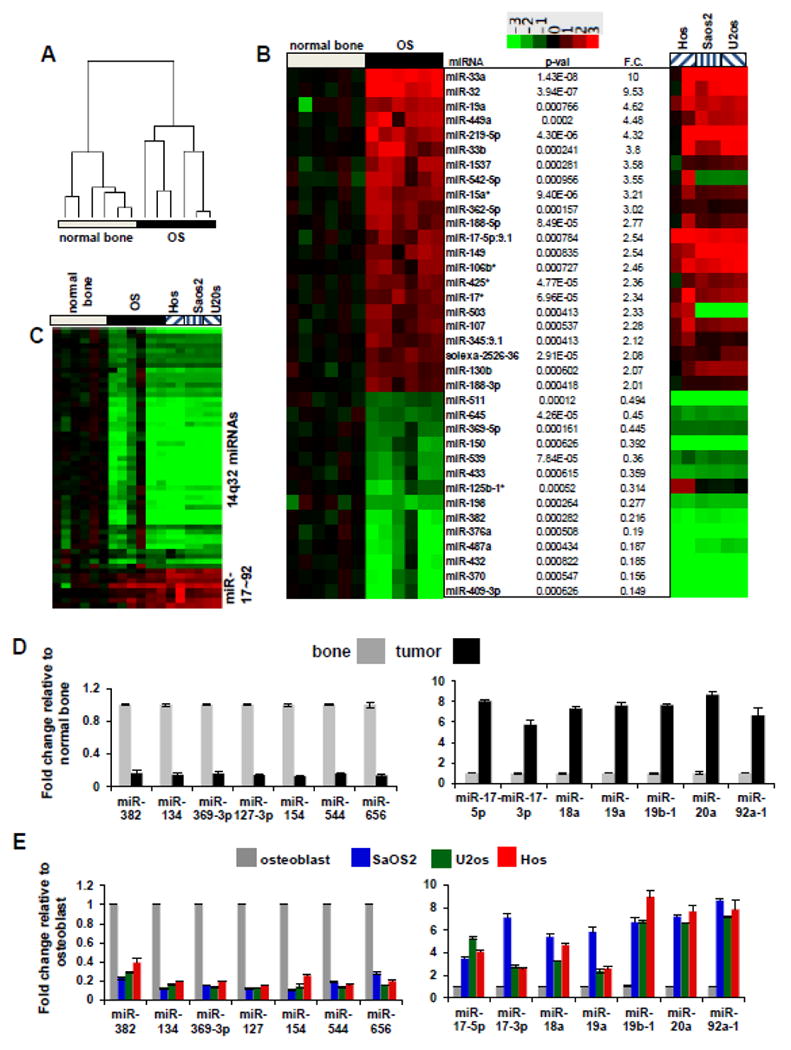
(A) Unsupervised hierarchical clustering of miRNA expression in OS relative to normal bone. Quantile normalized, mean centered and log transformed expression of differentially expressed miRNAs for all 1135 miRNAs.
(B) Differentially expressed miRNAs between normal bone tissue and OS with a greater than 2 fold change from normal bone to OS and a p-value < 0.001 by t-test. The heatmap is generated using log base 2 transformed data and untransformed fold changes (F.C.) are provided in the right text column. The miRNA expression data for the OS cell lines Hos, Saos2 and U2os relative to the expression in human osteoblasts is shown in the far right panel.
(C) miRNAs found at the 14q32 locus and the miR-17-92 showing robust decreases (14q32-associated miRNAs) and robust increases (miR-17-92) in OS patients relative to normal bone. Samples are labeled as in Figure 1B. qRT-PCR validation of miRNA profiling data in OS samples normalized to normal bone (D) and OS cell lines normalized to osteoblast (E).
Validation of 14q32 miRNAs decreases and miR-17∼92 increases in OS
To ensure that quantitative assessments could be inferred from the array data, we used qRT-PCR to examine the expression of seven of the 14q32-associated miRNAs and miR-17∼92 miRNAs in three OS samples compared with normal bone tissues (Figure 1D), and in cell lines Saos2, U2os and Hos compared with normal osteoblasts (Figure 1E). The data revealed significant differences in the expression of 14q32 cluster and miR-17∼92 cluster miRNAs, with a correlation coefficient (r2) equal to 0.71 between the array results and the qRT-PCR results (Supplementary Figure 1).
14q32 miRNAs are upregulated upon osteoblast maturation
14q32 miRNAs were downregulated in both OS patient samples and in cell lines. Normal bone tissues used for comparison includes both pre/ early and mature osteoblasts, which may influence the comparison of normal bone tissue and osteosarcoma miRNA expression. Hence we tested the levels of 14q32 miRNAs in the early and mature osteoblasts. We cultured human osteoblasts hFOB, which were allowed to differentiate by the addition of ascorbic acid and β-glycerophosphate. Three weeks after differentiation 14q32 miRNAs levels were assessed by qRT-PCR. Human preosteoblasts differentiates into mature osteoblasts and accumulate mineralized nodules, consisting of collagen and minerals of calcium and phosphorous. We confirmed the differentiation in treated osteoblast by staining with alizarin red (Figure 2A) and tested the levels of 14q32 miRNAs in these cells by qRT-PCR, along with controls. The results show that expression of 14q32 miRNAs increased up to 4 folds both in hFOB cells upon differentiation to mature osteoblasts (Figure 2B). In OS cell lines (SaOS2, U2OS and HOS) 14q32 miRNAs were downregulated (3- to 7-fold) in comparison to pre-osteoblasts (Figure 2B). Further, we determined cMYC levels in OS cell lines, pre- and differentiated- osteoblasts. cMYC levels dropped by 50 % on osteoblast differentiation (Figure 2C).
Figure 2. Expression of 14q32 miRNA levels increase during osteoblast maturation.

(A) Human hFOB cells were assayed for differentiation by staining with alizarin red dye. Note the accumulation of mineralized nodules in differentiated human osteoblasts.
(B) qRT-PCR analysis of RNA isolated from treated and control osteoblasts. 14q32 miRNAs expression is elevated upto 4 folds in differentiated human osteoblasts (p= 0.047) relative to untreated cells. OS cell lines were included to show the relative downregulation of 14q32 miRNAs in these tumor cells. Note that expression of 14q32 miRNAs are several folds lower in OS cell lines compared to osteoblasts.
(C) Relative to osteoblasts, cMYC levels are significantly higher in OS cell lines. cMYC levels dropped by ∼50% on osteoblast differentiation.
Blocking miR-17∼92 or cMYC depletion induce apoptosis in OS
miR-17∼92 is a known oncogenic miRNA cluster highly expressed in many cancer types [29]. Since the miR-17∼92 cluster miRNAs are highly expressed in OS, we examined whether knockdown of specific miRNAs in this cluster will lead to apoptosis in OS cells. In Saos2 cells, blocking the expression of miR-18a and -20b (miR-17∼92 cluster miRNAs) by anti-miRs resulted in significant apoptosis (25.5%) compared to the sham and scrambled miRNA treated controls (Figures 3A and 3B). Since miR-17∼92 is a transcriptional target of cMYC [30], we tested whether depletion of cMYC in OS cells cause apoptosis. We show that depletion of endogenous cMYC by RNAi led to 80% reduction of cMYC transcript (Figure 3C) and resulted in apoptosis of Saos2 cells (Figure 3D) that could be alleviated by Z-VAD-fmk treatment. Similarly reduction of cMYC using shRNA in another OS cell line U2os, also induced apoptosis (Supplementary Figure 2). Further, we checked the correlation between cMYC transcript levels and 14q32 miRNA expression in primary OS patient samples and in normal bone tissues by qRT-PCR. The results show that OS patients contain 2-4 fold higher levels of cMYC transcripts, relative to normal bone tissue (Figure 3E). This shows a strong negative correlation between 14q32 miRNA levels and cMYC transcripts in OS patients.
Figure 3. Depletion of miR-17∼92 or cMYC induces apoptosis in OS cells.
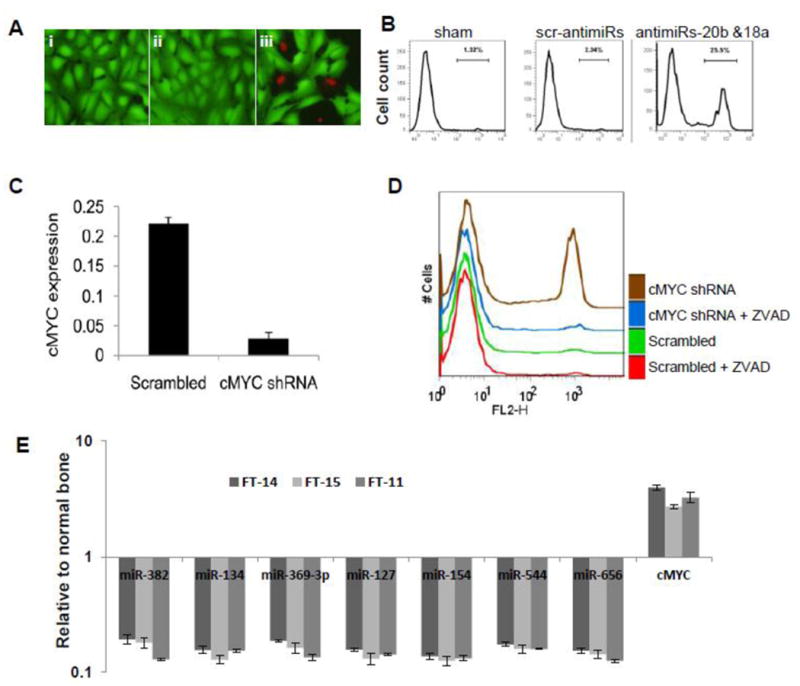
(A) miR-17∼92 cluster antagomirs induce the apoptosis of Saos2 cells. Saos2 cells were cultured with vehicle (i); with a cocktail of scrambled mimics (ii); or with a cocktail of miR-20b and miR-18a antagomirs (iii). Viability was examined by ethidium homodimer exclusion, panel A.
(B) Flow cytometric analysis of cells in panel A.
(C) cMYC levels in shRNA treated Saos2 cells normalized with GAPDH.
(D) Cell viability in cMYC-depleted Saos2 cells.
(E) Correlation between of 14q32miRNA and cMYC expression in three primary OS patients (FT-11, FT-14 and FT-15) relative to two normal bone samples (FT-405 and FT-406). qRT-PCR analysis of cMYC and 14q32 expression show a negative correlation between expression levels of these two components in normal bone and OS tissues. OS patients contain 2-4 fold higher levels of cMYC, relative to normal bone tissue
Specific 14q32 miRNAs cooperatively target cMYC
We next examined the significance and molecular role of alterations in 14q32-associated miRNAs and miR-17∼92 in OS. miR-17∼92 are transcriptionally activated by cMYC and an increase in cMYC expression is commonly observed in OS [6, 31]. Thus, we hypothesized that decreases in 14q32-associated miRNAs lead to increased levels of cMYC. To determine whether this interaction was possible, we examined whether 3′UTR of cMYC contained binding sites for any of the 14q32-associated miRNAs. This analysis identified potential binding sites for five 14q32 miRNAs (miR-544, miR-369-3p, miR-382, miR-154 and miR-134) in the cMYC 3′UTR using the microcosm [32] target prediction server at EMBL-EBI (Figure 4A) and RNA22 [33].
Figure 4. Regulation of cMYC and miR-17∼92 cluster expression by 14q32-associated miRNAs.
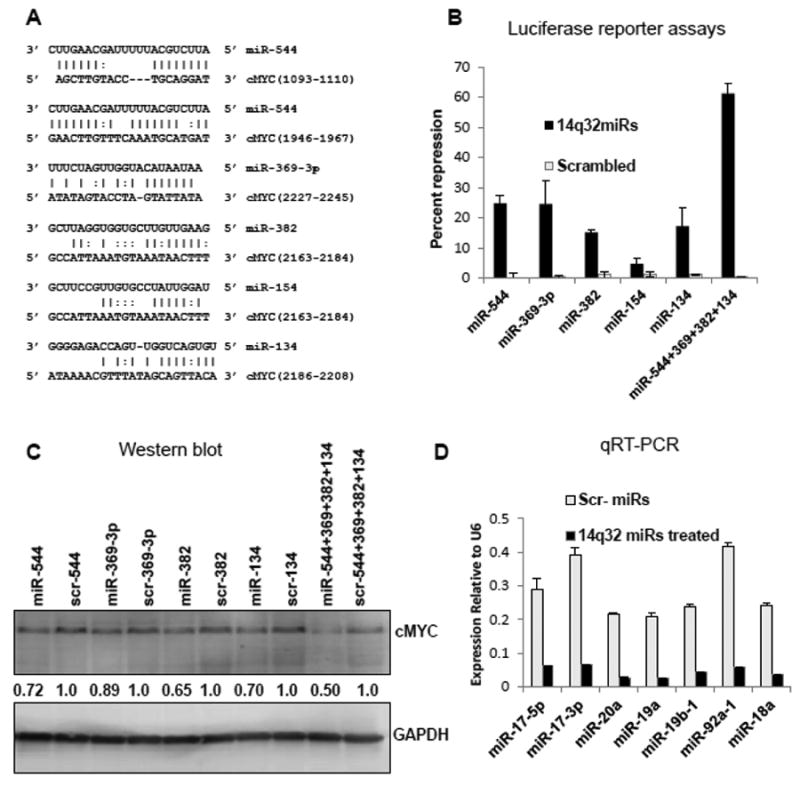
(A) 14q32 miRNA binding sites on cMYC 3′ UTR predicted by microcosm and RNA22 target-prediction programs.
(B) The cMYC 3′ UTR is targeted by miR-544, miR-369-3p, miR-382 and miR-134. HEK293 cells were transfected with a luciferase reporter construct containing the cMYC 3′UTR along with miRNA mimics or scrambled controls as indicated. Firefly luciferase activity was measured 48 hr after transfection and normalized to Renilla luciferase expression. Data show percent repression for individual miRNA mimics and for a cocktail containing equimolar concentration of miRNAs.
(C) Ectopic expression of miR-544, miR-369-3p, miR-382 and miR-134 led to the reduction of cMYC protein levels in Saos2 cells. Cells were nucleofected with miRNA mimics as indicated. After 48 hrs, cMYC levels were analyzed by western blotting. Densitometric quantification was done using ImageJ and results were normalized to GAPDH levels and to cMYC expression levels when treated with the corresponding scrambled miRNA (scr-miR).
(D) Ectopic expression of miR-544, miR-369-3p, miR-382 and miR-134 led to the repression of the miR-17∼92 cluster in Saos2 cells. Saos2 cells treated as above and expression levels of miR-17∼92 miRs were quantified 48 hrs after nucleofection.
To determine if the predicted interactions were biologically functional, 14q32 miRNAs were ectopically expressed in HEK293 cells (Supplementary Figure 3) along with a luciferase reporter construct containing the cMYC 3′UTR. The expression of 4 of the 5 14q32 miRNAs (miR-382, miR-134, miR-544 and miR-369-3p) individually suppressed luciferase expression by ∼15-20% when compared to luciferase reporter alone or scrambled controls (Figure 4B), indicating that these miRNAs conformed to the predicted destabilization of cMYC mRNA. Since miRNAs can act cooperatively to regulate cMYC [34], we examined the effect of a cocktail containing equimolar concentration of miR-382, miR-134, miR-544 and miR-369-3p on the cMYC reporter. Even though 4-fold less of each miRNA was added, the cocktail induced ∼3-fold greater suppression (61%) of cMYC than for any miRNA alone (Figure 4B), suggesting that the 14q32 miRNAs act synergistically to bind and destabilize a reporter transcript containing the cMYC 3′UTR.
Overexpression of 14q32 miRNAs lead to reduction in cMYC protein
To further establish functionality of these cMYC-targeting 14q32 miRNAs, we ectopically expressed these miRNAs in Saos2 cells. Expression levels of nucleofected mature miRNAs are shown in Supplementary Figure 3. Expression of each cMYC targeting 14q32 miRNA in Saos2 cells specifically reduced the expression of cMYC protein by 15-20% relative to its scrambled control, while the expression of all 4 cMYC targeting miRNAs as a cocktail mixture decreased cMYC protein expression by ∼50 % (Figure 4C).
Exogenous 14q32 miRNAs leads to downregulation of miR-17 ∼92 expression
These results suggested that increasing the levels of 14q32 miRNAs would decrease the expression of miR-17∼92 cluster miRNAs, since miR-17∼92 is a direct transcriptional target for cMYC. We confirmed this in 14q32 miRNA-nucleofected Saos2 cells, where each of the examined miR-17∼92 miRNAs was downregulated by ∼8- to 10-fold compared to controls (Figure 4D). Together, these data indicate that restoring the expression of 14q32 miRNAs in OS cells decreases cMYC and in turn leads to a significant reduction of miR-17∼92 miRNA levels.
14q32 miRNA overexpression induces apoptosis in OS
We next examined the mechanistic role of 14q32 miRNAs in OS. We surmised that ectopic expression of 14q32 miRNAs, with the consequent reduction of cMYC and miR-17∼92, would promote apoptosis of OS cells. Indeed, nucleofection of synthetic miR-544, miR-134, miR-382, or miR-369-3p decreased the viability of Saos2 cells by 20-25% (Figures 5A and 5B). Concurrent introduction of miR-544, miR-369-3p, miR-134, and miR-382 demonstrated a synergistic effect, resulting in over 40% cell death. Furthermore, the attenuation of this effect by the cell-permeable, competitive caspase inhibitor Z-VAD-FMK favored the notion that 14q32 miRNAs promote apoptotic cell death (Supplementary Figure 4). The effect achieved by ectopic expression of 14q32 miRNAs in Saos2 cells was also recapitulated blocking of miR-17∼92 miRNAs. These results suggested that 14q32 miRNAs have pro-apoptotic function in OS.
Figure 5. Ectopic expression of miR-544, miR-369-3p, miR-382 and miR-134 miR induce apoptosis in saos2 cells.
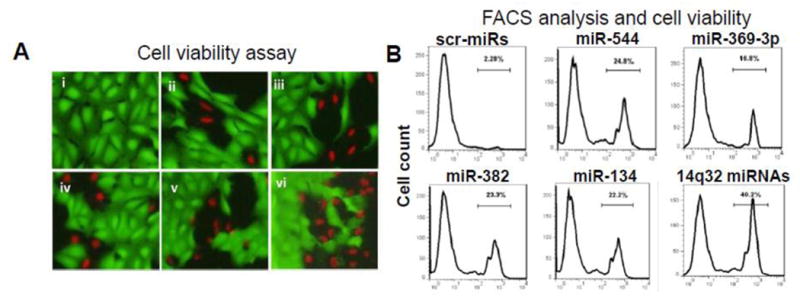
(A) Cells were nucleofected with i) a cocktail of scrambled controls; ii) miR-544; iii) miR-369-3p; iv) miR-382; v) miR-134; or vi) a cocktail of miR-544, -134, -382 and -369-3; viability was assessed 48 hrs later flow cytometry. (B) Flow cytometric analysis of cells in panel A.
cMYC rescues the pro-apoptotic effect of 14q32 miRNAs
To further address the pro-apoptotic function of 14q32 miRNAs, we carried out rescue experiments using Saos2 cells. In the first experiment, we co-expressed cMYC (without 3′UTR) along with cMYC targeting 14q32 miRNAs. Compared to control experiments, Saos2 cells expressing exogenous cMYC along with 14q32 miRNAs were rescued from the apoptotic effects of these miRNAs (Figures 6A, last panel). Cells expressing only 14q32 miRNAs showed apoptosis (40.1%) while the cells co-nucleofected with both cMYC ORF and 14q32 miRNAs showed reduced apoptosis (6.33%) at levels comparable to cells nucleofected with scrambled (3.99%) and sham (4.04%) controls. In the absence of 3′UTR of the exogenously supplied cMYC, the 14q32 miRNAs potentially suppressed the endogenous cMYC but not the exogenously supplied cMYC expression.
Figure 6. Ectopic expression of cMYC or miR-17∼92 rescues the apoptotic effects of 14q32 miRNAs in saos2 cells.
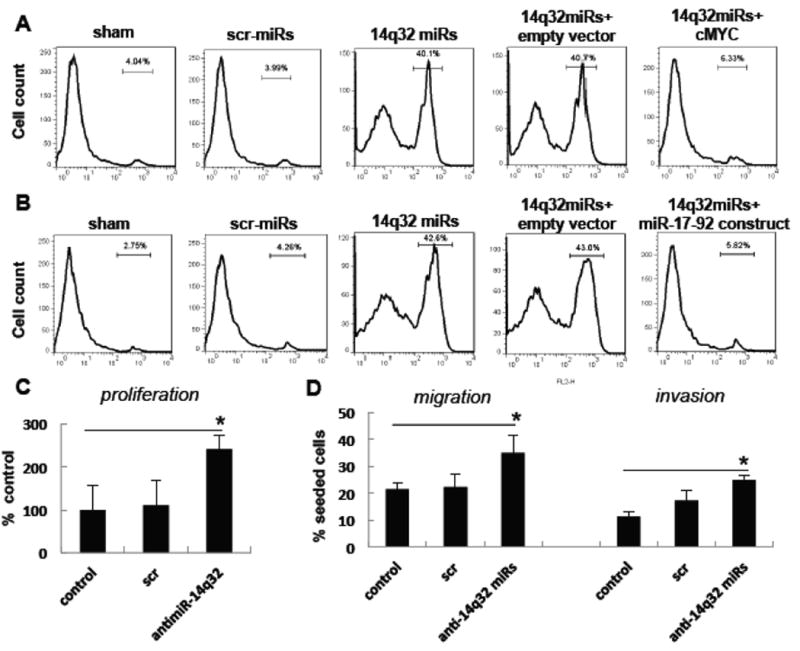
(A) Ectopic expression of cMYC cDNA (without 3′UTR) in Saos2 cells. Saos2 cells were nucleofected with a cocktail of 14q32 miRNA mimics along with either cMYC cDNA (without 3′UTR) or empty vector. Sham or scrambled miRNA (scr-miR) mimics were used as controls. These cells were subjected to FACS analysis 48 hrs after treatment.
(B) Ectopic expression of miR-17∼92 in Saos2 cells. Saos2 cells were nucleofected with a cocktail of 14q32 miRNA mimics along with either a construct expressing miR-17∼92 or empty vector. The cells were subjected to FACS analysis 48 hrs after treatment. Scrambled miRNA mimics or sham treated cells were used as controls.
(C) Blocking of 14q32miRNAs through antimiRs augments cell proliferation, invasion and migration in human osteoblasts. hFOB cells were nucleofected with 14q32 antimiRs along with scrambled antimiR controls. Cell proliferation , migration and invasion were measured 24 hrs after treatment in triplicates. Osteoblasts treated with 14q32 antimiRs show significantly increased proliferation (*p <0.005) migration (*p <0.05) and invasion (*p< 0.05) relative to scrambled antimiR treated controls.
Pro-apoptotic effects of 14q32 miRNAs are attenuated by expression of miR-17∼92
Because ectopic expression of 14q32 miRNAs in OS cells caused apoptosis and also resulted in reduction of miR-17∼92, we co-expressed miR-17∼92 and 14q32 miRNAs in Saos2 cells. Similar to above experiments, exogenous expression of miR-17∼92 reduced 14q32 miRNAs induced apoptosis significantly, compared to controls (Figure 6B, last panel). Saos2 cells nucleofected with 14q32 miRNAs alone showed 42.6% apoptosis whereas 14q32 and miR-17∼92 co-nucleofected cells had only about 5.82% apoptotic cells, which is comparable to scrambled sequences (4.26%). The rescue effects of cMYC or miR-17∼92 in Saos2 cells expressing 14q32 miRNAs suggest a direct functional interaction between these miRNAs and cMYC network. Taken together, these observations support the notion that 14q32 miRNAs are pro-apoptotic in OS and induce apoptosis through a cMYC–miR-17∼92 regulatory network. These results also indicate that the 14q32 miRNA-cMYC-miR-17∼92 miRNA network is functionally and mechanistically linked in OS and that perturbation at any point in this network can lead to apoptosis.
To further establish the functions of 14q32 miRNAs in osteoblasts, we blocked their function through antimiRs and tested the transformative potential of the osteoblast with reduced 14q32 miRNAs expression. We nuclefected the human osteoblast cells with a cocktail containing equimolar concentration of 14q32 antimiRs and various cell functions were tested through standard protocols. The results showed that blocking these miRNAs resulted in significant increase in cell proliferation, migration and invasion (Figure 6C). These experiments point out that loss of 14q32 miRNAs may induce transformation and these miRNAs have tumor suppressor functions.
No DNA copy number variations at 14q32 locus in OS
OS tumors are cytogenetically chaotic and unstable tumors, we speculated that the downregulation of 14q32 miRNAs could be due to the recurrent loss (copy number decrease) of 14q32 locus in OS. We used BAC arrays and high-density Agilent array platform to test this possibility in 14 OS tumors for which we also had miRNA expression data. With the exception of FT-10, none of the OS cases showed significant DNA copy number aberrations in 14q32 locus (Figure 7B). A representative DNA copy number change at RUNX2 gene locus in chromosome 6 is shown in Figure 7A. This result shows that the downregulation of 14q32-associated miRNAs is not due to genomic loss/deletion.
Figure 7. Copy number alternation in OS patients.
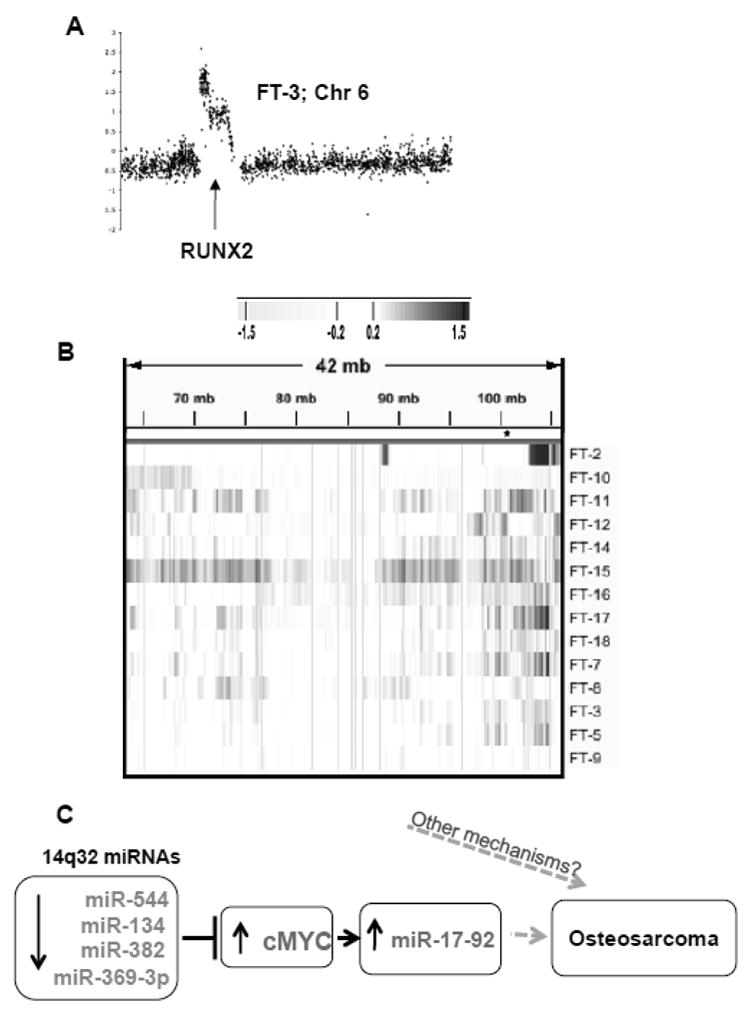
(A) aCGH profile for chromosome 6 of OS case FT-3 is shown as representative of the observed chromosomal aberrations.
(B) Except one (FT-10) all OS patients contained intact 14q32 loci which indicates that the downregulation of 14q32 miRNAs in OS is not due to the deletion or loss of this locus. Significant increases are shown in blue and decreases are shown in yellow (as determined by the ADM2 algorithm).
(C) Schematic representation of 14q32 miRNA-cMYC-miR-17∼92 gene regulatory network in OS. Downregulation of 14q32-associated miRNAs can potentially stabilize endogenous cMYC levels, leading to activation of miR-17∼92 cluster miRNAs.
Discussion
Although several genetic predisposing conditions have been associated with OS [1, 4, 10], the understanding of OS molecular etiology is limited. Altered miRNA expression has been implicated in OS chemoresistance [35], and in cell functions such as apoptosis, invasion and migration [22, 36]. Dysregulation of cMYC is an important component of OS pathogenesis. The cMYC locus is amplified in ∼30% of osteosarcomas [5-7], but the gene is overexpressed in the majority of OS cases [6, 31, 37]. The aberrant gene expression profiles noticed in OS such as overexpression of cMYC may be in part due to deregulation of microRNAs (miRNAs) and their associated gene regulatory networks. Here, we describe a novel regulatory network involving 14q32 miRNAs, cMYC and miR-17∼92 in OS. We demonstrate that 14q32 miRNAs (miR-544, miR-369-3p, miR-134 and miR-382) act cooperatively to destabilize cMYC and in turn, control expression of miR-17∼92 miRNAs (Figure 7C).
Deregulation of 14q32 miRNA network is mechanistically significant, due to the following: i) Restoration of 14q32 miRNAs (miR-544, -369-3p, -134, -382) expression or a reduction of miR-17∼92 cluster by ectopic means promotes OS cell apoptosis, ii) 14q32miRNA levels are elevated when osteoblasts undergo differentiation, and iii) blocking 14q32miRNAs increase the tumorigenic potential in osteoblasts. These findings point out that 14q32 miRNAs can work as tumor suppressors and their expression levels may poise a negative correlation to the mitotic potential of osteoblasts and hence the loss of 14q32miRNAs may be attributed as a causative factor in osteosarcomagenesis. Inverse correlation between 14q32miRNAs and cMYC observed in primary OS cases relative to normal bone supports this proposition. Previous studies have shown that in both mice and flies, a two-fold increase in cMYC levels affects cell number and size [38, 39]. Thus, the destabilization of cMYC levels could have significant consequences on the physiology of the cell. In our study, we report that reduction in cMYC levels leads to apoptosis in OS cells. Studies have shown that lowering the level of cMYC leads to apoptotic cell death [40, 41] which may be mediated by increasing p27kip1 levels [42]. Further, induction of cMYC can activate the transcription of miR-17∼92 cluster miRNAs; elevated levels of miR-17∼92 lead to aberrant cell division and escape from apoptosis [43]. We also provide evidence that stabilization of cMYC via decreased expression of 14q32 miRNAs lead to the elevated levels of miR-17∼92 clusters. Further, the apoptotic effect of overexpression of 14q32 miRNAs in Saos2 cells were attenuated by the expression of cMYC CDNA without 3′UTR or miR-17∼92 cluster, suggesting a direct functional interaction between these gene network components.
Previous studies in mice have shown that the homologous region of 14q32 cluster miRNAs is maternally expressed and related to the surrounding imprinted genes such as Dlk1, Gtl2 and Rtl1 [44, 45]. The DLK-MEG3 region is increasingly understood to be important, as it is also involved in pUPD12 and pUPD14 syndromes [46]. In humans, the corresponding DLK1-GTL2 region is presumably controlled by three differentially methylated regions [47]. MEG3, a maternally expressed gene is located upstream to the 14q32 miRNA clusters. This gene was also expressed at significantly lower levels in OS compared to normal bone (Supplementary figure 5), suggesting that a shared transcriptional mechanism may regulate the expression of genes and miRNAs at the 14q32 locus. MEG3 can activate and stabilize TP53[ 48], so it is likely that reduced MEG3 expression may jeopardize the endogenous levels of TP53 in OS.
In conclusion, we have deciphered the potential 14q32 miRNA mediated regulation of cMYC that support a role for the 14q32 miRNA-cMYC-miR-17∼92 miRNA network in OS pathobiology. Our data also support a model where decreases in 14q32 miRNA lead to increases in cMYC protein level and conseqeuntly increases in miR-17∼92. These results suggest that 14q32 decreases are necessary for apoptic escape and thus sustaining tumorigenesis in OS. DNA copy number analysis of OS patient genomes showed that decreased 14q32miRNAs expression in OS is not due to the loss or deletion of the loci and hence may involve transcriptional and or epigenetic regulation, which remains to be established. Further characterization of these networks may not only be prognostically useful, but might also provide suitable targets for the development of more effective treatment of osteosarcoma.
Supplementary Material
Highlights.
14q32 miRNAs are significantly downregulated and oncogenic miR-17-92 is upregulated in human OS
Overexpression of specific 14q32 miRNAs cooperatively targeted cMYC and repressed miR-17-92 in vitro
14q32 miRNAs are potential tumor suppressor in osteosarcoma
Functional interaction between 14q32miRs- cMYC and miR-17∼92 suggest that deregulation of this miRNA-gene regulatory network contributes to osteosarcoma pathogeneisis
Acknowledgments
Research Support: This study was supported by grant P30 CA077598 from the National Cancer Institute, by a Faculty Research and Development grant from the University of Minnesota Academic Health Center, by a translational research grant from the Masonic Cancer Center, University of Minnesota, by grants from the Wyckoff Rein in Sarcoma and Van Sloun Foundations, and by grants 2254 and 615 from the AKC Canine Health Foundation to JFM and SS.
We thank Dr. Chunsheng Chen for the excellent technical assistance, as well as Tissue Procurement Facility staff member Sarah Bowell for access to tissue samples. The authors also wish to thank Drs. Brenda Weigel, David Largaespada, Denis Clohisy, and for their support and helpful discussions throughout this study and for their careful review of the manuscript. OS cell lines were generously provided by Dr. Richard Gorlic. Finally, we wish to acknowledge the Minnesota Supercomputing Institute for providing access to computational resources.
Footnotes
Publisher's Disclaimer: This is a PDF file of an unedited manuscript that has been accepted for publication. As a service to our customers we are providing this early version of the manuscript. The manuscript will undergo copyediting, typesetting, and review of the resulting proof before it is published in its final citable form. Please note that during the production process errors may be discovered which could affect the content, and all legal disclaimers that apply to the journal pertain.
References
- 1.Kansara M, Thomas DM. Molecular pathogenesis of osteosarcoma. DNA Cell Biol. 2007;26:1–18. doi: 10.1089/dna.2006.0505. [DOI] [PubMed] [Google Scholar]
- 2.Marulanda GA, Henderson ER, Johnson DA, Letson GD, Cheong D. Orthopedic surgery options for the treatment of primary osteosarcoma. Cancer Control. 2008;15:13–20. doi: 10.1177/107327480801500103. [DOI] [PubMed] [Google Scholar]
- 3.van Dartel M, Cornelissen PW, Redeker S, Tarkkanen M, Knuutila S, Hogendoorn PC, Westerveld A, Gomes I, Bras J, Hulsebos TJ. Amplification of 17p11.2 approximately p12, including PMP22, TOP3A, and MAPK7, in high-grade osteosarcoma. Cancer Genet Cytogenet. 2002;139:91–6. doi: 10.1016/s0165-4608(02)00627-1. [DOI] [PubMed] [Google Scholar]
- 4.Lu XY, Lu Y, Zhao YJ, Jaeweon K, Kang J, Xiao-Nan L, Ge G, Meyer R, Perlaky L, Hicks J, Chintagumpala M, Cai WW, Ladanyi M, Gorlick R, Lau CC, Pati D, Sheldon M, Rao PH. Cell cycle regulator gene CDC5L, a potential target for 6p12-p21 amplicon in osteosarcoma. Mol Cancer Res. 2008;6:937–46. doi: 10.1158/1541-7786.MCR-07-2115. [DOI] [PMC free article] [PubMed] [Google Scholar]
- 5.Ueda T, Healey JH, Huvos AG, Ladanyi M. Amplification of the MYC Gene in Osteosarcoma Secondary to Paget's Disease of Bone. Sarcoma. 1997;1:131–4. doi: 10.1080/13577149778209. [DOI] [PMC free article] [PubMed] [Google Scholar]
- 6.Bogenmann E, Moghadam H, DeClerck YA, Mock A. c-myc amplification and expression in newly established human osteosarcoma cell lines. Cancer Res. 1987;47:3808–14. [PubMed] [Google Scholar]
- 7.Ikeda S, Sumii H, Akiyama K, Watanabe S, Ito S, Inoue H, Takechi H, Tanabe G, Oda T. Amplification of both c-myc and c-raf-1 oncogenes in a human osteosarcoma. Jpn J Cancer Res. 1989;80:6–9. doi: 10.1111/j.1349-7006.1989.tb02236.x. [DOI] [PMC free article] [PubMed] [Google Scholar]
- 8.Cleton-Jansen AM, Anninga JK, Briaire-de Bruijn IH, Romeo S, Oosting J, Egeler RM, Gelderblom H, Taminiau AH, Hogendoorn PC. Profiling of high-grade central osteosarcoma and its putative progenitor cells identifies tumourigenic pathways. Br J Cancer. 2009;101:1909–18. doi: 10.1038/sj.bjc.6605405. [DOI] [PMC free article] [PubMed] [Google Scholar]
- 9.Cole MD, McMahon SB. The Myc oncoprotein: a critical evaluation of transactivation and target gene regulation. Oncogene. 1999;18:2916–24. doi: 10.1038/sj.onc.1202748. [DOI] [PubMed] [Google Scholar]
- 10.Berman SD, Calo E, Landman AS, Danielian PS, Miller ES, West JC, Fonhoue BD, Caron A, Bronson R, Bouxsein ML, Mukherjee S, Lees JA. Metastatic osteosarcoma induced by inactivation of Rb and p53 in the osteoblast lineage. Proc Natl Acad Sci U S A. 2008;105:11851–6. doi: 10.1073/pnas.0805462105. [DOI] [PMC free article] [PubMed] [Google Scholar]
- 11.Feugeas O, Guriec N, Babin-Boilletot A, Marcellin L, Simon P, Babin S, Thyss A, Hofman P, Terrier P, Kalifa C, Brunat-Mentigny M, Patricot LM, Oberling F. Loss of heterozygosity of the RB gene is a poor prognostic factor in patients with osteosarcoma. J Clin Oncol. 1996;14:467–72. doi: 10.1200/JCO.1996.14.2.467. [DOI] [PubMed] [Google Scholar]
- 12.Maire G, Martin JW, Yoshimoto M, Chilton-MacNeill S, Zielenska M, Squire JA. Analysis of miRNA-gene expression-genomic profiles reveals complex mechanisms of microRNA deregulation in osteosarcoma. Cancer Genet. 204:138–46. doi: 10.1016/j.cancergen.2010.12.012. [DOI] [PubMed] [Google Scholar]
- 13.Osaki M, Takeshita F, Sugimoto Y, Kosaka N, Yamamoto Y, Yoshioka Y, Kobayashi E, Yamada T, Kawai A, Inoue T, Ito H, Oshimura M, Ochiya T. MicroRNA-143 Regulates Human Osteosarcoma Metastasis by Regulating Matrix Metalloprotease-13 Expression. Mol Ther. 19:1123–30. doi: 10.1038/mt.2011.53. [DOI] [PMC free article] [PubMed] [Google Scholar]
- 14.Ziyan W, Shuhua Y, Xiufang W, Xiaoyun L. MicroRNA-21 is involved in osteosarcoma cell invasion and migration. Med Oncol. doi: 10.1007/s12032-010-9563-7. [DOI] [PubMed] [Google Scholar]
- 15.Bartel DP. MicroRNAs: genomics, biogenesis, mechanism, and function. Cell. 2004;116:281–97. doi: 10.1016/s0092-8674(04)00045-5. [DOI] [PubMed] [Google Scholar]
- 16.Garzon R, Fabbri M, Cimmino A, Calin GA, Croce CM. MicroRNA expression and function in cancer. Trends Mol Med. 2006;12:580–7. doi: 10.1016/j.molmed.2006.10.006. [DOI] [PubMed] [Google Scholar]
- 17.Calin GA, Croce CM. MicroRNA signatures in human cancers. Nat Rev Cancer. 2006;6:857–66. doi: 10.1038/nrc1997. [DOI] [PubMed] [Google Scholar]
- 18.Croce CM. Causes and consequences of microRNA dysregulation in cancer. Nat Rev Genet. 2009;10:704–14. doi: 10.1038/nrg2634. [DOI] [PMC free article] [PubMed] [Google Scholar]
- 19.Lee YS, Dutta A. MicroRNAs in cancer. Annu Rev Pathol. 2009;4:199–227. doi: 10.1146/annurev.pathol.4.110807.092222. [DOI] [PMC free article] [PubMed] [Google Scholar]
- 20.Inose H, Ochi H, Kimura A, Fujita K, Xu R, Sato S, Iwasaki M, Sunamura S, Takeuchi Y, Fukumoto S, Saito K, Nakamura T, Siomi H, Ito H, Arai Y, Shinomiya KI, Takeda S. A microRNA regulatory mechanism of osteoblast differentiation. Proc Natl Acad Sci U S A. 2009 doi: 10.1073/pnas.0909311106. [DOI] [PMC free article] [PubMed] [Google Scholar]
- 21.Li H, Xie H, Liu W, Hu R, Huang B, Tan YF, Xu K, Sheng ZF, Zhou HD, Wu XP, Luo XH. A novel microRNA targeting HDAC5 regulates osteoblast differentiation in mice and contributes to primary osteoporosis in humans. J Clin Invest. 2009;119:3666–77. doi: 10.1172/JCI39832. [DOI] [PMC free article] [PubMed] [Google Scholar]
- 22.Zhang H, Cai X, Wang Y, Tang H, Tong D, Ji F. microRNA-143, down-regulated in osteosarcoma, promotes apoptosis and suppresses tumorigenicity by targeting Bcl-2. Oncol Rep. 2010;24:1363–9. doi: 10.3892/or_00000994. [DOI] [PubMed] [Google Scholar]
- 23.Sarver AL. Toward understanding the informatics and statistical aspects of micro-RNA profiling. J Cardiovasc Transl Res. 3:204–11. doi: 10.1007/s12265-010-9180-z. [DOI] [PubMed] [Google Scholar]
- 24.Schmittgen TD, Livak KJ. Analyzing real-time PCR data by the comparative C(T) method. Nat Protoc. 2008;3:1101–8. doi: 10.1038/nprot.2008.73. [DOI] [PubMed] [Google Scholar]
- 25.Riccardi C, Nicoletti I. Analysis of apoptosis by propidium iodide staining and flow cytometry. Nat Protoc. 2006;1:1458–61. doi: 10.1038/nprot.2006.238. [DOI] [PubMed] [Google Scholar]
- 26.Harris SA, Tau KR, Enger RJ, Toft DO, Riggs BL, Spelsberg TC. Estrogen response in the hFOB 1.19 human fetal osteoblastic cell line stably transfected with the human estrogen receptor gene. J Cell Biochem. 1995;59:193–201. doi: 10.1002/jcb.240590209. [DOI] [PubMed] [Google Scholar]
- 27.Sudo H, Kodama HA, Amagai Y, Yamamoto S, Kasai S. In vitro differentiation and calcification in a new clonal osteogenic cell line derived from newborn mouse calvaria. J Cell Biol. 1983;96:191–8. doi: 10.1083/jcb.96.1.191. [DOI] [PMC free article] [PubMed] [Google Scholar]
- 28.Sarver AL, Phalak R, Thayanithy V, Subramanian S. S-MED: sarcoma microRNA expression database. Lab Invest. 2010;90:753–61. doi: 10.1038/labinvest.2010.53. [DOI] [PubMed] [Google Scholar]
- 29.He L, Thomson JM, Hemann MT, Hernando-Monge E, Mu D, Goodson S, Powers S, Cordon-Cardo C, Lowe SW, Hannon GJ, Hammond SM. A microRNA polycistron as a potential human oncogene. Nature. 2005;435:828–33. doi: 10.1038/nature03552. [DOI] [PMC free article] [PubMed] [Google Scholar]
- 30.O'Donnell KA, Wentzel EA, Zeller KI, Dang CV, Mendell JT. c-Myc-regulated microRNAs modulate E2F1 expression. Nature. 2005;435:839–43. doi: 10.1038/nature03677. [DOI] [PubMed] [Google Scholar]
- 31.Gamberi G, Benassi MS, Bohling T, Ragazzini P, Molendini L, Sollazzo MR, Pompetti F, Merli M, Magagnoli G, Balladelli A, Picci P. C-myc and c-fos in human osteosarcoma: prognostic value of mRNA and protein expression. Oncology. 1998;55:556–63. doi: 10.1159/000011912. [DOI] [PubMed] [Google Scholar]
- 32.Griffiths-Jones S, Saini HK, van Dongen S, Enright AJ. miRBase: tools for microRNA genomics. Nucleic Acids Res. 2008;36:D154–8. doi: 10.1093/nar/gkm952. [DOI] [PMC free article] [PubMed] [Google Scholar]
- 33.Miranda KC, Huynh T, Tay Y, Ang YS, Tam WL, Thomson AM, Lim B, Rigoutsos I. A pattern-based method for the identification of MicroRNA binding sites and their corresponding heteroduplexes. Cell. 2006;126:1203–17. doi: 10.1016/j.cell.2006.07.031. [DOI] [PubMed] [Google Scholar]
- 34.Sachdeva M, Zhu S, Wu F, Wu H, Walia V, Kumar S, Elble R, Watabe K, Mo YY. p53 represses c-Myc through induction of the tumor suppressor miR-145. Proc Natl Acad Sci U S A. 2009;106:3207–12. doi: 10.1073/pnas.0808042106. [DOI] [PMC free article] [PubMed] [Google Scholar]
- 35.Song B, Wang Y, Xi Y, Kudo K, Bruheim S, Botchkina GI, Gavin E, Wan Y, Formentini A, Kornmann M, Fodstad O, Ju J. Mechanism of chemoresistance mediated by miR-140 in human osteosarcoma and colon cancer cells. Oncogene. 2009;28:4065–74. doi: 10.1038/onc.2009.274. [DOI] [PMC free article] [PubMed] [Google Scholar]
- 36.Ziyan W, Shuhua Y, Xiufang W, Xiaoyun L. MicroRNA-21 is involved in osteosarcoma cell invasion and migration. Med Oncol. 2010 doi: 10.1007/s12032-010-9563-7. [DOI] [PubMed] [Google Scholar]
- 37.Shimizu T, Ishikawa T, Sugihara E, Kuninaka S, Miyamoto T, Mabuchi Y, Matsuzaki Y, Tsunoda T, Miya F, Morioka H, Nakayama R, Kobayashi E, Toyama Y, Kawai A, Ichikawa H, Hasegawa T, Okada S, Ito T, Ikeda Y, Suda T, Saya H. c-MYC overexpression with loss of Ink4a/Arf transforms bone marrow stromal cells into osteosarcoma accompanied by loss of adipogenesis. Oncogene. 29:5687–99. doi: 10.1038/onc.2010.312. [DOI] [PubMed] [Google Scholar]
- 38.Gallant P. Myc, cell competition, and compensatory proliferation. Cancer Res. 2005;65:6485–7. doi: 10.1158/0008-5472.CAN-05-1101. [DOI] [PubMed] [Google Scholar]
- 39.Johnston LA, Gallant P. Control of growth and organ size in Drosophila. Bioessays. 2002;24:54–64. doi: 10.1002/bies.10021. [DOI] [PubMed] [Google Scholar]
- 40.Hashiramoto A, Sano H, Maekawa T, Kawahito Y, Kimura S, Kusaka Y, Wilder RL, Kato H, Kondo M, Nakajima H. C-myc antisense oligodeoxynucleotides can induce apoptosis and down-regulate Fas expression in rheumatoid synoviocytes. Arthritis Rheum. 1999;42:954–62. doi: 10.1002/1529-0131(199905)42:5<954::AID-ANR14>3.0.CO;2-J. [DOI] [PubMed] [Google Scholar]
- 41.Russo P, Arzani D, Trombino S, Falugi C. c-myc down-regulation induces apoptosis in human cancer cell lines exposed to RPR-115135 (C31H29NO4), a non-peptidomimetic farnesyltransferase inhibitor. J Pharmacol Exp Ther. 2003;304:37–47. doi: 10.1124/jpet.102.042952. [DOI] [PubMed] [Google Scholar]
- 42.D'Agnano I, Valentini A, Fornari C, Bucci B, Starace G, Felsani A, Citro G. Myc down-regulation induces apoptosis in M14 melanoma cells by increasing p27(kip1) levels. Oncogene. 2001;20:2814–25. doi: 10.1038/sj.onc.1204392. [DOI] [PubMed] [Google Scholar]
- 43.Mendell JT. miRiad roles for the miR-17-92 cluster in development and disease. Cell. 2008;133:217–22. doi: 10.1016/j.cell.2008.04.001. [DOI] [PMC free article] [PubMed] [Google Scholar]
- 44.Seitz H, Royo H, Bortolin ML, Lin SP, Ferguson-Smith AC, Cavaille J. A large imprinted microRNA gene cluster at the mouse Dlk1-Gtl2 domain. Genome Res. 2004;14:1741–8. doi: 10.1101/gr.2743304. [DOI] [PMC free article] [PubMed] [Google Scholar]
- 45.Takahashi N, Okamoto A, Kobayashi R, Shirai M, Obata Y, Ogawa H, Sotomaru Y, Kono T. Deletion of Gtl2, imprinted non-coding RNA, with its differentially methylated region induces lethal parent-origin-dependent defects in mice. Hum Mol Genet. 2009;18:1879–88. doi: 10.1093/hmg/ddp108. [DOI] [PubMed] [Google Scholar]
- 46.Hagan JP, O'Neill BL, Stewart CL, Kozlov SV, Croce CM. At least ten genes define the imprinted Dlk1-Dio3 cluster on mouse chromosome 12qF1. PLoS One. 2009;4:e4352. doi: 10.1371/journal.pone.0004352. [DOI] [PMC free article] [PubMed] [Google Scholar]
- 47.Kagami M, Sekita Y, Nishimura G, Irie M, Kato F, Okada M, Yamamori S, Kishimoto H, Nakayama M, Tanaka Y, Matsuoka K, Takahashi T, Noguchi M, Masumoto K, Utsunomiya T, Kouzan H, Komatsu Y, Ohashi H, Kurosawa K, Kosaki K, Ferguson-Smith AC, Ishino F, Ogata T. Deletions and epimutations affecting the human 14q32.2 imprinted region in individuals with paternal and maternal upd(14)-like phenotypes. Nat Genet. 2008;40:237–42. doi: 10.1038/ng.2007.56. [DOI] [PubMed] [Google Scholar]
- 48.Zhou Y, Zhong Y, Wang Y, Zhang X, Batista DL, Gejman R, Ansell PJ, Zhao J, Weng C, Klibanski A. Activation of p53 by MEG3 non-coding RNA. J Biol Chem. 2007;282:24731–42. doi: 10.1074/jbc.M702029200. [DOI] [PubMed] [Google Scholar]
Associated Data
This section collects any data citations, data availability statements, or supplementary materials included in this article.