Abstract
Articular cartilage is a low-friction, load-bearing tissue located at joint surfaces. The extracellular matrix (ECM) of cartilage consists of a fibrous collagen network, which is pre-stressed by the osmotic swelling pressure exerted by negatively charged proteoglycan aggregates embedded in the collagen network. The major proteoglycan is the bottlebrush shaped aggrecan, which forms complexes with linear hyaluronic acid chains. We quantify microscopic and macroscopic changes resulting from self-assembly between aggrecan and hyaluronic acid using a complementary set of physical measurements to determine structure and interactions by combining scattering techniques, including small-angle X-ray scattering, small-angle neutron scattering, and dynamic light scattering with macroscopic osmotic pressure measurements. It is demonstrated that the osmotic pressure that defines the load bearing ability of cartilage is primarily governed by the main macromolecular components (aggrecan and collagen) of the ECM. Knowledge of the interactions between the macromolecular components of cartilage ECM is essential to understand biological function and to develop successful tissue engineering strategies for cartilage repair.
INTRODUCTION
Cartilage is a fiber-reinforced, highly permeable polyelectrolyte gel filled with physiological salt solution.[1–3] Its unique properties originate from the architecture and organization of the extracellular matrix (ECM). Cartilage matrix is mainly composed of collagen (10 – 25 %), proteoglycans (5 – 15 %), and water (70 – 80 %). It also contains other components such as noncollagenous proteins and glycoproteins, which are present in much smaller concentrations. The triple helical collagen fibrils form a three-dimensional network. The major fibrous component is type II collagen, which provides the tensile strength of cartilage. Charged proteoglycan (PG) assemblies are imbedded in the fibrous collagen network. The major cartilage PG is the bottlebrush shaped aggrecan molecule, which interacting with hyaluronic acid (HA) and link protein forms large aggregates (size 1–4 micrometers). The negatively charged aggrecan-HA complexes are highly hydrated and they exhibit gel-like properties. The osmotic pressure exerted by the charged groups of the hydrophilic glycosaminoglycan (GAG) bristles of the aggrecan molecules leads to swelling of the PG assemblies. The swelling is constrained by the collagen network, placing it under tension. The mechanical properties of cartilage are governed by the balance of the swelling pressure of the aggrecan-HA complexes and the elastic pre-stress developed in the collagen network [4–6].
Cartilage matrix is synthesized by the chondrocytes. The volume of chondrocytes varies between 1 – 6 %. These cells ensure that cartilage functions properly by facilitating fluid exchange within the matrix, which is essential to absorb nutrients and to remove waste products [3]. Cartilage has a limited capacity for repair after damage [7,8] because there are relatively few cells in the tissue. Consequently, the metabolic rate is low, and the capacity of chondrocytes to divide and migrate in the cartilage matrix is restricted by the fibrous structure of the collagen network. Unlike other connective tissues cartilage has no blood vessels. The lack of blood flow causes slow healing. Cartilage does not contain nerve supply; therefore, it is not sensitive to early injuries.
Figure 1 shows schematically the hierarchical organization of cartilage extracellular matrix.
Figure 1.
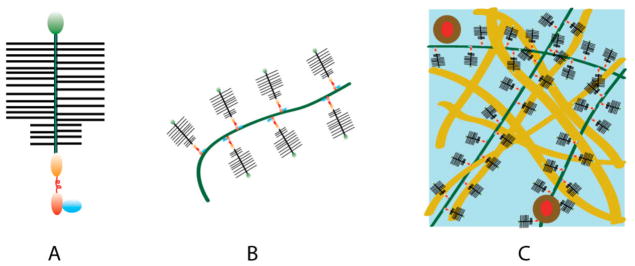
Hierarchy of cartilage excracellular matrix. (A) Aggrecan bottlebrush. (B) Aggrecan-HA complex. (C) Aggrecan-HA aggregates in the collagen matrix.
Tissue engineering methods are commonly used in biomedical engineering to study the process of cartilage formation in a controlled environment and to produce transplant material for cartilage reconstruction. The mechanical properties and composition of engineered tissues strongly depend on the culturing conditions, such as scaffold material, cell seeding density, mechanical loading [9]. Better control of the biomechanical properties of engineered cartilage is hampered by a lack of understanding of the physical chemical interactions among the constituents of the ECM.
The aim of the present work is to determine the contributions of the major macromolecular components of cartilage ECM to the osmotic properties of tissue engineered cartilage. Osmotic pressure measurements are made to obtain better insights into the effect of hydration on the macroscopic properties of solutions prepared from aggrecan, aggrecan/hyaluronic acid and hyaluronic acid. The structure of PG assemblies in near physiological salt solutions is investigated by a combination of scattering techniques (small-angle neutron scattering, small-angle X-ray scattering). The dynamic response of the components is determined by dynamic light scattering (DLS). The concentration dependence of the osmotic swelling pressure is determined for tissue-engineered cartilage at different culture times. A comparison is made between the swelling pressure of engineered cartilage samples and the osmotic pressure of model solutions made with different ratios of collagen to aggrecan.
MATERIALS AND METHODS
Solution Preparation
Aggrecan (bovine articular cartilage, Sigma), HA (Sigma-Aldrich), and aggrecan-HA solutions were prepared in 100 mM NaCl in H2O (for osmotic pressure measurements) and in D2O (for small-angle neutron scattering measurements). In the aggrecan-HA system the ratio of aggrecan to HA was set at 100 to 1. This ratio is in the range reported for aggrecan/HA complexes in cartilage [3].
Collagen (type II, from chicken sternal cartilage, Sigma-Aldrich) was first dissolved in acetic acid then neutralized. The solutions were allowed to homogenize for 2–3 days. Collagen/aggregan model solutions were prepared by mixing collagen and aggrecan at different ratios (1:2 and 1:1). The solutions contained 100 mM NaCl.
Osmotic Pressure Measurements
The osmotic pressure of the biopolymer solutions was determined as a function of concentration by bringing them to equilibrium with polyvinyl alcohol (PVA) gels of known swelling pressure [10–12]. The size of the PVA gel filaments was measured by optical microscopy in 100 mM salt solution and after equilibration in the polymer solutions (ca. 24 h). In the concentrated region (c > 0.4 w/w) osmotic pressure measurements were made by a home-built tissue osmometer described previously [13]. This apparatus measures the vapor absorption of small tissue samples (< 1 mg) tightly attached to the surface of a gold-coated piezoelectric quartz crystal sensor. The measurements are carried out in a temperature controlled sample chamber at 25 °C containing NaCl solution of known water vapor pressure. The change in resonant frequency of the quartz crystal due to sorption of water is determined from which the amount of absorbed water is calculated [13].
The swelling pressure of engineered cartilage was measured by equilibrating the samples with poly(vinyl pyrrolidone) solutions of known osmotic pressure [11]. The variation of the sample size was monitored by combining light microscopy and CCD camera together with computer imaging software. Swelling pressure measurements were made on 5 tissue samples at each culture time and the results were averaged.
All measurements were made at 25 ± 0.1 °C. The uncertain of the osmotic pressure measurements was less than +/− 10%.
Small-Angle Neutron Scattering Measurements
Small-Angle Neutron Scattering (SANS) measurements were made at the National Institute of Standards and Technology (NIST), Gaithersburg, MD, on the NG3 instrument with incident wavelength of 8 Å. The sample-detector distances used were 3 m and 13.1 m, corresponding to an explored wave vector range 0.003 Å−1 < q < 0.15 Å−1. The ambient temperature during the experiments was 25 (± 0.1 °C). The samples were prepared in D2O. Standard 2 mm NIST sample cells were used. After radial averaging, corrections for incoherent background, detector response, and cell window scattering were applied [14]. The neutron scattering intensities were calibrated using absolute intensity measurements.
Dynamic Light Scattering Measurements
Dynamic Light Scattering (DLS) measurements were performed on aggrecan, HA, and aggrecan-HA solutions with a Precision Detector - Expert Laser Light Scattering DLS Workstation equipped with a He-Ne laser (wavelength: 698 nm). The solutions were not filtered to avoid shear degradation. Five measurements were made on each solutions. The repeatability of the DLS measurements was within 1 %.
CartilageTissue Engineering
Cartilage was aseptically harvested from chick embryo sternum (16 days old) [13]. Chondrocytes were isolated by digestion with collagenase and resuspended in culture medium (DMEM containing 10% fetal bovine serum, antibiotics, and 50 μg/ml ascorbate). PVA hydrogel scaffolds were used for tissue engineering [13]. PVA disks (diameter: 25 mm, thickness: 2 mm) were swollen with the medium and seeded uniformly with chondrocytes (125 million cells per disk). The cell-laden hydrogel scaffolds were cultured under static conditions at 37 °C in a humid environment with 5% CO2 for 10, 20, or 30 days. The medium was replaced in every 1–2 days. The resulting cartilaginous tissue was used for swelling pressure measurements and analyzed biochemically to quantify the extracellular matrix components.
For biochemical assays cartilage samples were solubilized by papain digestion and analyzed to determine total sulfated glycosaminoglycan (GAG) content [15], and total collagen content (based on hydroxyproline) [16]. Measurements were made on five tissue samples at each culture time and the results were averaged. (The biochemical analysis was made by iGORi Analytical Services, Thousand Oaks, CA.)
Histology of Engineered Cartilage
After 10, 20 and 30 days culturing the tissue was fixated with 10% formalin, embedded in paraffin, and microtomed in 8-μm sections. The sections were stained with H&E to estimate the overall distribution of the components in the sample and with Alcian Blue which stains GAGs. The histology studies were performed by the American Histology Laboratories (Gaithersburg, MD).
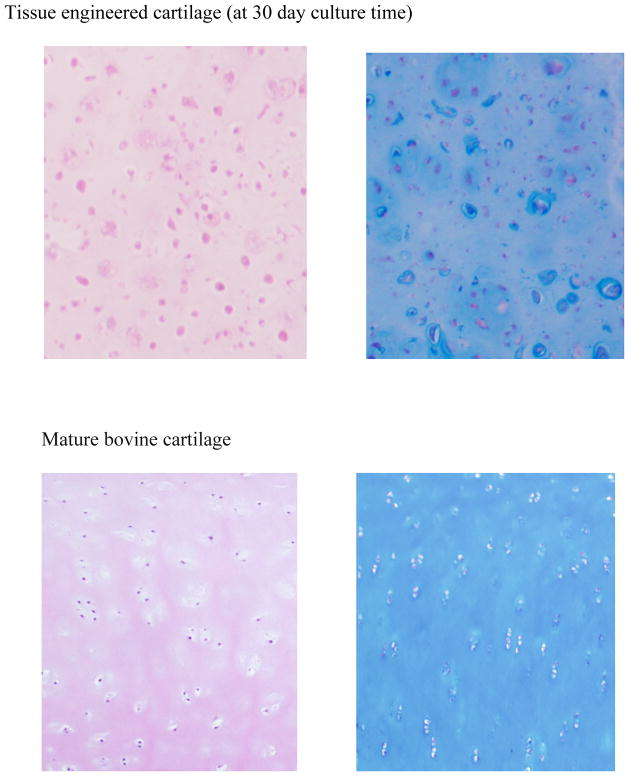
Histology performed on cartilage slices (Figure 2) illustrates that chondrocytes (cartilage cells) are dispersed in a continuous matrix.
Figure 2.
Typical histological staining of 30 days tissue engineered cartilage (upper figures) and mature, physiological cartilage (lower figures) with H&E (left) and alcian blue (right). Original magnification is 40X.
Results and Discussion
Behavior of Cartilage Polymers and their Assemblies in Solution
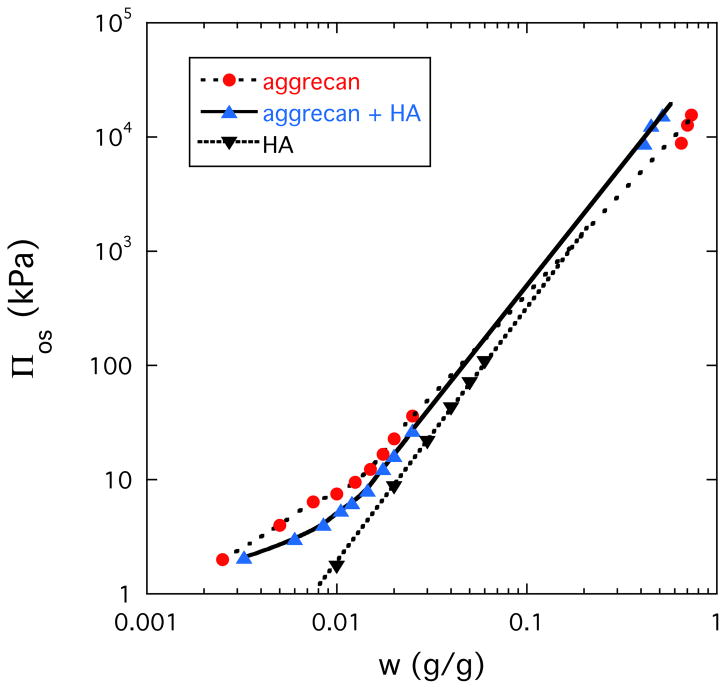
Figure 3 shows the concentration dependence of the osmotic pressure Πos for aggrecan solution (dotted line), HA solution (dashed line) and solution of aggrecan-HA complex (continuous line). In all three systems Πos strongly increases with increasing polymer concentration. At low concentration (c < 0.04 g/g) Πos is smaller in the solution of the aggrecan-HA complex than in the aggrecan solution. This is not surprising since complex formation between aggrecan and HA is expected to reduce Πos. At higher concentration (c > 0.04 g/g), however, the order is reversed. In the aggrecan-HA system the faster increase of Πos with increasing aggrecan concentration implies that the osmotic modulus K (=c∂Πos/∂c), which defines the load-bearing resistance, is enhanced by complexation. The osmotic pressure of the HA solution is smaller than that of the aggrecan-HA solution and at higher concentration merges with the aggrecan curve.
Figure 3.
Dependence of the osmotic pressure on the polymer concentration for aggrecan, aggrecan-HA and HA solutions.
To determine the consequences of complex formation on the organization of the polymer molecules in solution we made SANS and SAXS measurements. These techniques probe the structure over the q-range 0.003 Å−1 < q < 0.4 Å−1.
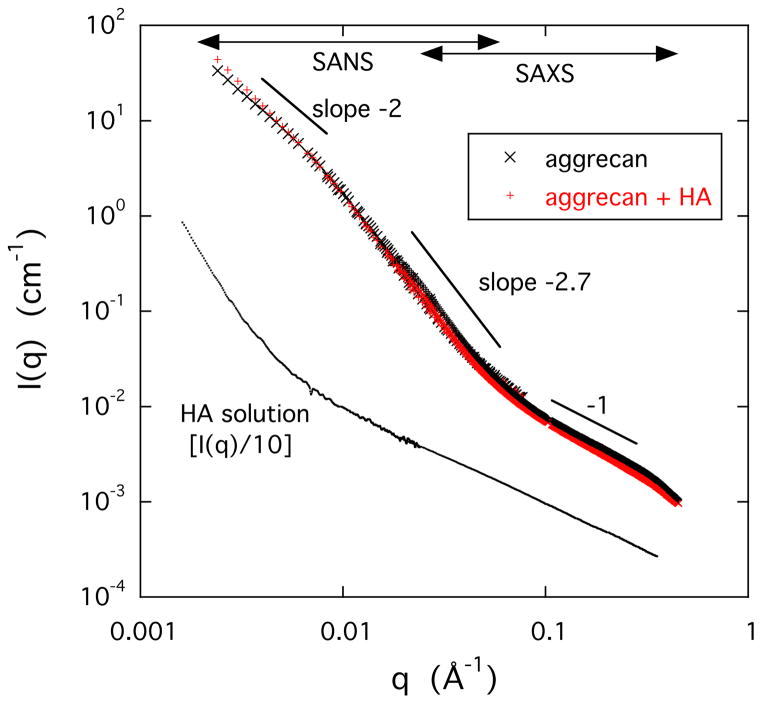
Figure 4 shows that the scattering response of the HA solution is qualitatively different from that of the two aggrecan containing samples. In the double logarithmic plot the HA solution exhibits a sharp upturn at low values of q (< 0.008 Å−1) due to the presence of loose domains of size exceeding several hundred ångströms. These are structures similar to those reported for polyelectrolyte solutions in many previous studies [17–19]. In the high q-range the slope of the I(q) plot is approximately −1, which is consistent with the rod-like geometry of the HA molecule [20].
Figure 4.
Combined SANS and SAXS scattering curves for aggrecan (0.25% w/w) and aggrecan-HA (0.25% w/w) solutions (upper curves). Lower curve shows the SAXS response of a 1% w/w HA solution. For clarity in this figure, the measured scattering intensity of the HA solution was divided by a factor of 10.
The I(q) vs q curves of the two aggrecan containing solutions are practically identical (upper curves in Figure 4) indicating that the combined scattering (SAXS + SANS) response is dominated by the aggrecan bottlebrushes. In the double logarithmic plots three regions are distinguishable. At low values of q the intensity decreases as I(q) ∝ q−2, which corresponds to scattering from branched polymers. At higher q the slope increases I(q) ∝ q−2.7, while in the highest q-region (SAXS region) I(q) ∝ q−1. The q−1 dependence is typical of linear structures implying that the bristles of the aggrecan bottlebrush exhibit extended configuration due to the electrostatic repulsive forces arising from the interaction among the negatively charged carboxyl and sufate groups.
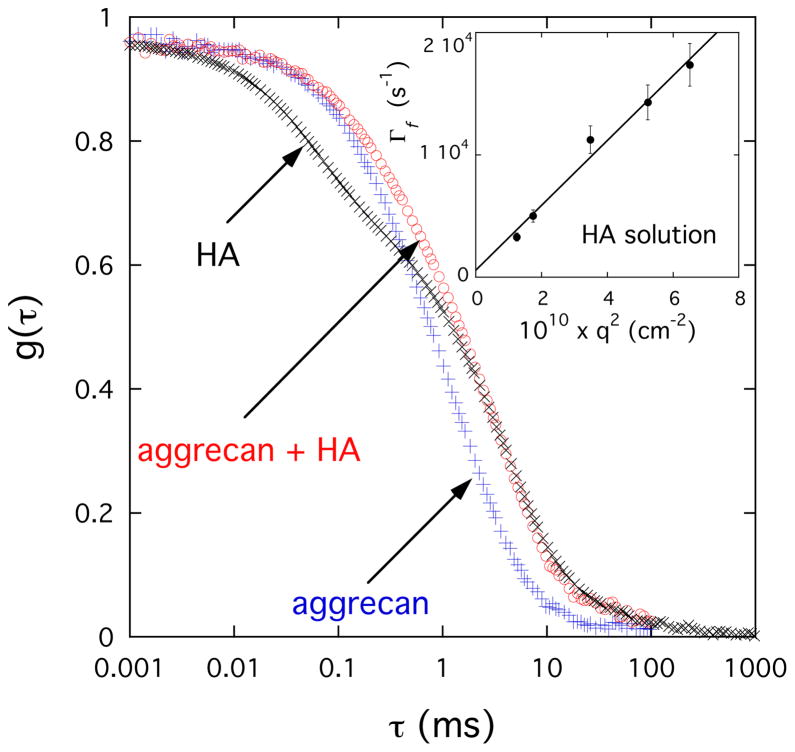
To estimate the effect of complexation on the dynamic properties of PG assemblies we made DLS measurements. In Figure 5 are shown typical DLS autocorrelation functions for solutions of HA, aggrecan, and aggrecan-HA complex measured at 150°. The g(τ) curves exhibit a wide range of relaxation times, extending from about 10−2 to 10 ms. In the HA solution two characteristic relaxation rates, separated by more than two orders of magnitude, are distinguishable. The experimental data can be analyzed by eq. 1
Figure 5.
Field correlation function g(τ) of light scattered by aggrecan (0.6% w/w), aggrecan-HA (0.6% w/w) and HA (1% w/w) solutions. The aggrecan and aggrecan-HA solutions contain 100 mM NaCl, while the HA solution in addition contains 100 mM CaCl2. Inset: variation of fast relaxation rate Γf with q2 for the HA solution.
| (1) |
where a and (1-a) are the relative intensities of the fast and slow relaxation modes respectively, and Γf and Γs are the corresponding relaxation rates. The linear relationship between Γf and q2 (inset in Figure 5) implies that the fast process is diffusive. The slow relaxation component (second term in eq 1) is due to the internal modes of large clusters obsered by SANS (see Figure 4) in the HA solution. It can be described by a stretched exponential form with μ ≈ 2/3.
The DLS response of the aggrecan and aggrecan-HA systems is remarkably different from that of the HA solution. The most striking difference is the absence of the fast relaxation mode. The autocorrelation function of the two aggrecan containing solutions resembles that of the slow mode of the HA solution, suggesting that the aggrecan bottlebrushes form large clusters even in the absence of HA. It can also be seen that the relaxation rate of the aggrecan-HA system is only slightly slower than that of the pure aggrecan solution indicating that the dynamics of the aggrecan-HA solution is only weakly influenced by the connectivity of the two components.
In summary, both osmotic pressure measurements and scattering observations indicate that (i) aggracan molecules self-assembly in near physiological salt solution, and (ii) the main role of the HA molecules is to enhance structural integrity/mechanical stability of the assemblies.
Comparison between the Osmotic Properties of Cartilage and Model Solutions
In this section we make an attempt to quantify the extent to which the main macromolecular components of cartilage extracellular matrix, aggrecan, and collagen, determine the swelling pressure of cartilage. To this end we compare the osmotic pressure of model solutions composed of different ratios of aggrecan to collagen with the swelling pressure of tissue-engineered cartilage samples.
The swelling pressure of a gel Πsw can be described as the sum of two terms: an osmotic contribution Πos that expands the network and an elastic contribution Πel that acts against expansion
| (2) |
In the fully swollen state Πsw = 0. One can study nonzero values of Πsw by equilibrating the gel with an osmotic stressing agent of known osmotic pressure, or vapor pressure [13].
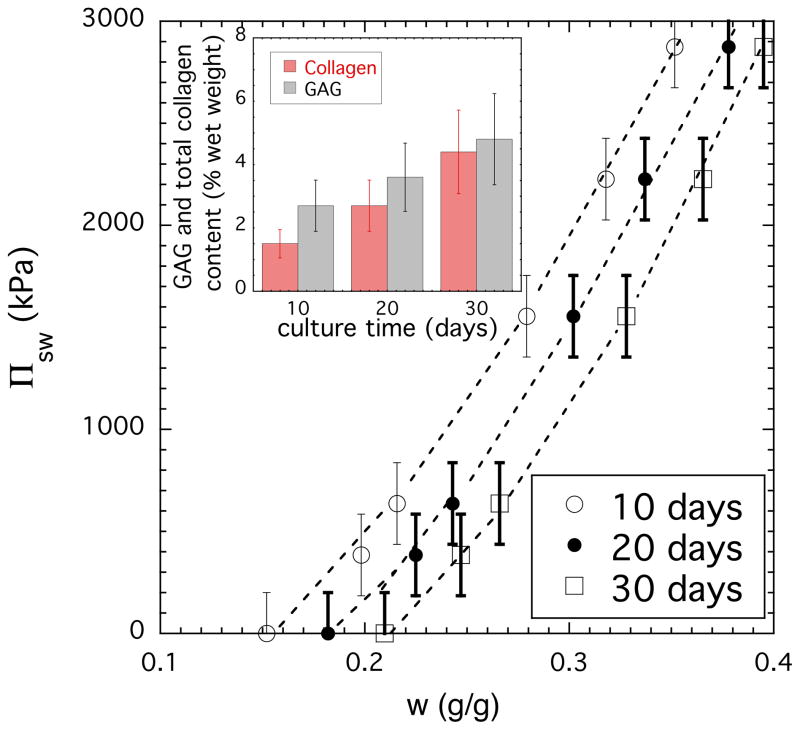
Figure 6 shows the variation of Πsw as a function of the total concentration (sum of all matrix components) for tissue engineered cartilage at three different culture times. It is apparent that the swelling of the 30-day cartilage is smaller than that of the 10-day sample indicating important changes in tissue composition. The results of biochemical analysis (inset) show that both collagen and GAG contents notably increase with culture time. (We note that the sum of collagen and GAGs is not equal to the total concentration because there are also other components in the matrix.) The relative increase of the collagen concentration is more significant than that of the GAG. Over the course of 30-day culturing process the total amount of collagen increased more than 3 times. At 10-day culture time the GAG/collagen ratio was ≈ 2., while at 30-day the GAG and collagen content was practically the same. Based on current understanding of cartilage behavior PGs generate a high swelling pressure due to the strong electrostatic repulsive forces between the negatively charged carboxyl and sulfate groups of the GAG chains and the high concentration of the counterions (Donnan osmotic pressure). PG assemblies expand against the confining collagen network to produce an osmotically prestressed system that is capable of resisting mechanical loads. Since the elastic pressure of the collagen network counteracts the osmotic pressure of the PG assemblies the faster increase of the collagen content results in a decrease of the swelling pressure.
Figure 6.
Osmotic swelling pressure Πsw vs weight fraction plots for cartilage at different culture times. The weight fraction refers to the sum of all matrix components. The inset shows the variation of the collagen and GAG components in cartilage samples.
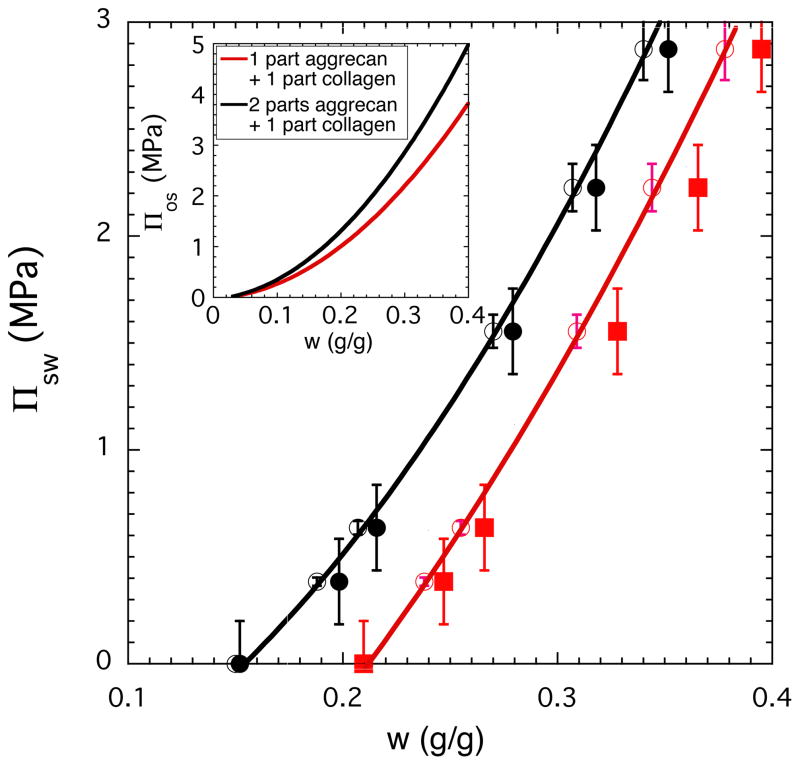
To compare Πsw of cartilage with Πos of model solutions we prepared solutions with two different aggrecan to collagen ratios (2:1 and 1:1). These ratios correspond to compositions determined by biochemical analysis for cartilage samples at 10 and 30-day culture times (see Figure 6 inset).
We note that tissue engineered matrix is not simply a combination of proteoglycans and collagen [21]. In model solutions, all constituents assemble at the same time while in tissue engineering cultures, matrix synthesis and assembly occurs over time. The amount of crosslinking between matrix components depends on culture conditions (composition of culture medium, culture time). Thus, the tissue has different composition, mechanical and osmotic properties at days 10, 20 and 30. The effect of these factors - although considered important - has not yet been established quantitatively.
To make a meaningful comparison between the osmotic properties of tissue engineered cartilage and model solutions the elastic contribution (Πel) of the collagen network must be subtracted from the measured osmotic pressure. For the fully swollen cartilage samples we estimated Πel from eq. 2 (Πel = − Πos, where Πos is the osmotic pressure of the corresponding collagen/aggrecan solution at the same concentrations). Figure 7 illustrates for the 10-day and 30-day cartilage samples that the agreement between measured and calculated swelling pressure data is reasonable. In the case of the tissue engineered cartilage the inhomogeneous matrix distribution may cause the discrepancy between results of the tissue engineered material and the model solutions. In inhomogeneous tissue, regions with lower matrix contents are present, which reduces the apparent stiffness of the construct.
Figure 7.
Comparison between the osmotic swelling pressure (Πsw) of cartilage samples (filled symbols) and the osmotic pressure (Πos) of model solutions composed of aggrecan and collagen (continuous curves and open symbols). The inset shows the concentration dependence of Πos for model solutions with two different aggrecan to collagen ratios.
In the figure is also shown the concentration dependence of Πos for the two model solutions (inset).
Conclusions
Complementary microscopic and macroscopic measurements made on aggrecan, HA, and aggrecan-HA solutions indicate that the osmotic pressure, molecular organization and dynamic response of PG assemblies are governed by the bottlebrush shaped aggrecan molecule. Aggrecan subunits spontaneously self-assemble into microgel-like assemblies in aqueous solution. Complexation with HA reinforces the aggrecan assemblies but do not affect significantly the organization of the molecules within the microgels. The dynamic behavior of aggrecan assemblies is qualitatively different from that of the HA solution. The relaxation rate of the aggrecan-HA system is slightly slower than that of the pure aggrecan solution indicating that the connectivity of the two components only weakly influences the dynamics of the aggrecan-HA complex. A comparison between Πsw of engineered cartilage and Πos of model solutions reveals that the load bearing properties of cartilage are primarily governed by the PG assemblies.
Acknowledgments
This research was supported by the Intramural Research Program of the NICHD, NIH. We acknowledge the support of the National Institute of Standards and Technology, U.S. Department of Commerce, in providing the neutron research facilities used in this work. This work utilized facilities supported in part by the National Science Foundation under Agreement No. DMR-0944772. We gratefully acknowledge the help and consultation of Dr. Boualem Hammouda (NIST) with the SANS experiment.
References
- 1.Mow VC, Zhu W, Ratcliffe A. Structure and Function of Articular Cartilage and Meniscus. In: Mow VC, Hayes WC, editors. Basic Orthopedic Biomechanics. Raven Press; New York, NY: 1991. [Google Scholar]
- 2.Mow VC, Hung CT. Biomechanics of Articular Cartilage. In: Nordin M, Frankel VH, editors. Basic Biomechanics of the Musculoskeletal System. Lippincott Williams & Wilkins; Philadelphia, PA: 2001. [Google Scholar]
- 3.Wight T, Mecham R, editors. Biology of Proteoglycans (Biology of Extracellular Matrix) Academic; New York: 1987. [Google Scholar]
- 4.Iozzo R. Proteoglycans: Structure, Biology, and Molecular Interactions. Marcel Dekker; New York: 2000. [Google Scholar]
- 5.Bae WC, Sah LR. Multi-scale Biomechanics of Articular Cartilage. In: Chien S, Chen PCY, Fung YC, editors. An Introductory Text to Bioengineering (Advanced Series in Biomechanics) Vol. 4. World Scientific Publishing Co; 2008. [Google Scholar]
- 6.Basser PJ, Schneiderman R, Bank RA, Wachtel E, Maroudas A. Arch Biochem Biophys. 1998;351:207–219. doi: 10.1006/abbi.1997.0507. [DOI] [PubMed] [Google Scholar]
- 7.Hunziker EB. Osteoarthritis Cartilage. 2002;10:432–463. doi: 10.1053/joca.2002.0801. [DOI] [PubMed] [Google Scholar]
- 8.Messner K, Gillquist J. Acta Orthop Scand. 1996;67:523–529. doi: 10.3109/17453679608996682. [DOI] [PubMed] [Google Scholar]
- 9.Kelly DJ, Crawford A, Dickinson SC, Sims TJ, Mundy J, Hollander AP, Prendergast PJ, Hatton PV. J Mater Sci: Mater Med. 2007;18:273–281. doi: 10.1007/s10856-006-0689-2. [DOI] [PubMed] [Google Scholar]
- 10.Horkay F, Zrinyi M. Macromolecules. 1982;15:815–819. [Google Scholar]
- 11.Vink H. European Polymer J. 1971;7:1411–1419. [Google Scholar]
- 12.Horkay F, Burchard W, Geissler E, Hecht AM. Macromolecules. 1993;26:129–61303. [Google Scholar]
- 13.Horkay F, Horkayne-Szakaly I, Basser PJ. Biomacromolecules. 2005;6:988–993. doi: 10.1021/bm049332c. [DOI] [PubMed] [Google Scholar]
- 14.SANS Instruments Data Acquisition Manual. Jan, 1999. NIST Cold Neutron Research Facility, NG3 and NG7 30-m. [Google Scholar]
- 15.Farndale RW, Buttle DJ, Barrett AJ. Biochim Biophys Acta. 1986;883:173–177. doi: 10.1016/0304-4165(86)90306-5. [DOI] [PubMed] [Google Scholar]
- 16.Woessner JF. Arch Biochem Biophys. 1961;93:440–447. doi: 10.1016/0003-9861(61)90291-0. [DOI] [PubMed] [Google Scholar]
- 17.Horkay F, Basser PJ, Hecht AM, Geissler E. Macromolecules. 2000;33:8329–8333. [Google Scholar]
- 18.Zhang YJ, Douglas JF, Ermi BD, Amis E. J Chem Phys. 2001;114:3299–3313. [Google Scholar]
- 19.Horkay F, Hammouda B. Colloid Polym Sci. 2008;286:611–620. [Google Scholar]
- 20.Horkay F, Basser PJ, Londono DJ, Hecht AM, Geissler EJ. Chem Phys. 2009;131:184902. doi: 10.1063/1.3262308. [DOI] [PMC free article] [PubMed] [Google Scholar]
- 21.Ng KW, Wang CCB, Mauck RL, Kelly TAN, Chahine NO, Costa KD, Ateshian GA, Hung CT. Journal of Orthopaedic Research. 2005;23:134–141. doi: 10.1016/j.orthres.2004.05.015. [DOI] [PubMed] [Google Scholar]


