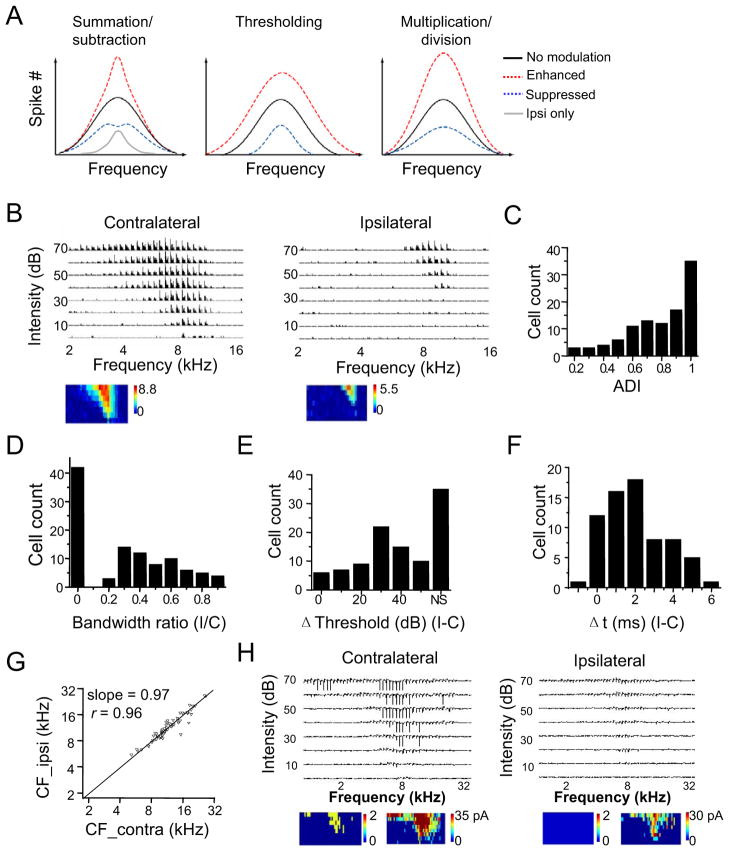
Figure 1. Monaural frequency representation of mouse ICC neurons.
(A) Three potential forms of binaural interaction. Curves shown are schematic frequency tuning curves of binaural response (spike) resulting from a summation/subtraction between ipsilateral and contralateral responses, from a thresholding effect on the contralateral response, as well as from a multiplicative scaling of the contralateral response. Black curve: binaural tuning equivalent to contralateral tuning alone. Gray curve: ipsilateral tuning alone.
(B) Spike TRFs of an example ICC neuron driven by tones presented to the contralateral and ipsilateral ear respectively. Each small trace represents a post-stimulus spike time histogram (PSTH, 10 trials) for recorded spikes within 50 ms after the tone onset, at a given frequency-intensity combination. The color map below depicts the average spike number per trial within the 50 ms window.
(C) Distribution of the aural dominance index (ADI). Cells with ADI = 1 only exhibit contralaterally evoked spike responses.
(D) Distribution of the ratio between monaural TRF bandwidths (ipsi/contra).
(E) Distribution of the intensity threshold difference between monaural TRFs (ipsi-contra). “NS” represents cells that did not show ipsilaterally evoked spike responses.
(F) Distribution of the difference between response onset latencies (ipsi-contra), measured around the best frequency and at 70 dB sound pressure level (SPL). Monaural cells are excluded.
(G) The CF of ipsilateral TRF vs. that of contralateral TRF. The black line is the best-fit linear regression line (slope = 0.97). The correlation coefficient r is marked.
(H) An example recording in which both spike and subthreshold responses were observed. Each trace is a 50 ms record. Below, color map on the left represents the spike TRF with the color representing the average spike number, and the map on the right represents the subthreshold TRF. Note that the cell had no ipsilaterally evoked spiking response, but did show ipsilaterally evoked subthreshold responses.

