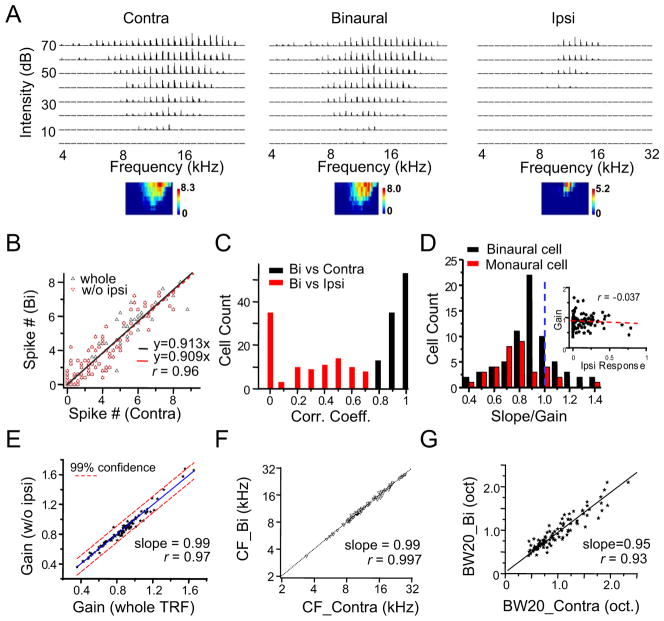
Figure 3. A gain modulation for transforming monaural into binaural response.
(A) Contralateral, binaural and ipsilateral spike TRFs of an example ICC neuron. Data presentation is the same as in Figure 1B.
(B) Binaurally evoked spike number vs. contralaterally evoked spike number under the same tone, plotted for the cell shown in (A). Whole (black), responses from the entire TRF; w/o ipsi (red), responses from the TRF region where there were no ipsilateral spiking responses. r is 0.96 for both fittings. Bootstrapped slope for the entire TRFis 0.91 ± 0.02 (mean ± SD).
(C) Distribution of correlation coefficients in the recorded population. Bin size = 0.1.
(D) Distribution of gain values. The gain is equivalent to the slope of linear fitting of binaural vs. contralateral response. Black, binaural cells; red, monaural cells. Inset, the gain value plotted as a function of the strength of the ipsilateral response (to CF tone at 60 dB SPL), which is normalized by the strength of the contralateral response.
(E) The gain measured for responses within the effective frequency-intensity region where there were no ipsilateral spiking responses plotted against that measured within the entire TRF. Black line is the best-fit linear regression line. Dash lines mark the 99% confidence interval.
(F) The CF of binaural TRF vs. that of the corresponding contralateral TRF. Dotted line is the best-fit linear regression line.
(G) The bandwidth of binaural TRF vs. that of the corresponding contralateral TRF. Bandwidth was measured at 20 dB above the intensity threshold. Black line is the best-fit linear regression line.
See also Figure S2.

