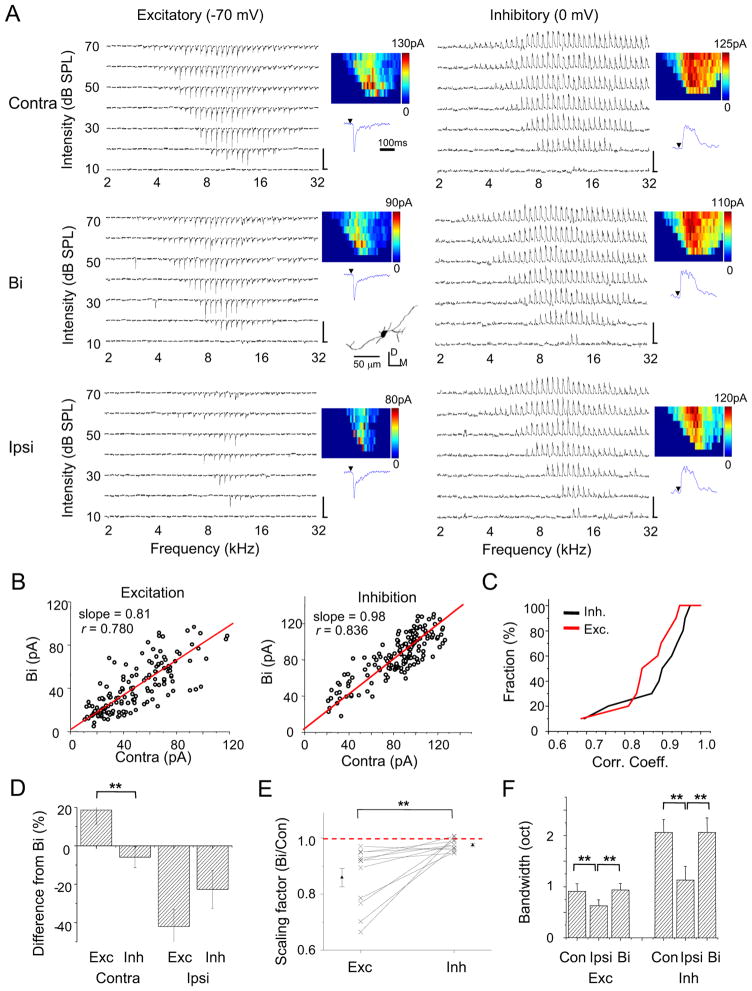
Figure 4. Synaptic inputs underlying binaural interaction.
(A) Excitatory and inhibitory synaptic TRFs of an example ICC neuron under contralateral, binaural and ipsilateral stimulation respectively. Data are displayed in the same manner as in Figure 2A. Scale: 150 pA, 350 ms. The reconstructed dendritic morphology of the recorded cell is shown in the middle inset, which is consistent with the reported disc-shaped cell (Oliver et al., 1991). D, dorsal; M, medial.
(B) Binaural synaptic response amplitude vs. the corresponding contralateral response amplitude, plotted for the cell as shown in (A). The best-fit linear regression lines are shown. Slope: 0.81 ± 0.03 for excitation; 0.98 ± 0.01 for inhibition (mean ± SD, bootstrapping).
(C) Accumulative fraction of the correlation coefficient calculated between binaural and contralateral synaptic responses.
(D) Percentage difference of contralateral and ipsilateral response amplitudes from the corresponding binaural response amplitude. Response amplitudes to tones at three frequencies centered on the best frequency and at 70 dB SPL were averaged for this analysis. Bar = SEM. **p < 0.005, paired t-test, n = 11. Similar tests and labels apply to in (E) and (F).
(E) The overall scaling factor measured for responses within the entire synaptic TRF (Bi vs. Contra). Data points for the same cell are connected with a line.
(F) Average bandwidths synaptic TRFs at 60 dB SPL.
See also Figure S3.

