Abstract
Forkhead transcription factors FoxO1/3/4 have pleiotrophic functions including anti-oxidative stress and metabolism. With regard to glucose metabolism, most studies have been focused on FoxO1. To further investigate their hepatic functions, we generated liver-specific FoxO1/3/4 knockout mice (LTKO) and examined their collective impacts on glucose homeostasis under physiological and pathological conditions. As compared to wild-type mice, LTKO mice had lower blood glucose levels under both fasting and non-fasting conditions and they manifested better glucose and pyruvate tolerance on regular chow diet. After challenged by a high-fat diet, wild-type mice developed type 2 diabetes, but LTKO mice remained euglycemic and insulin-sensitive. To understand the underlying mechanisms, we examined the roles of SIRT6 (Sirtuin 6) and Gck (glucokinase) in the FoxO-mediated glucose metabolism. Interestingly, ectopic expression of SIRT6 in the liver only reduced gluconeogenesis in wild-type but not LTKO mice whereas knockdown of Gck caused glucose intolerance in both wild-type and LTKO mice. The data suggest that both decreased gluconeogenesis and increased glycolysis may contribute to the overall glucose phenotype in the LTKO mice. Collectively, FoxO1/3/4 transcription factors play important roles in hepatic glucose homeostasis.
Introduction
Mammals have four genes encoding the O subfamily of the Forkhead transcription factors: FoxO1/3/4/6 [1,2]. Among them, FoxO1 has been extensively studied. It has been shown that FoxO1 regulates hepatic gluconeogenesis through upregulation of several key genes including phosphoenoylpyruvate carboxykinase (Pck1) and glucose 6-phosphatase (catalytic subunit, G6pc) [3–12]. Under insulin resistance conditions, FoxO1 becomes less phosphorylated at the inhibitory serine/threonine residues and therefore more active to promote expression of these gluconeogenic genes, which may contribute to hyperglycemia in diabetes [13,14]. This notion is generally supported by the data from overexpression and knockout/knockdown of FoxO1. Overexpression of the constitutively active FoxO1 mutant increases blood glucose levels and leads to impaired glucose and insulin tolerance [11,12]. In contrast, knockout or knockdown of hepatic FoxO1 lowers blood glucose levels and improves systemic insulin sensitivity in genetic or diet-induced diabetic mouse models [3,4,6,15]. Recently, two mouse genetic studies have reported inconsistent data on the roles of FoxO1 and FoxO3 in glucose metabolism [16,17]. Haeusler and colleagues have shown that a double deletion of hepatic FoxO1 and FoxO3 genes in mice has similar effects on blood glucose and glucose tolerance as compared to knockout of the FoxO1 gene alone [17]. However, Zhang and coworkers have found that FoxO1 and FoxO3 have significant additive effects on glucose homeostasis [16]. Moreover, liver-specific FoxO1/3/4 knockout mice also manifest lower serum insulin levels and better glucose tolerance as compared to control mice although animal ages are not specified in the report [17]. Additionally, FoxO6 is predominantly expressed in the brain and also has a significant role in hepatic gluconeogenesis [18,19]. However, molecular mechanisms with regard to the collective roles of FoxOs in hepatic glucose metabolism are still elusive. In this work, we attempted to examine the pathophysiological functions of FoxO1/3/4 in glucose metabolism and the underlying mechanisms.
Materials and Methods
Animals, blood chemistry, and metabolic analysis
FoxO1/3/4 floxed mice were generated and genotyped as previously described [20]. To generate liver-specific FoxO1/3/4 triple knockout mice, the floxed mice were crossed with a line of Albumin-Cre mice (Jackson Lab). Animals were maintained on a mixed genetic background (C57/BL6/129/FVB). Mice were fed either regular chow diet or a high-fat diet (HFD, 60% calories from fat, Harlan Teklad). Adenovirus injections were performed via tail vein as previously described [21]. Blood glucose levels were measured using a glucose meter (Contour from Bayer) under ad libitum (non-fasted) or overnight 16-hour fasting conditions. Plasma insulin was measured using a commercial assay kit (ALPCO). Glucose, pyruvate and insulin tolerance tests were performed as previously described [4], with 2 g glucose or pyruvate per kg body weight and 0.75-1 U insulin (humulin R, Lilly) per kg body weight, respectively. Body composition was analyzed by dual-energy X-ray absorptiometry (DEXA). As males and females had similar phenotype, only male data were presented here.
Ethics statement
All procedures were performed in accordance with the Guide for Care and Use of Laboratory Animals of the National Institutes of Health and were approved by the Institutional Animal Use and Care Committee of Indiana University School of Medicine (study 10322).
Adenovirus preparation
SIRT6 and GFP overexpression adenoviruses were prepared in an AdEasy system (Agilent) following the manufacturer’s manual. The cloning PCR primers for the human SIRT6 coding sequence are: SIRT6-forward, 5'-ACTTCCGATATCGCCACCATGTCGGTGAATTACGCGGC-3', and SIRT6-reverse, 5'-AAGGAACTCGAGGCTGGGGACCGCCTTG-3'. Gck and GFP shRNA adenoviruses were made in a BLOCK-iT system (Invitrogen). The target mRNA sequences are described in the following: mGck, 5'-GCTGGTAGAGGAGAATCTTCT-3', and GFP, 5'-GCATCAAGGTGAACTTCAAGA-3'.
Protein analysis
Liver tissue was homogenized in the lysis buffer (50 mM Hepes, pH 7.5, 150 mM NaCl, 10% Glycerol, 1% Triton X-100, 1.5 mM MgCl2, 1 mM EGTA, 10 mM Sodium Pyrophosphate, 100 mM Sodium Fluoride, and freshly added 100 µM Sodium Vanadate, 1 mM PMSF, 10 µg/ml Aprotinin, and 10 µg/ml Leupeptin). Proteins were resolved on an SDS-PAGE gel and were transferred to nitrocellulose membrane. The membrane was incubated with the following specific antibodies: SIRT6 (Sigma), Gck and Actinin (Santa Cruz Biotechnology). Protein signals were detected by incubating with HRP-conjugated secondary antibodies and subsequent ECL detection reagents (Thermo, Fisher Scientific).
RNA analysis
RNA isolation was performed using TRI reagent (Sigma) as described previously [4]. Then cDNA was synthesized using a kit (Applied Biosystems Inc.) and real-time PCR was performed using GoTaq qPCR Mix (Promega). Primer sequences of the mouse genes used in this work are described as follows: Pck1 forward 5’- AGAAGGAGTACCCATTGAG-3’, Pck1 reverse 5’- CTGAGGGCTTCATAGACA-3’; G6pc forward 5’-ATGGTCACTTCTACTCTTGC-3’, G6pc reverse 5’- CAAGATGACGTTCAAACAC-3’; Gck forward 5’- AAGGACAGGGACCTGGGTTCCA-3’, Gck reverse 5’-TCACTGGCTGACTTGGCTTGCA-3’; Pklr forward 5’-TAGGAGCACCAGCATCATTG-3’, Pklr reverse 5’- CATCCCTGCCTTGATCATCT-3’; Pdk2 forward 5’-TGTGGTGAAAGACGCCTATG-3’, Pdk2 reverse 5’-GTGGCATTGACTTCCTGGAT-3’; Ppia forward 5’-CACCGTGTTCTTCGACATCA, Ppia reverse 5’- CAGTGCTCAGAGCTCGAAAGT-3’. Real-time PCR data were presented as relative values over an internal control—Ppia.
Statistical analysis
Data were presented as means ± SEM. Two-tailed unpaired Student’s t-test was used to assess the difference between two groups, and P < 0.05 was considered as significant.
Results
Deletion of FoxO1/3/4 genes in mouse liver significantly alters glucose metabolism
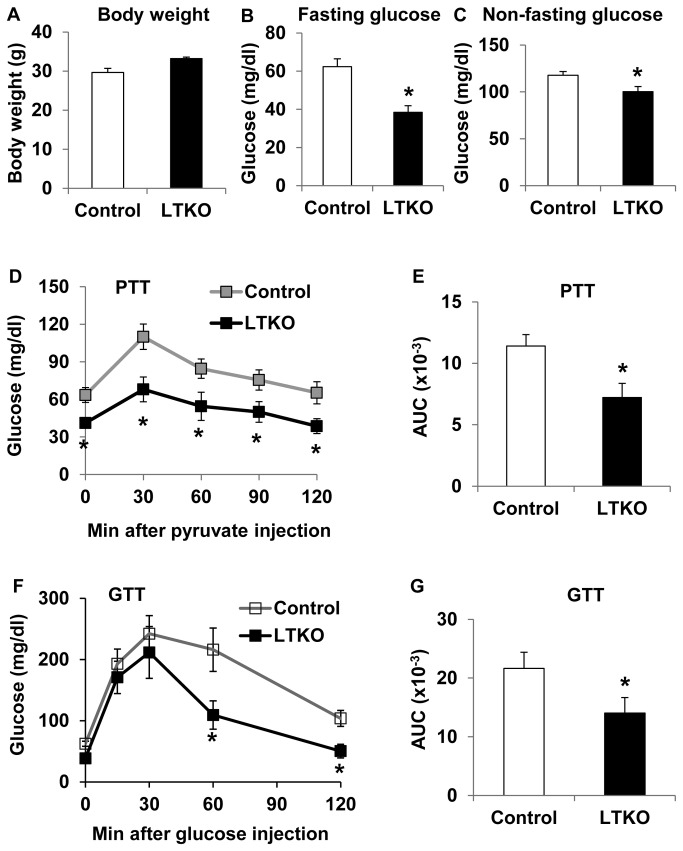
Since some previous reports have shown that FoxO1/3/4 have a significant extent of functional redundancy in vivo [16,17,20,22], here we investigated their collective roles in glucose homeostasis by deletion of all 3 genes in mouse liver (LTKO) using floxed alleleles and an Albumin-Cre transgene. Although there was no significant difference in body weight between wild-type and LTKO mice (Figure 1A), deletion of FoxO1/3/4 in the liver resulted in a decrease in blood glucose levels by 38% and 15% in male adult mice under overnight fasted and non-fasted conditions, respectively (Figure 1, B and C). Since FoxO1 has been shown to regulate hepatic gluconeogenesis [3–12,16], we examined this process in control wild-type and LTKO mice using pyruvate tolerance tests, which measure the rate of de novo glucose synthesis using pyruvate as a substrate. As expected, after the pyruvate injection, blood glucose rose to a much lower level in the LTKO mice compared to the control mice, and the area under the curve (AUC) was 37% less than that in the control mice (Figure 1, D and E). Glucose tolerance tests were also performed to assess changes in glucose disposal, and the results showed that exogenous glucose was cleared much faster in LTKO mice than that in control mice (Figure 1F). The AUC of the overall glucose tolerance was decreased by 35% in the LTKO mice (Figure 1G).
Figure 1. Glucose metabolism in the liver-specific FoxO1/3/4 knockout mice (LTKO) fed chow diet.
(A) Body weight of control and LTKO male mice (n=6) at age of 4 months. (B) Blood glucose levels in 2-month male control and LTKO mice (n=6) after an overnight 16-hour fasting. (C) Non-fasting blood glucose levels in 4-month control and LTKO male mice (n=6). (D, E) Pyruvate tolerance tests (PTT) in 4-month male control and LTKO mice (n=6-7) after an intraperitoneal injection of 2 g pyruvate solution per kg body weight. The areas under the curve (AUC) in the PTT graph were also presented. (F, G) Glucose tolerance tests (GTT) in 3-month male control and LTKO mice (n=6) after an intraperitoneal injection of 2 g glucose solution per kg body weight. The areas under the curve in the GTT graph were also presented. Data represent mean ± SEM. * indicates a significance with P<0.05 in control vs. LTKO mice.
Insulin levels are decreased in LTKO mice
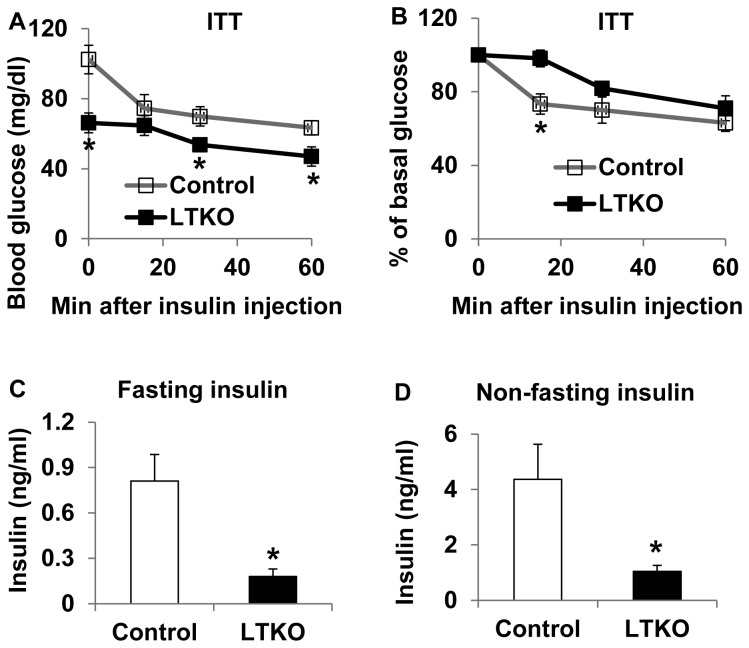
To assess insulin sensitivity, we first performed insulin tolerance tests in 3-month old mice. Since the basal blood glucose levels were already low in the LTKO mice, an exogenous insulin bolus did not reduce glucose as much as in the control wild-type mice (Figure 2A). This phenomenon could also be seen after glucose levels were normalized to the basal for the ITT data (Figure 2B). In addition, plasma insulin levels were 4 fold lower in the LTKO mice as compared to control wild-type mice under both fasting and non-fasting conditions (Figure 2, C and D).
Figure 2. Insulin sensitivity in LTKO mice fed chow diet.
(A) Insulin tolerance tests (ITT) in 3-month male control and LTKO mice (n=6) after 3-hour fasting and an intraperitoneal injection of 0.75 U human regular insulin (humulin R, Lilly) per kg body weight. (B) The data in Panel A were replotted as percentage of basal blood glucose as a function of injection time. (C) Plasma insulin levels in 4-month male control and LTKO mice (n=12) after an overnight 16-hour fasting. (D) Plasma insulin levels in 4-month male control and LTKO mice (n=6) under ad libitum conditions. Data represent mean ± SEM. * indicates a significance with P<0.05 in control vs. LTKO mice.
Hepatic deficiency of FoxO1/3/4 protects mice from developing high-fat diet-induced diabetes
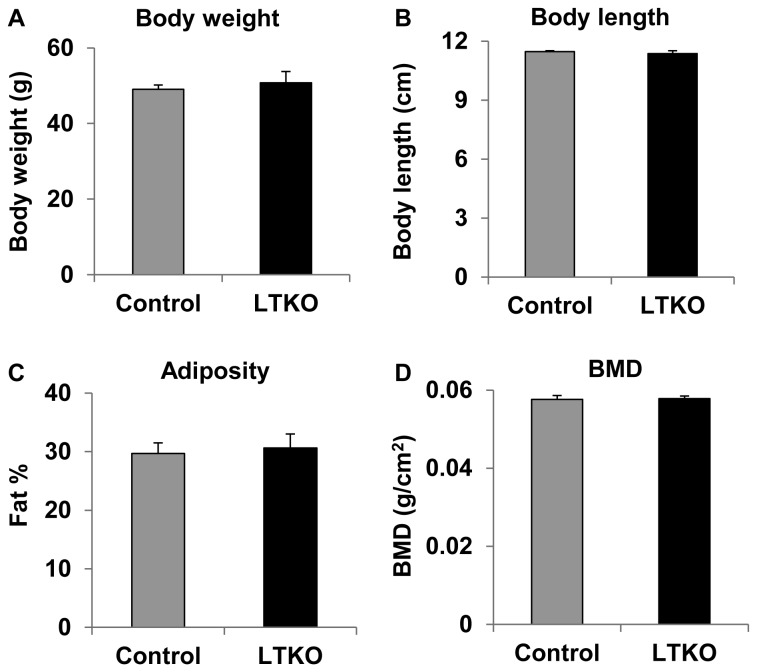
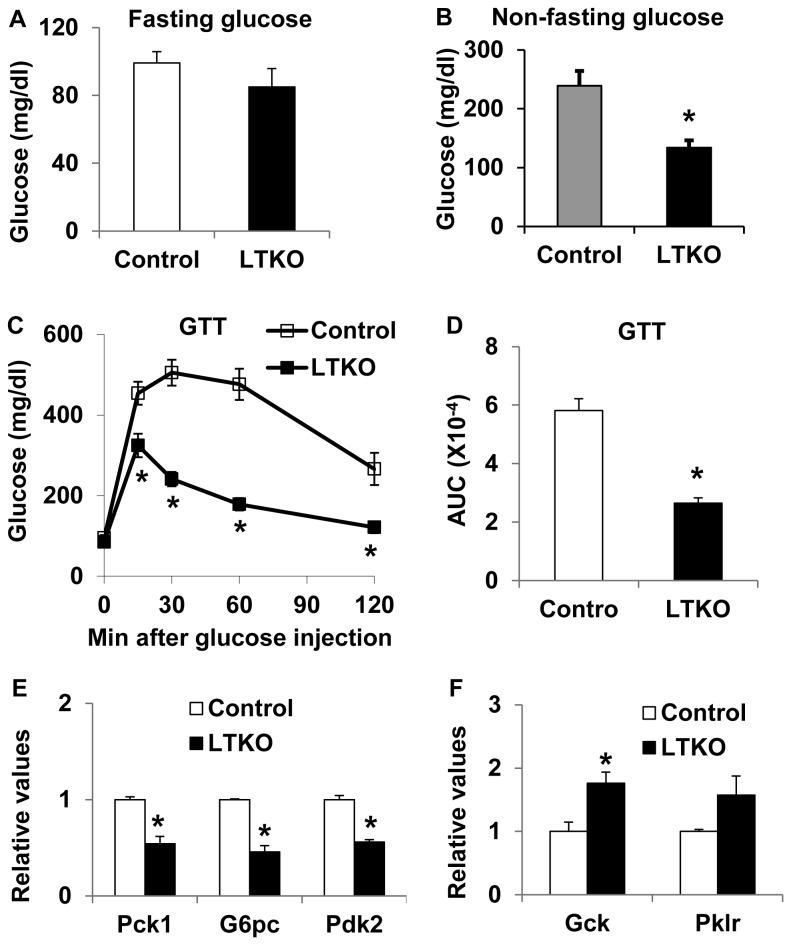
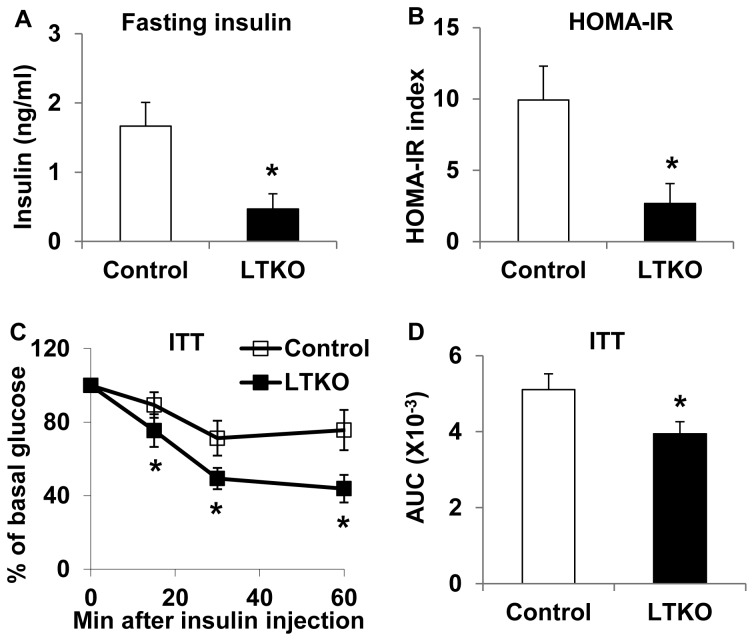
Since LTKO mice had lower glucose levels relative to wild-type mice on regular chow diet, we went on to test whether deletion of hepatic FoxO1/3/4 might protect mice from developing high-fat diet-induced diabetes. Control wild-type and LTKO mice were fed a high-fat diet (HFD) and they were subsequently monitored for up to 5 months. At the end of the HFD treatment, there was no significant difference in body composition parameters, including body weight, body length, body fat, and bone mineral density between wild-type and LTKO mice (Figure 3, A-D). As early as 3 months after the HFD treatment, the control mice developed hyperglycemia; however, the LTKO mice remained euglycemic under both fasted and non-fasted conditions (Figure 4, A and B). Systemic glucose tolerance in the LTKO mice was much better than that in the control mice during the GTT tests, and the AUC was 55% lower in the LTKO mice (Figure 4, C and D). At molecular levels, expression of gluconeogenic genes including Pck1, G6pc and Pdk2 was decreased in the LTKO livers as compared to the controls while expression of the glycolytic gene Gck went up (Figure 4, E and F). In addition, fasting insulin levels were 3-fold lower in the LTKO mice as compared to the control mice, and homeostatic model assessment (HOMA) also showed 4-fold decrease in insulin resistance in the LTKO mice (Figure 5, A and B). Moreover, LTKO mice had better insulin tolerance than the control mice and the AUC was decreased by 23% in the LTKO mice (Figure 5, C and D).
Figure 3. Body composition of LTKO mice fed a high-fat diet.
(A, B) Body weight and length measurements of control and LTKO mice (n=6) after a high-fat diet (HFD) treatment for 5 months, respectively. (C, D) Body fat and bone mineral density (BMD) analyses of the above HFD treated mice by DEXA, respectively. Data represent mean ± SEM.
Figure 4. LTKO mice maintain euglycemic and glucose tolerant on a high-fat diet.
(A) Fasting glucose levels in 4.5-month male control and LTKO mice (n=8) after the treatment with a high-fat diet for 3.5 months. (B) Non-fasting blood glucose levels in 4-month male control and LTKO mice (n=8) after the treatment with the high-fat diet for 3 months. (C, D) Glucose tolerance tests and the AUC analysis in 4.5-month male control and LTKO mice (n=8) after the treatment with the high-fat diet for 3.5 months, respectively. (E, F) Expression of genes involved in glucose metabolism was analyzed in the liver of control and LTKO mice (n=4) treated with the high-fat diet for 5 months by real-time PCR. Pck1, phosphoenoylpyruvate carboxykinase 1; G6pc, glucose-6-phosphatase, catalytic; Pdk2, pyruvate dehydrogenase kinase 2; Gck, glucokinase; Pklr, pyruvate kinase, liver and red blood cell type. Data represent mean ± SEM. * indicates a significance with P<0.05 in control vs. LTKO mice.
Figure 5. LTKO mice remain insulin-sensitive on a high-fat diet.
(A) Fasting plasma insulin levels in 6-month male control and LTKO mice (n=8) after the treatment with a high-fat diet for 5 months. (B) HOMA insulin resistance (IR) index was calculated using the fasting blood glucose and insulin data collected from control and LTKO male mice treated with the high-fat diet for 5 months. (C, D) Insulin tolerance tests and the AUC analysis in 4-month male control and LTKO mice (n=8) using a dose of 1 U insulin per kg body weight after the treatment with the high-fat diet for 3 months, respectively. Data represent mean ± SEM. * indicates a significance with P<0.05 in control vs. LTKO mice.
The role of SIRT6 in FoxOs-regulated hepatic gluconeogenesis
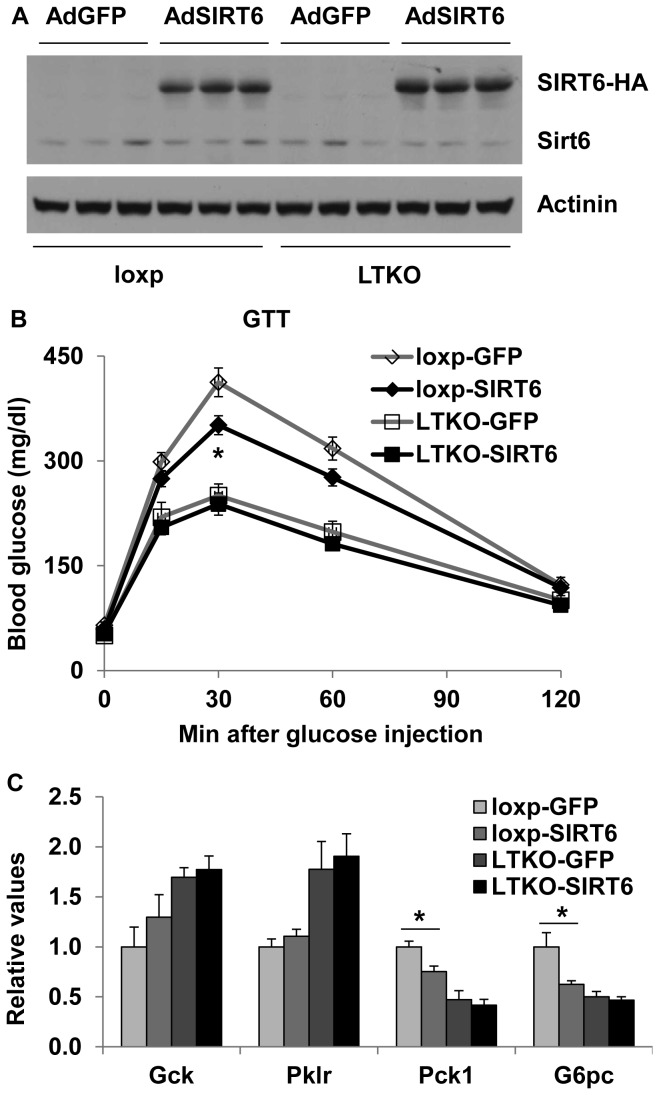
Previously, SIRT6 has been reported to suppress both hepatic glycolysis and gluconeogenesis through epigenetic regulation of the related genes such as Gck, Pklr, Pck1, and G6pc [23,24]. Here we attempted to explore whether SIRT6 might play a role in the FoxO-regulated glucose metabolism. We used adenovirus-mediated gene transfer approaches to specifically overexpress control GFP or human SIRT6 in wild-type or LTKO mouse livers (Figure 6A). Glucose tolerance tests were performed 7 days post-injection. SIRT6 overexpression improved glucose tolerance in the wild-type mice but not LTKO mice (Figure 6B), suggesting that FoxO1/3/4 may be needed for this metabolic regulation by SIRT6. Gene expression analysis revealed that gluconeogenesis (Pck1 and G6pc) but not glycolysis (Gck and Pklr) genes were suppressed by SIRT6 in the wild-type livers only (Figure 6C).
Figure 6. Sirt6 overexpression has no significant effect on glucose toerance in LTKO mice.
(A) Sirt6 overexpression was assessed by Western blot analysis in liver lysates from control and LTKO mice injected with SIRT6 or GFP adenoviruses (n=6). (B) Glucose tolerance tests in 4-month-old control and LTKO mice injected with SIRT6 or GFP adenoviruses (n=6). (C) Expression of genes involved in glucose metabolism was analyzed in the livers of SIRT6 or GFP adenovirus infected control and LTKO mice (n=6) by real-time PCR. Data represent mean ± SEM. * indicates a significance with P<0.05 between loxp-GFP and loxp-SIRT6 groups.
The role of hepatic Gck in FoxOs-modulated glucose metabolism
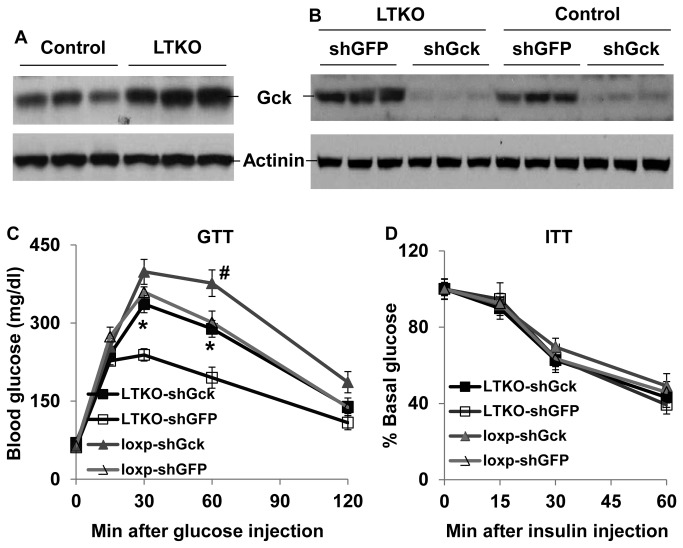
In addition to gluconeogenesis, FoxOs have been implicated in glycolysis in the liver [12,16,17,25–27]. Indeed, Western blot analysis showed that Gck protein was increased more than 2-fold in the LTKO livers (Figure 7A). To test the extent of the elevated Gck expression to glucose metabolism in LTKO mice, we knocked down hepatic Gck gene using adenovirus-mediated shRNAs (Figure 7B). Seven days post-injection, we performed glucose tolerance tests, and the results showed that knockdown of the Gck gene led to glucose intolerance in both wild-type and LTKO mice (Figure 7C). Two days later, we also performed insulin tolerance tests. No difference was observed regardless of genotypes or gene knockdown (Figure 7D). These data suggest that Gck mediated hepatic glycolysis also plays a significant role in FoxOs-regulated glucose metabolism.
Figure 7. Gck knockdown impairs glucose tolerance in both wild-type and LTKO mice.
(A) Gck protein was analyzed in the livers of 3-month-old control and LTKO mice by Western blots. (B) Gck knockdown was assessed by Western blots in liver lysates from control and LTKO mice injected with shGck or shGFP adenoviruses. (C, D) Glucose tolerance tests and insulin tolerance tests in 6-month-old male control and LTKO mice injected with shGck or shGFP adenoviruses (n=5-6), respectively. Data represent mean ± SEM. *, P<0.05 between LTKO-shGFP and LTKO-shGck groups; #, P<0.05 between loxp-shGFP and loxp-shGck groups.
Discussion
FoxO family members have been shown to regulate a number of common target genes including those involved in metabolism [3,9,13,17,20–22,28–36]. In this study, we demonstrate that combined deletion of FoxO1/3/4 exerts a strong impact on hepatic glucose metabolism. LTKO mice manifest lower blood glucose levels under both fasting and non-fasting conditions as compared to control mice. One of the major contributing factors may be the attenuated hepatic gluconeogenesis since pyruvate tolerance is much better in the LTKO mice and expression of gluconeogenic genes including Pck1, G6pc, and Pdk2 is lower in the LTKO livers as compared to controls. Additionally, while there is no significant alteration in Pklr gene expression, Gck gene expression is significantly increased in the LTKO mice. Remarkably, knockdown of hepatic Gck gene reduces glucose tolerance in the LTKO mice. These data suggest that increased glycolysis also significantly contributes to the rapid glucose clearance in hepatic FoxO1/3/4 deficient mice. This conclusion is consistent with previous reports using liver-specific Gck transgenic and knockout mice [37–42]. Although an increase of the Gck gene copy may protect mice from developing severe diabetes [43], long-term overexpression of Gck in the liver also causes fatty liver and insulin resistance [44]. With regard to LTKO mice, although they have better insulin sensitivity after 5 months of high-fat treatment, those mice also developed hepatic steatosis as we previously reported [22]. Thus, it is likely that LTKO mice may eventually develop insulin resistance under obesity-prone conditions.
It is also possible that FoxOs may regulate glucose metabolism through their impact on insulin signaling. Previously, it has been shown that constitutively nuclear FoxO1 mutant can enhance Akt (S473) phosphorylation through suppression of the inhibitory pseudokinase Trib3 gene expression [45]. However, no differences in Trib3 gene expression and insulin-stimulated Akt (S473) phosphorylation are observed between control and LTKO livers (data not shown), raising a question as to whether Trib3 is involved in the FoxO-regulated glucose metabolism.
Recently, Sirt6 has been implicated in the regulation of hepatic glycolysis and gluconeogenesis [24]. Although expression of Gck and Pklr genes has been shown to be upregulated in the liver of hepatic Sirt6 knockout mice [24], overexpression of Sirt6 does not suppress Gck and Pklr gene expression in either wild-type or LTKO livers. This suggests that additional factors may be needed to achieve the suppression of glycolytic genes. Nevertheless, Sirt6 overexpression reduces gluconeogenic gene expression in the liver of wild-type but not LTKO mice, implying that Sirt6 might coordinate with FoxOs in the regulation of gluconeogenesis. PGC-1α, a target gene of FoxO1 and also a coactivator of FoxO1, has been shown to be regulated by SIRT6 through control of the GCN5 acetyltransferase activity [23]. Thus, it is possible that SIRT6 modulates hepatic gluconeogenesis through both PGC-1α and FoxO1.
Significantly, LTKO mice remain euglycemic and insulin-sensitive on high-fat diet for at least 5 months in this study. This phenotype is consistent with a previous report that hepatic deletion of FoxO1 and FoxO3 also improves glucose and insulin tolerance in diabetic db/db mice [16]. Also individually, FoxO1 and FoxO6 have been shown to exert significant impact on glucose metabolism, particularly on hepatic gluconeogenesis. Overexpression of FoxO1 or FoxO6 in mouse liver causes elevated fasting blood glucose levels and impaired glucose tolerance [11,12,19]. Conversely, knockdown or knockout of hepatic FoxO1 or FoxO6 improves glucose homeostasis in some diabetic mouse models [3,4,6,15,19]. Hepatic FoxO1/3/4 knockout mice have been previously shown to develop hypoglycemia at postnatal and adult ages [17]. In that report, the authors have also found that expression of Pck1 is significantly decreased and Gck is increased [17]. In our study, we have investigated the potential mechanisms that lead to altered glucose metabolism upon hepatic deletion of FoxO1/3/4 genes. We have observed that in addition to Pck1, other genes such as G6pc and Pdk2 are also significantly downregulated in the LTKO liver. Our high-fat diet study further confirms that ablation of hepatic FoxOs can protect animals from developing hyperglycemia. More importantly, our mechanistic studies using liver-specific Gck gene knockdown and Sirt6 overexpression reveal that both are involved in FoxOs-regulated glucose metabolism. Taken together, our findings suggest an important role of FoxO1/3/4 in the regulation of glucose metabolism under physiological conditions and a potential implication in the pathogenesis of diabetes.
Funding Statement
This work was supported by the National Institute of Diabetes And Digestive And Kidney Diseases grant R00DK077505 (to XCD). The funders had no role in study design, data collection and analysis, decision to publish, or presentation of the manuscript.
References
- 1. Arden KC (2008) FOXO animal models reveal a variety of diverse roles for FOXO transcription factors. Oncogene 27: 2345-2350. doi:10.1038/onc.2008.27. PubMed: 18391976. [DOI] [PubMed] [Google Scholar]
- 2. Calnan DR, Brunet A (2008) The FoxO code. Oncogene 27: 2276-2288. doi:10.1038/onc.2008.21. PubMed: 18391970. [DOI] [PubMed] [Google Scholar]
- 3. Altomonte J, Richter A, Harbaran S, Suriawinata J, Nakae J et al. (2003) Inhibition of Foxo1 function is associated with improved fasting glycemia in diabetic mice. Am J Physiol Endocrinol Metab 285: E718-E728. PubMed: 12783775. [DOI] [PubMed] [Google Scholar]
- 4. Dong XC, Copps KD, Guo S, Li Y, Kollipara R et al. (2008) Inactivation of hepatic Foxo1 by insulin signaling is required for adaptive nutrient homeostasis and endocrine growth regulation. Cell Metab 8: 65-76. doi:10.1016/j.cmet.2008.06.006. PubMed: 18590693. [DOI] [PMC free article] [PubMed] [Google Scholar]
- 5. Liu Y, Dentin R, Chen D, Hedrick S, Ravnskjaer K, et al. (2008) A fasting inducible switch modulates gluconeogenesis via activator/coactivator exchange. Nature 456: 269-273. [DOI] [PMC free article] [PubMed] [Google Scholar]
- 6. Matsumoto M, Pocai A, Rossetti L, Depinho RA, Accili D (2007) Impaired regulation of hepatic glucose production in mice lacking the forkhead transcription factor Foxo1 in liver. Cell Metab 6: 208-216. doi:10.1016/j.cmet.2007.08.006. PubMed: 17767907. [DOI] [PubMed] [Google Scholar]
- 7. Naïmi M, Gautier N, Chaussade C, Valverde AM, Accili D et al. (2007) Nuclear forkhead box O1 controls and integrates key signaling pathways in hepatocytes. Endocrinology 148: 2424-2434. doi:10.1210/en.2006-1411. PubMed: 17303659. [DOI] [PubMed] [Google Scholar]
- 8. Nakae J, Kitamura T, Ogawa W, Kasuga M, Accili D (2001) Insulin regulation of gene expression through the forkhead transcription factor Foxo1 (Fkhr) requires kinases distinct from Akt. Biochemistry 40: 11768-11776. doi:10.1021/bi015532m. PubMed: 11570877. [DOI] [PubMed] [Google Scholar]
- 9. Onuma H, Vander Kooi BT, Boustead JN, Oeser JK, O’Brien RM (2006) Correlation between FOXO1a (FKHR) and FOXO3a (FKHRL1) binding and the inhibition of basal glucose-6-phosphatase catalytic subunit gene transcription by insulin. Mol Endocrinol 20: 2831-2847. doi:10.1210/me.2006-0085. PubMed: 16840535. [DOI] [PubMed] [Google Scholar]
- 10. Puigserver P, Rhee J, Donovan J, Walkey CJ, Yoon JC et al. (2003) Insulin-regulated hepatic gluconeogenesis through FOXO1-PGC-1alpha interaction. Nature 423: 550-555. doi:10.1038/nature01667. PubMed: 12754525. [DOI] [PubMed] [Google Scholar]
- 11. Qu S, Altomonte J, Perdomo G, He J, Fan Y et al. (2006) Aberrant Forkhead box O1 function is associated with impaired hepatic metabolism. Endocrinology 147: 5641-5652. doi:10.1210/en.2006-0541. PubMed: 16997836. [DOI] [PMC free article] [PubMed] [Google Scholar]
- 12. Zhang W, Patil S, Chauhan B, Guo S, Powell DR et al. (2006) FoxO1 regulates multiple metabolic pathways in the liver: effects on gluconeogenic, glycolytic, and lipogenic gene expression. J Biol Chem 281: 10105-10117. doi:10.1074/jbc.M600272200. PubMed: 16492665. [DOI] [PubMed] [Google Scholar]
- 13. Barthel A, Schmoll D, Unterman TG (2005) FoxO proteins in insulin action and metabolism. Trends Endocrinol Metab 16: 183-189. doi:10.1016/j.tem.2005.03.010. PubMed: 15860415. [DOI] [PubMed] [Google Scholar]
- 14. Gross DN, van den Heuvel AP, Birnbaum MJ (2008) The role of FoxO in the regulation of metabolism. Oncogene 27: 2320-2336. doi:10.1038/onc.2008.25. PubMed: 18391974. [DOI] [PubMed] [Google Scholar]
- 15. Samuel VT, Choi CS, Phillips TG, Romanelli AJ, Geisler JG et al. (2006) Targeting foxo1 in mice using antisense oligonucleotide improves hepatic and peripheral insulin action. Diabetes 55: 2042-2050. doi:10.2337/db05-0705. PubMed: 16804074. [DOI] [PubMed] [Google Scholar]
- 16. Zhang K, Li L, Qi Y, Zhu X, Gan B et al. (2012) Hepatic suppression of Foxo1 and Foxo3 causes hypoglycemia and hyperlipidemia in mice. Endocrinology 153: 631-646. doi:10.1210/en.2011-1527. PubMed: 22147007. [DOI] [PMC free article] [PubMed] [Google Scholar]
- 17. Haeusler RA, Kaestner KH, Accili D (2010) FoxOs function synergistically to promote glucose production. J Biol Chem 285: 35245-35248. doi:10.1074/jbc.C110.175851. PubMed: 20880840. [DOI] [PMC free article] [PubMed] [Google Scholar]
- 18. Jacobs FM, van der Heide LP, Wijchers PJ, Burbach JP, Hoekman MF et al. (2003) FoxO6, a novel member of the FoxO class of transcription factors with distinct shuttling dynamics. J Biol Chem 278: 35959-35967. doi:10.1074/jbc.M302804200. PubMed: 12857750. [DOI] [PubMed] [Google Scholar]
- 19. Kim DH, Perdomo G, Zhang T, Slusher S, Lee S et al. (2011) FoxO6 integrates insulin signaling with gluconeogenesis in the liver. Diabetes 60: 2763-2774. doi:10.2337/db11-0548. PubMed: 21940782. [DOI] [PMC free article] [PubMed] [Google Scholar]
- 20. Paik JH, Kollipara R, Chu G, Ji H, Xiao Y et al. (2007) FoxOs are lineage-restricted redundant tumor suppressors and regulate endothelial cell homeostasis. Cell 128: 309-323. doi:10.1016/j.cell.2006.12.029. PubMed: 17254969. [DOI] [PMC free article] [PubMed] [Google Scholar]
- 21. Xiong X, Tao R, DePinho RA, Dong XC (2012) The autophagy-related gene 14 (Atg14) is regulated by forkhead box O transcription factors and circadian rhythms and plays a critical role in hepatic autophagy and lipid metabolism. J Biol Chem 287: 39107-39114. doi:10.1074/jbc.M112.412569. PubMed: 22992773. [DOI] [PMC free article] [PubMed] [Google Scholar]
- 22. Tao R, Wei D, Gao H, Liu Y, DePinho RA et al. (2011) Hepatic FoxOs regulate lipid metabolism via modulation of expression of the nicotinamide phosphoribosyltransferase gene. J Biol Chem 286: 14681-14690. doi:10.1074/jbc.M110.201061. PubMed: 21388966. [DOI] [PMC free article] [PubMed] [Google Scholar]
- 23. Dominy JE Jr., Lee Y, Jedrychowski MP, Chim H, Jurczak MJ et al. (2012) The deacetylase Sirt6 activates the acetyltransferase GCN5 and suppresses hepatic gluconeogenesis. Mol Cell 48: 900-913. doi:10.1016/j.molcel.2012.09.030. PubMed: 23142079. [DOI] [PMC free article] [PubMed] [Google Scholar]
- 24. Kim HS, Xiao C, Wang RH, Lahusen T, Xu X et al. (2010) Hepatic-specific disruption of SIRT6 in mice results in fatty liver formation due to enhanced glycolysis and triglyceride synthesis. Cell Metab 12: 224-236. doi:10.1016/j.cmet.2010.06.009. PubMed: 20816089. [DOI] [PMC free article] [PubMed] [Google Scholar]
- 25. Hirota K, Sakamaki J, Ishida J, Shimamoto Y, Nishihara S et al. (2008) A combination of HNF-4 and Foxo1 is required for reciprocal transcriptional regulation of glucokinase and glucose-6-phosphatase genes in response to fasting and feeding. J Biol Chem 283: 32432-32441. doi:10.1074/jbc.M806179200. PubMed: 18805788. [DOI] [PubMed] [Google Scholar]
- 26. Khatri S, Yepiskoposyan H, Gallo CA, Tandon P, Plas DR (2010) FOXO3a regulates glycolysis via transcriptional control of tumor suppressor TSC1. J Biol Chem 285: 15960-15965. doi:10.1074/jbc.M110.121871. PubMed: 20371605. [DOI] [PMC free article] [PubMed] [Google Scholar]
- 27. Ganjam GK, Dimova EY, Unterman TG, Kietzmann T (2009) FoxO1 and HNF-4 are involved in regulation of hepatic glucokinase gene expression by resveratrol. J Biol Chem 284: 30783-30797. doi:10.1074/jbc.M109.045260. PubMed: 19740748. [DOI] [PMC free article] [PubMed] [Google Scholar]
- 28. Chen CC, Jeon SM, Bhaskar PT, Nogueira V, Sundararajan D et al. (2010) FoxOs inhibit mTORC1 and activate Akt by inducing the expression of Sestrin3 and Rictor. Dev Cell 18: 592-604. doi:10.1016/j.devcel.2010.03.008. PubMed: 20412774. [DOI] [PMC free article] [PubMed] [Google Scholar]
- 29. Haeusler RA, Han S, Accili D (2010) Hepatic FoxO1 ablation exacerbates lipid abnormalities during hyperglycemia. J Biol Chem 285: 26861-26868. doi:10.1074/jbc.M110.134023. PubMed: 20573950. [DOI] [PMC free article] [PubMed] [Google Scholar]
- 30. Ouyang W, Beckett O, Flavell RA, Li MO (2009) An essential role of the Forkhead-box transcription factor Foxo1 in control of T cell homeostasis and tolerance. Immunity 30: 358-371. doi:10.1016/j.immuni.2009.02.003. PubMed: 19285438. [DOI] [PMC free article] [PubMed] [Google Scholar]
- 31. Ouyang W, Beckett O, Ma Q, Paik JH, DePinho RA et al. (2010) Foxo proteins cooperatively control the differentiation of Foxp3+ regulatory T cells. Nat Immunol 11: 618-627. doi:10.1038/ni.1884. PubMed: 20467422. [DOI] [PubMed] [Google Scholar]
- 32. Paik JH, Ding Z, Narurkar R, Ramkissoon S, Muller F et al. (2009) FoxOs cooperatively regulate diverse pathways governing neural stem cell homeostasis. Cell Stem Cell 5: 540-553. doi:10.1016/j.stem.2009.09.013. PubMed: 19896444. [DOI] [PMC free article] [PubMed] [Google Scholar]
- 33. Senokuchi T, Liang CP, Seimon TA, Han S, Matsumoto M et al. (2008) Forkhead transcription factors (FoxOs) promote apoptosis of insulin-resistant macrophages during cholesterol-induced endoplasmic reticulum stress. Diabetes 57: 2967-2976. doi:10.2337/db08-0520. PubMed: 18728232. [DOI] [PMC free article] [PubMed] [Google Scholar]
- 34. An BS, Tavera-Mendoza LE, Dimitrov V, Wang X, Calderon MR et al. (2010) Stimulation of Sirt1-regulated FoxO protein function by the ligand-bound vitamin D receptor. Mol Cell Biol 30: 4890-4900. doi:10.1128/MCB.00180-10. PubMed: 20733005. [DOI] [PMC free article] [PubMed] [Google Scholar]
- 35. Kwon HS, Huang B, Unterman TG, Harris RA (2004) Protein kinase B-alpha inhibits human pyruvate dehydrogenase kinase-4 gene induction by dexamethasone through inactivation of FOXO transcription factors. Diabetes 53: 899-910. doi:10.2337/diabetes.53.4.899. PubMed: 15047604. [DOI] [PubMed] [Google Scholar]
- 36. Wei D, Tao R, Zhang Y, White MF, Dong XC (2011) Feedback regulation of hepatic gluconeogenesis through modulation of SHP/Nr0b2 gene expression by Sirt1 and FoxO1. Am J Physiol Endocrinol Metab 300: E312-E320. doi:10.1152/ajpendo.00524.2010. PubMed: 21081708. [DOI] [PMC free article] [PubMed] [Google Scholar]
- 37. Ferre T, Pujol A, Riu E, Bosch F, Valera A (1996) Correction of diabetic alterations by glucokinase. Proc Natl Acad Sci U S A 93: 7225-7230. doi:10.1073/pnas.93.14.7225. PubMed: 8692973. [DOI] [PMC free article] [PubMed] [Google Scholar]
- 38. Ferre T, Riu E, Bosch F, Valera A (1996) Evidence from transgenic mice that glucokinase is rate limiting for glucose utilization in the liver. FASEB J 10: 1213-1218. PubMed: 8751724. [DOI] [PubMed] [Google Scholar]
- 39. Hariharan N, Farrelly D, Hagan D, Hillyer D, Arbeeny C et al. (1997) Expression of human hepatic glucokinase in transgenic mice liver results in decreased glucose levels and reduced body weight. Diabetes 46: 11-16. doi:10.2337/diabetes.46.1.11. PubMed: 8971074. [DOI] [PubMed] [Google Scholar]
- 40. Jackerott M, Baudry A, Bucchini D, Jami J, Joshi RL (2002) Improved metabolic disorders of insulin receptor-deficient mice by transgenic overexpression of glucokinase in the liver. Diabetologia 45: 1292-1297. doi:10.1007/s00125-002-0881-y. PubMed: 12242462. [DOI] [PubMed] [Google Scholar]
- 41. Niswender KD, Shiota M, Postic C, Cherrington AD, Magnuson MA (1997) Effects of increased glucokinase gene copy number on glucose homeostasis and hepatic glucose metabolism. J Biol Chem 272: 22570-22575. doi:10.1074/jbc.272.36.22570. PubMed: 9278411. [DOI] [PubMed] [Google Scholar]
- 42. Postic C, Shiota M, Niswender KD, Jetton TL, Chen Y et al. (1999) Dual roles for glucokinase in glucose homeostasis as determined by liver and pancreatic beta cell-specific gene knockouts using Cre recombinase. J Biol Chem 274: 305-315. doi:10.1074/jbc.274.1.305. PubMed: 9867845. [DOI] [PubMed] [Google Scholar]
- 43. Shiota M, Postic C, Fujimoto Y, Jetton TL, Dixon K et al. (2001) Glucokinase gene locus transgenic mice are resistant to the development of obesity-induced type 2 diabetes. Diabetes 50: 622-629. doi:10.2337/diabetes.50.3.622. PubMed: 11246883. [DOI] [PubMed] [Google Scholar]
- 44. Ferre T, Riu E, Franckhauser S, Agudo J, Bosch F (2003) Long-term overexpression of glucokinase in the liver of transgenic mice leads to insulin resistance. Diabetologia 46: 1662-1668. doi:10.1007/s00125-003-1244-z. PubMed: 14614559. [DOI] [PubMed] [Google Scholar]
- 45. Matsumoto M, Han S, Kitamura T, Accili D (2006) Dual role of transcription factor FoxO1 in controlling hepatic insulin sensitivity and lipid metabolism. J Clin Invest 116: 2464-2472. PubMed: 16906224. [DOI] [PMC free article] [PubMed] [Google Scholar]


