Pappenheimer (1951) suggested that small hydrophilic molecules traversed the capillary membrane through water-filled pathways. Karnovsky (1967) and others have demonstrated that the clefts lying between the endothelial cells of the capillary membrane are wide enough, about 100–200Å, to permit the passage of electron-dense molecules such as horseradish peroxidase, which has a molecular weight of about 40, 000. We now believe that both tracer extraction and osmotic transient techniques show that the route of penetration is via interendothelial clefts having a mean functional width of about l00Å.
Tracer Experiments
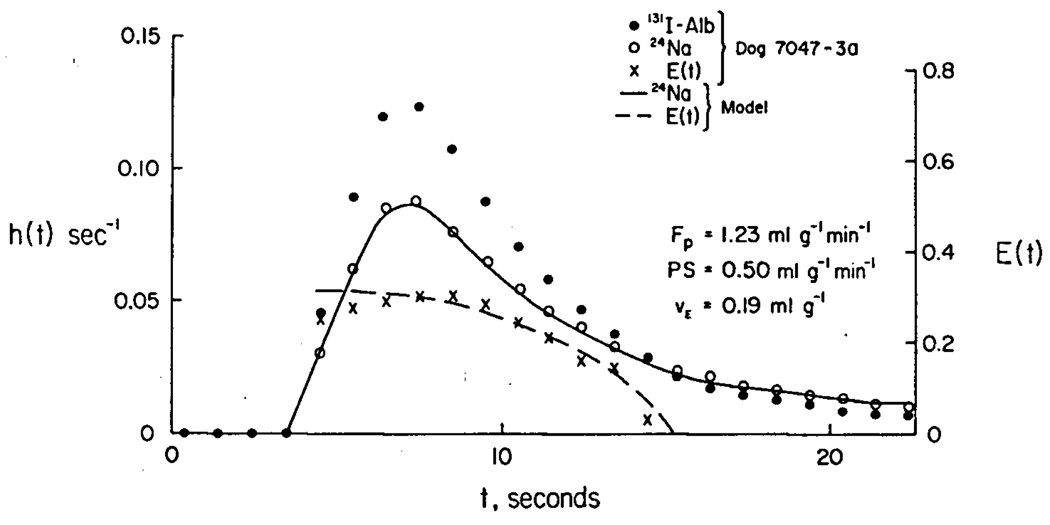
Crone (1963) demonstrated that one could estimate the product, PS, of capillary permeability, P cm/sec, times the capillary surface area, S cm2/g, for hydrophilic solutes from tracer dilution curves from the venous outflow of an organ following the injection of a bolus of several tracers into the inflow. Our experimental data were from isolated blood-perfused dog hearts, as by Yipintsoi and Bassingthwaighte (1970). A reference tracer, 131I- albumin, and a set of permeant tracers, 42K, 24Na, 14C- glucose and 3H- sucrose, were injected in a single bolus into the aortic root from which all of the blood went through the coronary vascular bed. Multiple sequential blood samples were obtained from the coronary sinus outflow at 0.4 or 1.0 second intervals. The concentration-time curves of activity of each tracer in the outflow were normalized to fraction of dose emerging per second. hN(t) is the reference non-permeant albumin curve and hD(t) is that for a permeating solute, and the instantaneous extraction E(t) was calculated:
| (1) |
Using the known blood flow, F, heart weight, W, and hematocrit, Hct, the experimental curves were fitted with the model to obtain estimates of PS and the extravascular volumes of distribution. The intravascular volumes of distribution, and a maximum value for capillary density and surface area were taken from data obtained independently on dog hearts by Bassingthwaighte, Harvey and Yipintsoi (1974). In figure 1 is shown a fit of sodium and albumin curves obtained simultaneously in an isolated dog heart with a single capillary model (Bassingthwaighte 1974.) Plasma flow, Fp, is F(l−Hct)/W. The fitting provides the values for PS and VE, the extravascular volume of distribution.
Fig. 1.
The shape of the extraction curve, E(t), is typical in that the early portion is rising to a maximum occurring near the time of the peak of the reference curve, hN(t). This rise can partly be accounted for by a heterogeneity of regional flows, for the extraction is less in high flow than in low flow regions, and the arrival times earlier. The modeling showed that the single most useful value of E(t) is the maximum, Emax, which occurs near the time of the peak of hN(t). Guller et al (1974) found that PS for sodium could be calculated simply and almost as accurately as by model fitting, by using an empirical equation of the form used by Crone by multiplying Emax by 1.136, as if the maximum possible E(t) were the reciprocal, 0.88:
| (2) |
Using this tracer diffusion technique at high flows where we assumed the capillary bed to be pretty well open, we found values for PS for K+, Na+, glucose and sucrose to be 1.4, 1.0, 0.5, and 0.36 ml g−1 min−1. The ratios of PS/D, where D is the free diffusion coefficient in water, were 1.30, 1.19, 1.24, 1.15 × 103 cm/g. These values will be used below to provide a measure of the minimum effective cleft width, and are compatible with the data and conclusions of Alvarez and Yudilevich (1969).
Osmotic Transient Experiments
With a step change in perfusate osmolarity, water and solutes flow across the capillary membrane and water crosses the cell membrane. Yipintsoi and Knopp (1972) found that tracer extraction was unaffected by the direction of simultaneous water flux induced by an osmolarity change; for describing the fluxes of water and non-tracer solutes they developed a model with varying volumes. Grabowski (1974) developed a model composed of rigid capillaries exchanging solutes and water with a flexibly-sized interstitial space which in turn exchanged water across cell walls impermeable to solute. Osmotic transient data were obtained from rabbit hearts, as described by Vargas and Johnson (1967) in response to step changes in the perfusate concentration of albumin, sodium, sucrose, raffinose, or inulin. The response to a step rise in osmolarity is a diminution in both weight and perfusion pressure. The analysis is done on a group of curves for these solutes, arriving at a common set of parameter values satisfying the whole group but individual values for permeability, P, and reflection coefficient, σ, for each solute of molecular radius, a.
| Solute | Sodium | Sucrose | Raffinose | Inulin | Albumin (est.) |
|---|---|---|---|---|---|
| a, Å | 2.5 | 5.2 | 6.0 | 10–15 | 37 |
| P × 105 cm/sec | 5.6 | 1.9 | 1.3 | 0.58 | 0.036 |
| σ | 0.085 | 0.165 | 0.19 | 0.41 | 0.88 |
| D×105 cm2/sec at 25°C | 1.48 | 0.52 | 0.43 | 0.18 | 0.069 |
Interpretation
Estimates of cleft width, w, were obtained for the tracers using ratios of PS/D in a Renkin-like expression derived from Faxen's (1922) relation for the drag on a sphere of radius a moving through a slit. Using η = 2a/w:
| (3) |
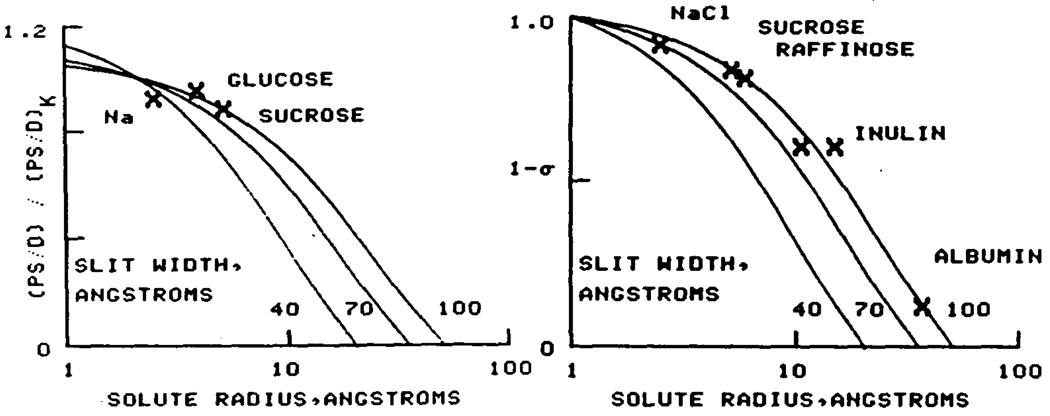
For the tracers, the observed ratios, using potassium (a = 2.1Å) as reference, are plotted against molecular radius on a logarithmic scale in fig. 2, L. For glucose, a = 3.95Å; others as above. The theoretical lines from Eq. 3 are superimposed, suggesting that cleft widths averaged 100Å.
Fig. 2.
The osmotic data provide P and σ, the reflection coefficient. The P's can be related to each other via the reflection coefficients in an expression derived from Durbin (1956); s for one solute, × for another:
| (4) |
The solvent molecule, water, is defined as having a zero reflection coefficient, so that slit width can be calculated using either water or pairs of solute molecules in Eq. 3. (This analysis assumes the D' s within the cleft to be in the same ratios to each other as are the free diffusion coefficients in water.) The results are plotted in fig. 2, right, using water with a Stokes-Einstein radius of 1.0Å, which gives the correct drag, as the reference. The data best fit a cleft width of 90 to 100Å and are incompatible with a w of less than 70Å.
Conclusion
Thus these methods, both having been substantially refined as analytical tools, provide similar estimates of cleft width, of about 100Å. These data do not provide a final answer. Tracer data on larger solutes are needed to refine the estimate of width. The osmotic data were acquired on albumin-free Tyrode-perfused hearts rather than with protein-containing perfusate. Nevertheless the two independent methods suggest that permeation is via passages about twice as large as 40Å radii pores.
References
- Alvarez OA, Yudilevich DL. Heart Capillary Permeability to Lipid-Insoluble Molecules. J. Physiol. London. 1969;202:45–58. doi: 10.1113/jphysiol.1969.sp008794. [DOI] [PMC free article] [PubMed] [Google Scholar]
- Bassingthwaighte JB. A concurrent flow model for extraction during transcapillary passage. Circ. Res. 1974;35:483–503. doi: 10.1161/01.res.35.3.483. [DOI] [PMC free article] [PubMed] [Google Scholar]
- Bassingthwaighte JB, Yipintsoi T, Harvey RB. Microvasculature of the dog left ventricular myocardium. Microvascular Res. 1974;7:229–249. doi: 10.1016/0026-2862(74)90008-9. [DOI] [PMC free article] [PubMed] [Google Scholar]
- Crone C. Does restricted diffusion occur in muscle capillaries? Proc. Soc. Expt. Biol. and Med. 1963;112:453–455. doi: 10.3181/00379727-112-28075. [DOI] [PubMed] [Google Scholar]
- Durbin RP. Osmotic flow of water across permeable membranes. J. Gen. Physiol. 1960;44:315–326. doi: 10.1085/jgp.44.2.315. [DOI] [PMC free article] [PubMed] [Google Scholar]
- Faxen H. Die Bewegung einer starren Kugel längs der Achse eines mit zäher Flussigkeit gefüllten Rohres. Ark. Mat. Astron. Fys. 1922;17:27. [Google Scholar]
- Grabowski EF. Osmotic weight transients in myocardium: a convective diffusion model. Proc. Summer Computer Simulation Conference; July 1974; Houston, Texas. pp. 678–687. [Google Scholar]
- Guller B, Yipintsoi T, Orvis AL, Bassingthwaighte JB. Myocardial Sodium Extraction at Varied Coronary Flows: Estimation of Capillary Permeability by Residue and Outflow Detection. Circ. Res. 1974 or 1975 doi: 10.1161/01.res.37.3.359. [DOI] [PMC free article] [PubMed] [Google Scholar]
- Karnovsky MJ. The ultrastructural basis of capillary permeability studied with peroxidase as a tracer. J. Cell Biol. 1967;35:213–236. doi: 10.1083/jcb.35.1.213. [DOI] [PMC free article] [PubMed] [Google Scholar]
- Pappenheimer JR, Renkin EM, Borrero LM. Filtration, diffusion and molecular sieving through peripheral capillary membranes. A contribution to the pore theory of capillary permeability. Amer. J. Physiol. 1951;167:13–46. doi: 10.1152/ajplegacy.1951.167.1.13. [DOI] [PubMed] [Google Scholar]
- Vargas F, Johnson JA. Permeability of rabbit heart capillaries to nonelectrolytes. Amer. J. Physiol. 1967;213:87–93. doi: 10.1152/ajplegacy.1967.213.1.87. [DOI] [PubMed] [Google Scholar]
- Yipintsoi T, Bassingthwaighte JB. Circulatory transport of indoantipyrine and water in the isolated dog heart. Circ. Res. 1970;27:461–477. doi: 10.1161/01.res.27.3.461. [DOI] [PMC free article] [PubMed] [Google Scholar]
- Yipintsoi T, Knopp TJ. Simultaneous permeability estimation by osmotic transient and tracer diffusion techniques. Biophys. J. 1972;12:137a. [Google Scholar]


