Abstract
Fractal signals can be characterized by their fractal dimension plus some measure of their variance at a given level of resolution. The Hurst exponent, H, is <0.5 for rough anticorrelated series, >0.5 for positively correlated series, and =0.5 for random, white noise series. Several methods are available: dispersional analysis, Hurst rescaled range analysis, autocorrelation measures, and power special analysis. Short data sets are notoriously difficult to characterize; research to define the limitations of the various methods is incomplete. This numerical study of fractional Brownian noise focuses on determining the limitations of the dispersional analysis method, in particular, assessing the effects of signal length and of added noise on the estimate of the Hurst coefficient, H, (which ranges from 0 to 1 and is 2 − D, where D is the fractal dimension). There are three general conclusions: (i) pure fractal signals of length greater than 256 points give estimates of H that are biased but have standard deviations less than 0.1; (ii) the estimates of H tend to be biased toward H = 0.5 at both high H (>0.8) and low H (<0.5), and biases are greater for short time series than for long; and (iii) the addition of Gaussian noise (H = 0.5) degrades the signals: for those with negative correlation (H < 0.5) the degradation is great, the noise has only mild degrading effects on signals with H > 0.6, and the method is particularly robust for signals with high H and long series, where even 100% noise added has only a few percent effect on the estimate of H. Dispersional analysis can be regarded as a strong method for characterizing biological or natural time series, which generally show long-range positive correlation.
Keywords: Time series analysis, Autocovariance, Gaussian and fractional Brownian noise, Correlation, Hurst coefficient, Fractal dimension, Statistics
INTRODUCTION
This study concerns the assessment of the method of dispersional analysis for estimating the fractal dimension of one-dimensional time series, a general function f(t) with values obtained at even intervals in time. Studies were done on known signals generated by two methods designed to produce fractional Brownian noise signals with a specified value for H, the characterizing Hurst coefficient. H is a measure of roughness; the roughness or anticorrelation in the signal is maximal at H near zero. White noise with zero correlation has H = 0.5. Smoother correlated signals have H near 1.0. For one-dimensional series, H = 2 − D, where D is the fractal dimension, 1 < D < 2.
In 1988, we introduced a method for assessing the fractal characteristics of regional flow distributions in the heart, dispersional analysis (1). The technique, which we will detail below, is a one-dimensional approach that can be applied to an isotropic signal of any dimension. Making estimates of the variance of the signal at each of several different levels of resolution form the basis of the technique; for fractal signals a plot of the log of the standard deviation versus the log of the measuring element size (the measure of resolution) gives a straight line with a slope of 1 − D, where D is the fractal dimension.
In the years since its introduction in 1988 (1), dispersional analysis has been fairly extensively applied, for example to regional flow distributions in the heart (3), the lung (11) and, more recently, the kidney (12); for these applications the result is the provision of descriptors of the degree of heterogeneity of regional flows that apply over a wide range of scales of resolution. While it is intuitively obvious that greater heterogeneity will be observed when the spatial resolution of the observations is more refined, when the spatial distributions are fractal, the heterogeneity observed at each of many different levels of resolution is describable in terms of two numbers, a fractal dimension, D, and the variance at a chosen level of resolution. Such two-number descriptors allow the results from various laboratories around the world to be compared even when the raw observations have not been made on pieces of tissue of the same size at all these laboratories.
Dispersional analysis is also applicable to signals that are functions of time (i.e., true one-dimensional signals such as might be obtained for blood pressure, heart rate, or local concentration of a solute). Not many such signals have been examined for their fractal nature. Biological signals may also be combinations of fractal and periodic components, as suggested for heart rate by Yamamoto et al. (27,28). In our introductory paper, an application of dispersional analysis to the velocities of red blood cells in capillaries did give a straight-line relationship between log(variance) and log(time), but the data set used was short, and therefore this result did not really give an indication that the method was valid (1). A later analysis by Schepers et al. (23) using four different techniques for examining time series as fractals showed that the method worked apparently well on signals of 8,192 elements or more: the test signals were fractal signals generated by the spectral synthesis method outlined by Saupe, in Peitgen and Saupe (21), the same signal generation method used for the present study.
A traditional problem with any particular statistical method is the insecurity of estimates based on short data sets. The limitations on accuracy in estimating means of distributions is well worked out for Gaussian signals, upon which much of modern statistics is based. Fractal signals, however, exhibit varying degrees of autocorrelation, so the estimates of confidence limits based on Gaussian statistics are inappropriate. In general, signals with correlation structure require more data than do Gaussian signals in order to obtain the same reliability in estimates, simply because of the local correlation and the difficulty in distinguishing fractal signals from nonstationary Gaussian signals. An example of this is given in the study of the Hurst rescaled range analysis by Bassingthwaighte and Raymond (6): as suggested by Feller (10), an estimate of the range of excursion of the values predicted for future times from the available time series is more erroneous for the fractal series than an estimate obtained from a random Gaussian time series (which is special case of a fractal series, with H = 0.5 and zero near-neighbor correlation). As a part of this study we will assess the shapes of the probability density functions of estimates of H under varied conditions.
The purpose of the present study is to evaluate the limitations of dispersional analysis for a fractal time series. A subsidiary purpose is to compare the dispersional analysis and the rescaled range method (Hurst analysis), for which latter method the limitations are quite severe; we will demonstrate that dispersional analysis provides higher reliability for both short and long data sets. The results lead to the conclusion that dispersional analysis is more robust than Hurst analysis, particularly in showing less bias.
Definition of a Fractal Time Series
A fractal object is defined as one that shows self-similarity or self-affinity independent of scaling. For a function f(t) to be self-similar both f(t) and t must have the same units, temporal: an example is electrocardiographic R-R intervals versus time. Since a general time series f(t) has units of amplitude in volts, distance, etc., versus units of time it cannot be self-similar, but is termed self-affine. Self-affinity implies therefore that the roughness or variability of the signal is independent of Δt, where the time interval Δt is a measure of the temporal resolution. Self-affine signals have power law spectra—a proportional increment in frequency predicts a proportional decrement in power, independent of the frequency.
METHODS
The study focuses on the effects of the length of the signal and of noise added to the signal on the accuracy of estimation of H. Signals were generated with numbers of points ranging from 26 to 220 and with values of H from 0.1 to 0.9. For the body of the study of these purely fractal Brownian noise signals were analyzed. For the noise analysis only signals of 1,024 and 130,072 points were analyzed, for H’s of 0.1 to 0.9, and each with noise added up to levels where the standard deviation of the noise was five times that of the signal.
A glossary of the terminology used is given at the end of the paper.
Fractal Signal Generation
The spectral synthesis method, SS, is designed to produce a signal where the amplitude of the Fourier power at each frequency contained in the signal diminishes with frequency proportional to 1/ωβ. When β = 0, the power spectrum is flat, as is the case for white noise, in which the time series is composed of a sequence of independent random values. Integrating a random white noise signal gives classical Brownian motion, where the individual steps are random and uncorrelated. The Fourier power spectrum of Brownian motion diminishes as l/ω2 or β = 2. The integration gives the correlation and increases β. Beta is related to the Hurst coefficient, H: β = 1 + 2 H. Integration of a stationary signal produces a smoother signal with a value of β higher by 2.0 than that of the original signal.
Fractional Brownian noises, fBn, have −1 < β ≤1, and white noise has β = 0. Fractional Brownian noise signals, fBn, are the differences between adjacent points in a fractal Brownian motion (i.e., the fBm is the integral of the fBn). Fractional Brownian motion, fBm, with β higher than 2.0 represents relatively smooth types of, fBm.
The spectral synthesis method for producing fBm, given by Saupe in Peitgen and Saupe (21), and similar to that of Feder (9), is also called the Fourier filtering method because the power spectrum looks like that of a signal filtered to diminish the high-frequency components. The method is to generate the coefficients in the Fourier series,
| (1) |
for i = 0, 1, 2, …, N, and where Aj and Bj are the transform coefficients generated using
| (2) |
| (3) |
| (4) |
| (5) |
where β is the exponent for the power spectrum, 1/ωβ, of the desired fBn, Gauss() is a Gaussian random number generator with mean 0 and standard deviation 1, and Rand() is a uniform random number generator over the range from 0 to 1. The phase randomization is essential (13). The power or amplitude terms, the Pj’s, contain the Gaussian term that alone is to be scaled by j−β/2 and provides for the amplitude reduction at successively higher frequencies when H > 0. The resultant F(t) is fractal Brownian motion at intervals Δt. The increments between elements of F(t) comprise the fractional Brownian noise, so the fBn signal of length N is obtained by taking the successive differences from the fBm:fi = Fi + 1 − Fi. The result gives the fBn: f(ti) with ti = (i − 1/2)Δt, and fi, for i = 1, …, N.
Two variants of the method were used, the first being exactly as just described. The second, SS8, was given a value for N of eight times the desired series length and then using one-eighth of it, starting at a randomly chosen point and avoiding the ends. In a series with minimum length, N only, the first and last points are considered as neighboring points, so that the beginning and end segments are correlated.
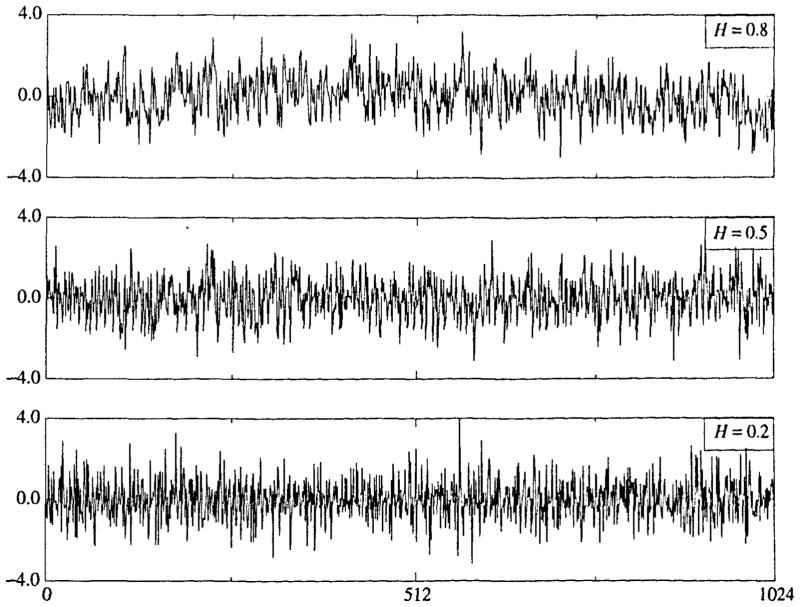
Fractional Brownian noise signals generated using the spectral synthesis method are shown in Fig. 1 for H = 0.2 (negatively correlated near-neighbors), 0.5 (random, uncorrelated), and 0.8 (positively correlated near-neighbors). Each signal has been normalized in amplitude to have a standard deviation of 1.0 around the mean of zero. The signals do look different from each other; it can be seen that the signal with H = 0.2 looks darker than that for H = 0.8 since it crosses the zero line much more often than does that for H = 0.8. It is also evident that the H = 0.8 signal shows longer periods in which it differs from the mean than do those with lower H’s.
FIGURE 1.
Fractional Brownian noise signals with N = 1024 points generated by the spectral synthesis method (SS) with H = 0.2, 0.5, and 0.8, all normalized to a standard deviation of 1.0 around a mean of zero.
The successive random additions (SRA) method is a line replacement method. Displace the midpoint of an “initiator” line by a random distance perpendicular to the line, thereby creating two line segments from the initiator. Displace the two endpoints randomly also, using the same scalar. (This version therefore is a midpoint and endpoint displacement method.) This creates two line segments from the original one segment, but none of the original points remain exactly where they were. On the next iteration the scalar for the random displacements is reduced by a fraction depending on H. Expressed as the variance for a Gaussian random variable:
| (6) |
where ΔF is the variable displacement, σ2 is the variance for a Gaussian distribution, and n is the iteration number. For uncorrelated Gaussian noise H = 0.5 and the expression reduces to
| (7) |
The method replacing the endpoints as well as the midpoint is better than midpoint displacement alone. The resultant signals give fractional Brownian motion, fBin, with the H defining the correlation. The algorithm gives the Brownian motion, fBm, rather than the noise, fBn, because the successive displacements are added to or subtracted from the midpoints of lines that have already been moved from the original line in the preceding iterations. The successive differences of fBm are fractional Brownian noise, fBn, fi with i = 1, …, N.
Dispersional Analysis
Dispersional analysis involves the measurement of the variance or standard deviation of a signal at a succession of different levels of resolution. The different levels are obtained by grouping adjacent data points and replacing each with the group average: taking successively larger groups is equivalent to reducing the resolution. In the classic case from Richardson (22), using calipers to measure the length of a coastline, he found that over a wide range, the relationship between the logarithm of the apparent measured length and the logarithm of the caliper length was linear, and slope gave a measure of the fractal dimension. Likewise, the variance in regional flows within the tissue of an organ was found by Bassingthwaighte (1) to exhibit a linear relationship between the log of the variance, or the standard deviation, SD, and the log of the size, m, of the observed unit:
| (8) |
from which the fractal dimension D is obtained from the slope of the log-log regression:
| (9) |
where m is the element size used to calculate SD, and m0 is the arbitrarily chosen reference size, where “size” is the number of points aggregated together in a one-dimensional series, or a length over which an average is obtained, or the mass of a tissue sample in which a concentration is measured. The fractal dimension D = 2 − H, where H is the Hurst coefficient; we slide back and forth using D and H, but the advantage of H is that it gives a direct indication of the degree of smoothness or correlation which has the same meaning for signals of any Euclidean dimension, E. In general, H = E + 1 − D. A Hurst coefficient of 0.5 indicates a random noncorrelated signal (otherwise known as white noise) whether the signal is one-, two-, or three- dimensional. One reason for calling Eq. 8 a fractal relationship rather than just a power law relationship is that the possible slopes of the relationship are bounded by limits, and the fractal dimension, D, gives insight into the nature of the data. In this particular case, a value for D of 1.5 (which equals a Hurst coefficient of 0.5) is found when the variation is indistinguishable from random uncorrelated noise, and a value of D not far above 1.0 (or H nearly 1.0) represents high near-neighbor correlation and near uniformity of the signal over all length scales.
A second reason for calling this a fractal relationship is that the fractal dimension D gives a measure of the spatial correlation between regions of any defined size or separation distance. The correlation between nearest neighbors is defined by the following formula
| (10) |
where r1is the correlation coefficient (26). The correlation extends to more distant neighbors in accord with a general formula provided by Mandelbrot (20) and derived from dispersional analysis by Bassingthwaighte and Beyer (5):
| (11) |
If a fractal relationship is a reasonably good approximation, even if only over a decade or so, it will prove useful in descriptions of spatial functions and should stimulate searches for the underlying bases for correlation.
This process is shown for two signals in Fig. 2. At the top of each panel is the recorded signal, ungrouped. The second rows are the means of groups of four, the third rows, means of groups of sixteen, and the bottom panels are the means of groups of 64 elements. The apparent variation diminishes as the number of data points in each binning period, τ, enlarges. Note that the diminution in the variation is much more rapid with successive binnings for the signal with H = 0.2 (right panel), than it is for the successive binnings of the signal with H = 0.8 (left panel). This is because with H = 0.8 there is a high degree of near-neighbor correlation, which implies that the individual values grouped together are relatively alike and are all close to a local mean. With H = 0.2, the adjacent points tend to be on opposite sides of the long-term or overall mean, and so tend to give group averages close to the overall mean even with small groups. (Normally the successive groups are composed of near-neighbor pairs, not fours as used in the figure.)
FIGURE 2.
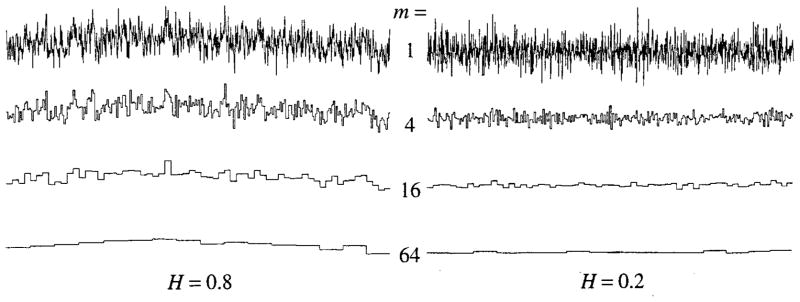
Successive averaging of quadruples of neighboring elements of one-dimensional fractional Brownian noise signals (N = 1024). The group sizes enlarge by a factor of four for each row from the top down; the group means are plotted over the range of m elements included in the group (Left panel) fBn with H = 0.8, or fractal D = 1.2. (Right panel) fBn with H = 0.2 or fractal D = 1.8.
Steps in Estimating Fractal Dimension from the Variation in a One-Dimensional Signal
Define the signal. Consider the case of a signal f(t) measured at even intervals in time: fi, i = 1, 2, …, N at t = t1, t2, … tN. The chosen constant time interval between samples, Δt, may be dictated by the resolution of the measuring apparatus, or may be defined arbitrarily.
-
Calculate the standard deviation of the set of n observations:
(12) where the denominator is n, using the sample SD rather than the population SD where n − 1 would be used. For this first calculation, we consider the data set of N points to be composed of n groups of points where in this case each group consists of one datum.
Next, aggregate adjacent samples into groups, each consisting of two adjacent data points, and define a group size m = 2, or a binning period τ = 2Δt. Calculate the mean for each pair, and calculate the SD of the means of the groups. These “groups” have two members: m = 2, and for the series in Fig. 2, n = 512.
Repeat Step iii with increasing group sizes of 4, 8, 16, 32, etc., until the number of groups, n, ≤4 (this is an arbitrary stopping point based on the idea that the SD would not be accurate if n < 4). For each grouping m × n = N. (Groups of 3, 5, 6, 7, etc., nonoverlapping values could also be calculated, but these are partially redundant.) When N/2m is not integer, more points must be omitted as m is increased. This may be done by omitting points from the beginning and ending of the series, but not from the middle since the contiguity is critical to assessing the near-neighbor correlation.
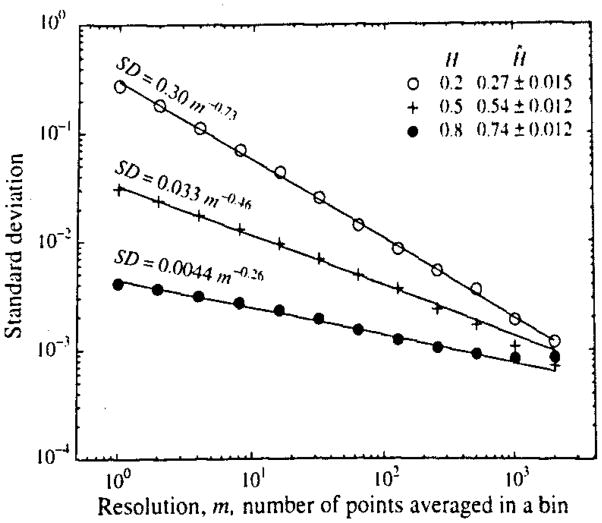
Plot log SD(m) versus log m, where m is the group size. For each m there are N/m = n values used in calculating the SD. The plot gives a straight line if the signal is a simple fractal, as is seen in Fig. 3
Determine the slope and intercept for the logarithmic relationship. This can be done by estimating the standard Y on X regression, which assumes no error in m, using the logarithms as in Fig. 3. One can also use nonlinear regression to fit a power law equation of the form of Eq. 8, but the results will usually be similar. (The standard linear regression calculation provides a measure of the confidence limits on the slope. Nonlinear optimization routines may also be used to provide estimates of confidence limits on the estimate of the slope from the covariance matrix.) Any group size might be the chosen reference size, m0. We chose m0 = 1, for the equations in Fig. 3.
Calculate the fractal D from the power law slope: the estimate of D, D̂ = 1 − slope, as in Eq. 9. Equivalently, Ĥ, the estimate of H is found as Ĥ = slope + 1.
FIGURE 3.
Log standard deviation, SD, versus log binning length m for signals with H = 0.2,0.5, and 0.8. Each had a total length of 213 or 8,192 points. The estimates of H from the slope of the log-log regression relationship are listed as Ĥ ± 1 SD of Ĥ. (These are the 68% confidence limits, or one half of the 95% confidence limits, calculated from the regression statistics for the lines fitted to each of the three sets of SD’s. For observations on 100 trials see Table 1.)
Noise Generation
To test the effects of random noise added to a purely fractal Brownian noise signal we used Gaussian random noise. The scalar for the standard deviation of the Gaussian noise was chosen as a percentage of the standard deviation of the fractal signal, from 0 through 5, 10, 20, 40, 60, 80, 100, 125, 150, 175, 200, 250, 300, 350, 400, and 500% added noise.
RESULTS
In general the results reported here apply to analysis of signals generated using the SS algorithm. Comparisons have been made with signals generated by taking ⅛ of a long SS signal (called SS8) and by the successive random addition, SRA, method as will be made explicit.
Accuracy of Estimation of H from Single Time Series
Figures 1 to 3 provide an example of the methods applied to three time series. Time series of length N = 8192, of which the first 1,024 points are shown in Fig. 1, were carried though the procedural steps listed above, creating reduced sized series by binning as in Fig. 2 and then plotting the log(SD) versus log(m) for each bin size as in Fig. 3. The regression calculations gave the slopes, which are 1 − D or H − 1; the estimates of H, Ĥ, are given in Fig. 3 for these three data sets. Each of these time series is but a single realization, thus the confidence intervals for Ĥ are calculable from the regression statistics. Stronger estimates of the variability in Ĥ are provided by using repeated trials, reported below.
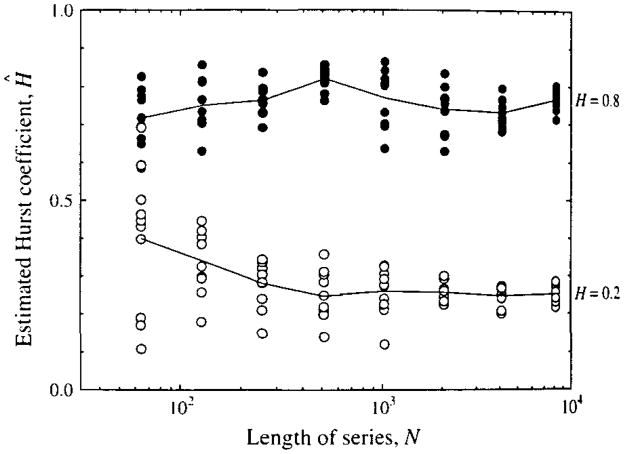
Consequently, 10 series each of length N, ranging from 26 to 213 points were analyzed. Figure 4 shows results for H = 0.2 and 0.8 to illustrate the scatter at each level of N. Over the range of N from 64 to 8196 points there is distinctly more scatter in Ĥ with short series. (The same result holds if the N points are selected as a part of a longer series, so it appears that this scatter is inherent to the analysis of short sets rather than to error in the signal generating routine per se.) One gets also the impression from Fig. 4 with N = 64 points that there is more scatter in the estimates for signals with H = 0.2 than for H = 0.8, a question which will be examined in detail below.
FIGURE 4.
Estimates of the Hurst coefficient, H, for fractal time series of varied numbers of points n. Ten estimates from 10 separate time series generated with each value of N are shown for each of two values of H, 0.2 and 0.8 (a total of 160 time series), the shortest of which had 64 time points and the longest 8,192 points.
Lack of Influence of Method of Regression for Ĥ
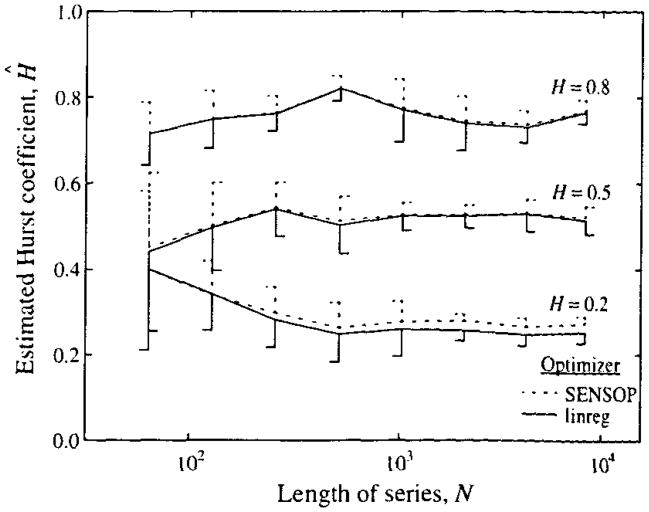
Series generated with H = 0.2, 0.5, and 0.8 were analyzed using two different statistical approaches. The results are shown in Fig. 5. The estimates Ĥ were obtained in two ways for each series: (i) using standard Y on X regression for log(SD) versus log(m), and (ii) using a nonlinear least squares method. SENSOP, which minimizes the squares of the distances between the observed set of SD’s and the power law expression SD(m) = SD0(m/m0)H−1, which is a variant of Eq. 8. The former method minimizes the squares of the logarithms of the distances between log(SD) and the log-log regression line. In theory, the nonlinear least squares method using SENSOP would be better if the errors were Gaussian random in the original data space, but there is really no substantial difference. Probability density functions of estimates (to be shown later) indicate that there is bias in the means, a small tendency to negative skewness, but that the kurtosis is the same as for a Gaussian distribution. In later analyses we used the standard Y on X linear regression analysis of log(SD) versus log(m), simply for simplicity.
FIGURE 5.
Means and standard deviations (for 10 series each) of estimated Hurst coefficients for fractal time series of varied lengths, N points, for series with H = 0.2, 0.5, and 0.8. The slopes of the SD versus m plots were obtained with both a nonlinear regression method (using SENSOP) and by linear regression of log SD versus log m using linreg, a program for either weighted linear regression or the standard Y on X regression and available at our ftp site. The standard deviations for each method of estimating H are given by one-sided vertical bars, dashed for SENSOP, continuous for linreg, and pointing rightward for H = 0.5 only.
Effects of the Length of the Time Series
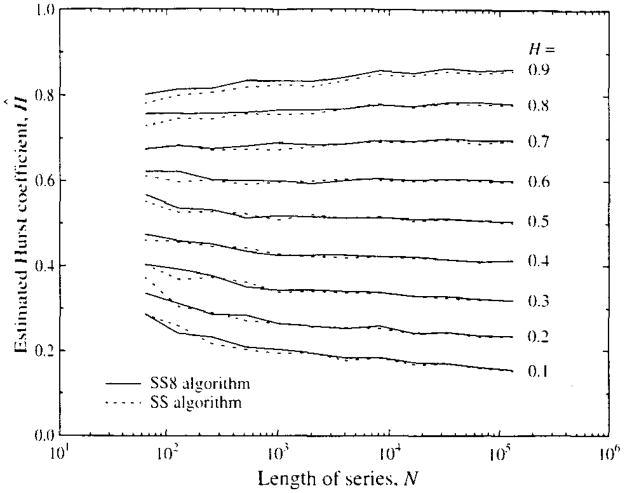
Series generated using 100 realizations via SS and another 100 via SS8 with H’s from 0.1 to 0.9 and lengths N from 26 to 220 were tested. The results are summarized by the means of 100 trials for each H, which are plotted in Fig. 6. The graph shows results for 15 values of N, with 100 trials for each, for each of nine values of H, a total of 24,300 series; the SS8 method was not used for the three longest series. (These series are not the same ones as presented in Fig. 5.) The means and SD’s of the Ĥ’s are given in Table 1.
FIGURE 6.
Means of estimates of the Hurst coefficient H for 100 fractal time series generated by the spectral synthesis method (SS,-----) for series with N = 26 to 220 points, and 100 series generated from series eight times as long (SS8,——) for series with 26 to 217 points. (See Fig. 7 for the standard deviations of for each N, H pair, and Table 1 for the combined standard deviations for the 200 realizations at each point.)
Table 1.
Estimating H: means ± SD’s for 200 trials.
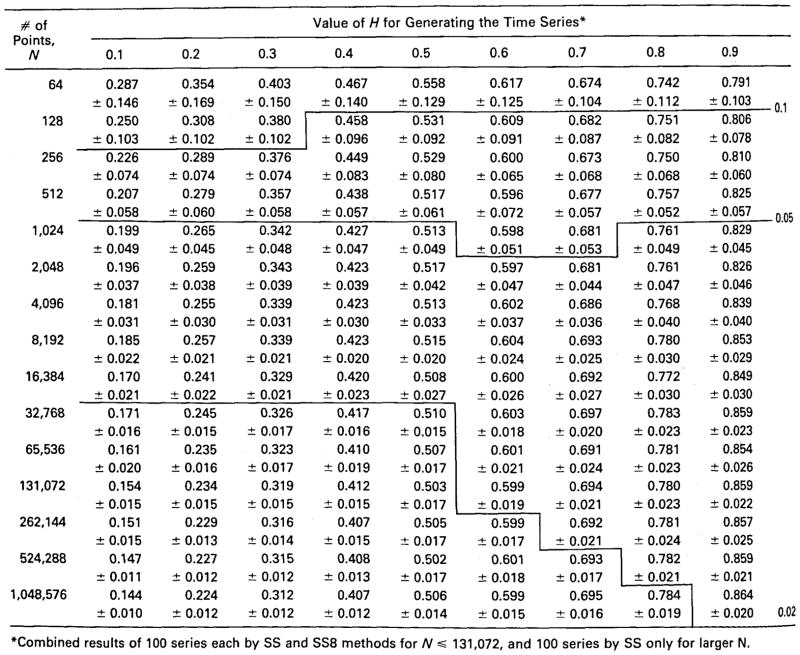 |
Combined results of 100 series each by SS and SS8 methods for N ≤ 131,072, and 100 series by SS only for larger N.
The standard deviations of Ĥ are shown in Fig. 7. The variability for short series is large. As might be expected of a fractal, the estimates of the SD’s themselves show self-similarity, and over the range from N = 26 (N = 64) to N = 217 (131,072) the SD’s decrease as a power law function of N with power law exponent equaling about 3.6. (The meaning of this exponent is not known, which is in itself another reminder that the fundamental underlying statistical theory for these methods is not yet developed. The descriptive equation would be SD[N] = SD[N0] · (N/N0)3,6, using N0 = 26 and SD[N0] = 0.1.) There is a suggestion that the relationship flattens at N = 215, but this idea is refuted by the continued decreases in SD with higher N reported at the bottom part of Table 1.
FIGURE 7.
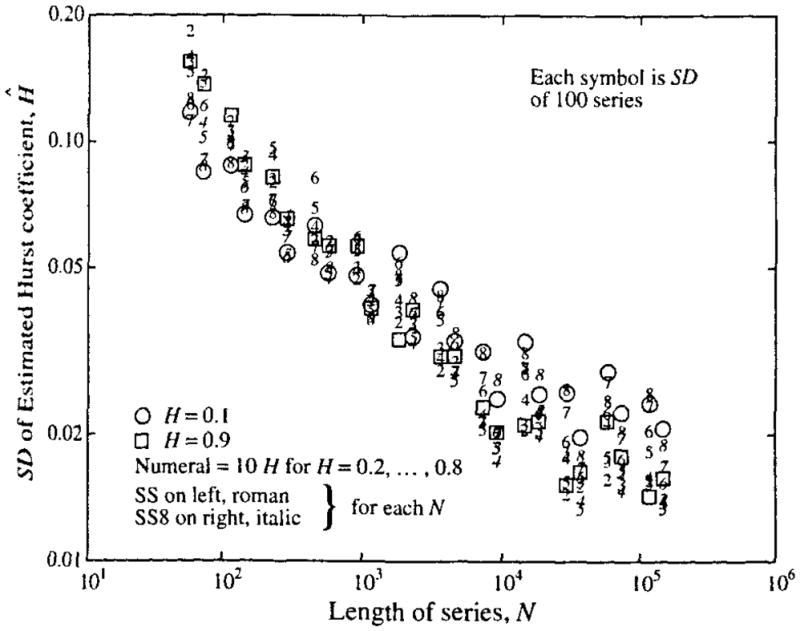
Standard deviations of Ĥ from fractal time series: Series were of varied length N, given on the abscissa. For each point on the graph 100 time series of length N were generated by both the SS and SS8 methods. For each N, the mean of the 100 estimates of Ĥ on SS-generated series are on the left and the mean of the 100 estimates on the SS8-generated series on the right. The value for H used in the generation is given by the numeral located at the value of Ĥ, using Roman fonts for SS and italic fonts for SS8. Using Fisher’s F test for comparing the variances from SS-generated versus SS8-generated series, for 75% (or 81 of 108) of N, H pairs the SS series gave larger variances at level p ≥ 0.9.
The standard deviations for Ĥ are much smaller for the longer series, as was true for the series in Fig. 5. For estimates of H with precision within 0.05, about 4,000 points are required in the series whether H = 0.9 or H = 0.1. (By precision we mean the reproducibility of the value of Ĥ and mean only that the standard deviation of Ĥ is ≤0.05, and do not imply anything about its accuracy, by which we mean the absence of bias.) In practice most series of biological and natural events show positive correlation, with H’s above 0.5; for such series one can say that series longer than 4000 points will have a precision of estimate within 0.05 of the expected mean value (as in Table 1) from the method for two-thirds of the trials. However, to attain a precision of 0.02 more points are required when H > 0.5 (requiring N of 500,000) than when H < 0.5 (requiring N’s of 16,000 to 65,000).
There is systematic error or bias in Ĥ. This bias toward the middle values is seen clearly in Fig. 8 in plots of the estimated Ĥ against the true H for the generated signal. This is most evident when estimating H with short signals, n = 64 and 128 points; the estimates for H = 0.1 and for H = 0.9 are both biased toward 0.5, while the estimates for signals with H = 0.6 and 0.7 are approximately correct, even with small N. There are biased estimates even for long signals, N = 220, where the slope of the Ĥ versus H relationship is less than unity. For N = 128 the slope is very low, but the estimates do lie within 10% of the correct H over the limited range between 0.6 and 0.8. This is consoling because this is the range of H within which many biological signals occur.
FIGURE 8.
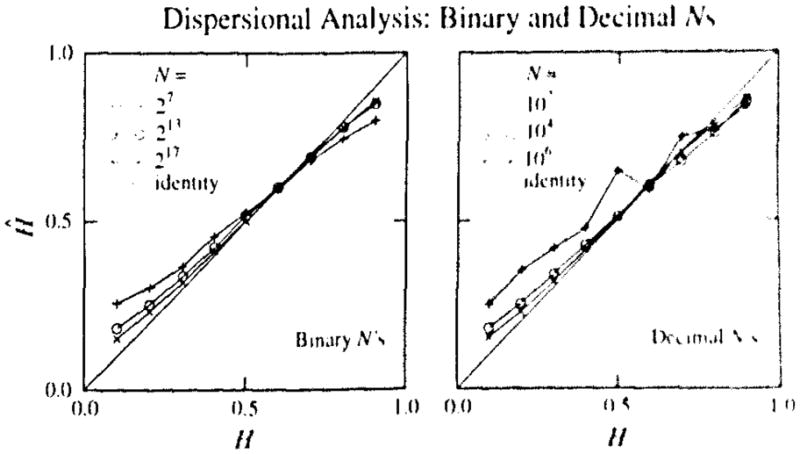
Estimates, Ĥ, versus true Hurst coefficient (Left panel). Estimates of H versus true H for dispersional analysis for 100 realization of the signals with N = 27, 213, and 217 points, binary lengths which use all the points when binned. The regression lines for these three values of N have slopes of 0.71, 0.85, and 0.90 (and correlation coefficients r = 0.9983, 0.9995, and 0.9997, and intersect the line of identity at true H’s of 0.59, 0.61, and 0.55. (The regressions, not plotted, have intercepts at H = 0 of 0.172, 0.089, and 0.057.) (Right panel). Estimates of H versus true H for dispersional analysis for 10 realizations of the signals with N = 102, 104, and 106 points, decimal lengths, so that more points are lost from the calculation when bin sizes are larger. The regression lines for these three values of N have slopes of 0.73, 0.84, and 0.91 (and correlation coefficients r = 0.981, 0.9997, and 0.9995, and intersect the line of identity at true H’s of 0.74, 0.57, and 0.59. (The regressions, not plotted, have intercepts at H = 0 of 0.20, 0.089, and 0.051.)
Effects of Added Noise on the Estimates of the Fractal Dimension
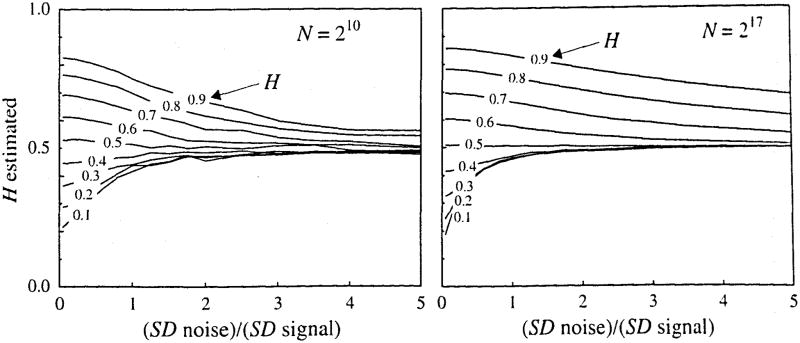
Fractal signals with H from 0.1 to 0.9 and lengths of N = 1,024 and N = 131,072 points (217 points) were used as the basis of the test. Ten sets were generated for each N and H, then Gaussian white noise signals (a fractional Brownian noise with H = 0.5) with mean zero and varied standard deviations from 5 to 500% of that of the original fractal signal were added to each, using 16 different levels of noise: (Thus, there were 16 × 9 × 10, or 1,440, noisy fractal series generated and analyzed for each of N = 1,024 and 131, 072 points.) The influence of the addition of noise to the form of the signals is shown in Fig. 9 for three levels of noise, at 50, 100, and 200%, added to the basic fractal signal with n = 1,024 points. (An addition of 100% means the added white noise has the same SD as the original signal.)
FIGURE 9.
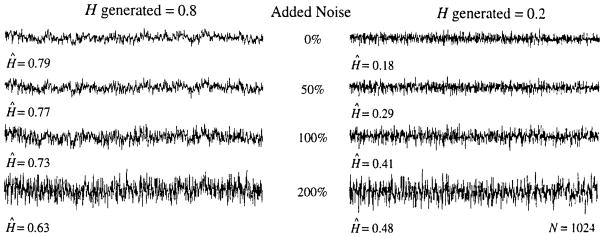
Signals generated for N = 1024 for H = 0.8 (left panel) and H = 0.2 (right panel) and N = 1024 without noise (top series in each panel) and with added noise (lower three series of each panel). The estimates of H from each are given on the figure, Ĥ.
The means of the 10 estimates, Ĥ, at each level of noise are shown in Fig. 10. Added noise, which is a signal with H = 0.5, of course pushes the effective correlation toward zero and the estimate of H toward 0.5. The effect of the added noise on signals generated with H < 0.5 is strikingly greater than on those with H > 0.5. Clearly, negative correlation is more sensitive to noise, at least by this method, and any signal with noise greater than one-half of the SD of the original signal converts the signal to one which is indistinguishable from noise. Given that every method of recording data has some noise associated with it, it is clear that every effort must be made to obtain noise-free data if the underlying process is one with H < 0.5 and negative point-to-point correlation. It is particularly interesting to note that for signals with H = 0.1, the estimates from series with N = 131,072 points are biased more toward Ĥ = 0.5 by the addition of smaller amounts of added Gaussian white noise than are signals with N = 1024 points, that is, the evidence of the negative near-neighbor correlation is more nearly obliterated.
FIGURE 10.
Mean estimates, Ĥ, for 10 fractal signals with added Gaussian white noise. The SD of the added noise is given on the abscissa as a ratio relative to the SD of the pure fractal signal. For both short and long signals the noise is more destructive to signals with negative near-neighbor correlation (H < 0.5) than it is to signals with positive near-neighbor correlation (H < 0.5).
In contrast, but in accord with expectation, of the signals that have positive point-to-point correlation, those with the larger N retain their correlation better in the face of the noise: the estimates of H remain closer to the true values at higher noise levels for N = 217 than for N = 210. In particular, for values of H near 0.7 and for the long signals the estimates of H are well determined from a single realization and are only moderately degraded with an increment of even 100% added Gaussian noise. (This invites some exploration with respect to developing a method for defining what fraction of the signal is noise and what is fractal, or more generally, to explore the possibility that a signal is a sum of two fractal signals.)
In summary, the method of dispersional analysis is quite noise resistant for signals with H > 0.6, while for signals with H < 0.5 the method fails readily in the presence of added noise. To generalize further, in assaying combinations of two fractional Brownian noises, methods for estimating a single Ĥ must be biased toward that of the signal with the higher Hurst exponent.
DISCUSSION
Dispersional analysis of one-dimensional signals was done first as an approximate approach to the analysis of three-dimensional spatial signals, based on the assumption that the fractal relationship was isotropic in 3-space (1, 2). The authors did not demonstrate whether or not the assumption of isotropy was justified but they did find that, together, the values for the fractal dimension and the dispersion at a particular level of spatial resolution provided an excellent general description of the spatial heterogeneity, independent of the level of highest resolution attained. The fractal approach did two things in addition: (i) it allowed different laboratories using different methods to compare results, and (ii) it provoked exploration for the basis of the self-similarity in the biological system.
Neither the original nor subsequent papers by the users of the technique provided clear definitions of the limitations or accuracy of the approach, a deficiency rectified to a large extent by this study. However, many other assessments of the power of the technique remain to be undertaken, and we will try to outline those that seem most important.
These are the strengths of dispersional analysis in analyzing a one-dimensional signal:
It provides a characterization of the variance, independent of particular scales of resolution.
The variance description differs from simply measuring the variance at any particular level of resolution in that it accounts for local changes in levels that might otherwise be ascribed to nonstationarity, even though the signal is a stationary fractal. (Demonstrating this has not been a feature of this study, but could be done by looking at the local variances as a function of a moving window of a length that is short compared to the total signal length.)
The observation that the dispersion is fractal forces one to recognize that there is correlation in the data set, and therefore provokes studying the signal sources to determine the nature of the system determining the correlation.
The method is quite robust, in three senses: (1) good information is obtainable from series as short as 128 or 256 points, (2) biases in the estimated Hurst coefficient are not great, and (3) the method is not highly sensitive to noise. The last point is worth emphasis: one can see from Fig. 10 that random (white) noise with a standard deviation of even 50% of the signal standard deviation has very little effect on the estimated Ĥ when the signal elements are positively correlated, i.e., when the H of the pure signal is greater than 0.5. Hopefully, most signals are acquired with less than 10% noise, so the effect on Ĥ is small. The opposite is true for negatively correlated signals with H < 0.5, as their negative correlation is readily degraded by the presence of even 20% noise, and almost totally lost in the presence of 100% noise.
The dispersional method for estimating the fractal D and Hurst H is less subject to bias than is Hurst rescaled range analysis, as assessed by Bassingthwaighte and Raymond (6). Further, better precision in the estimates of Ĥ are obtained for short time series, which means that if there is not recognizable noise, one can (presumably) make corrections for the systematic biases found with short signal lengths. We do not know the comparative susceptibility to noise.
The generalization of the observations of Fig. 10 on the effects of admixture with white noise is that the signals with higher near-neighbor correlation dominate over those with less positive correlation. This presages difficulties for those who would try to assess complex fractional Brownian noise signal composed of more than one pure fractal signal.
The Hurst rescaled range method provides some degree of predictability of the integral of the signal (6). This was the incentive for Hurst to define his method of analysis originally (14, 15, 18), namely to answer, for example, the question of how high to build the Aswan High Dam in order to contain the accumulated rainfalls over the years in order to level out the annual flows of the Nile river through Egypt and to avoid floods. If our dispersional analysis method is generally better than the Hurst method, then in principle one might expect that a method of prediction derived from it would also be superior, but we don’t know if this is true and this is a subject for further research. Mandelbrot and Wallis, in a series of five papers referred to by Bassingthwaighte and Raymond (6), presented a broad assessment of the Hurst method.
Another method related to dispersional analysis is “Fano factor” analysis (25), also known as the variable bandwidth method (24). In this method one averages the variances over short records and over successively longer records. The fractal dimension D is equal to the slope of the relationship between log(variance) and log(record length). Thus, it carries the same type of information as does rescaled range analysis or dispersional analysis. This technique has been evaluated for the effects of record length, but not for its dependence on the value of the mean, or the effects of noise, so such studies should be undertaken before Fano factor or variable bandwidth analysis is either accepted or rejected. Schmittbuhl et al.(24) shows that it is a stronger technique than either box analysis or caliper (or divider) analysis (22), neither of which is suited to self-affine signals but which are suited to self-similar functions.
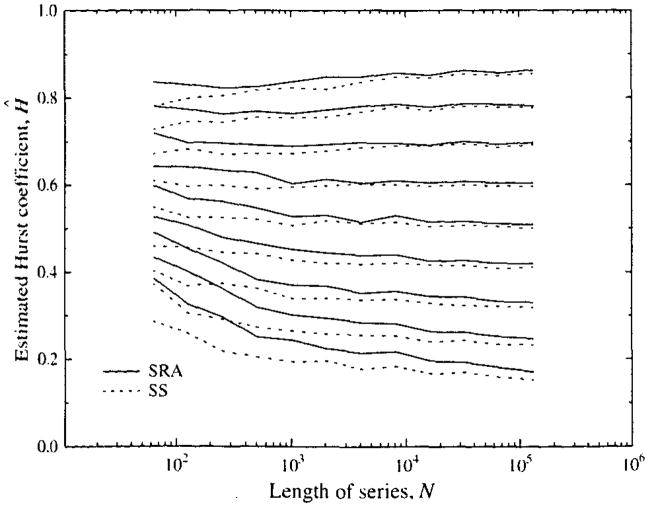
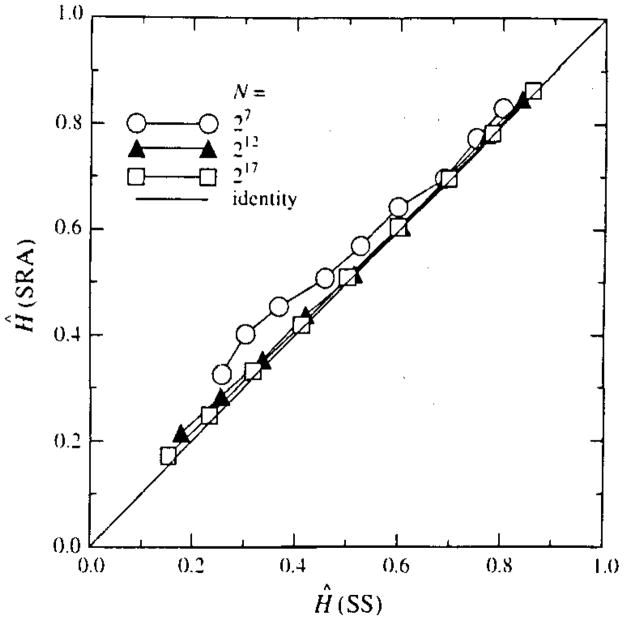
A question remaining is how much of the bias at very high H, above 0.8, or at very low H, below 0.3, is due to inadequacy in the method of analysis rather than an inaccuracy in the form of the signal generated by the two spectral synthesis methods. The study by Schepers et al. (23) making comparisons between different methods of both synthesis and analysis did suggest that there might be differences in the signals generated by spectral synthesis, used in the present study, and by successive random additions, SRA, another standard method (21). To test for this possibility, 100 series of lengths 26 to 220 were also generated using the SRA method for each H from 0.1 to 0.9; this gave a set of estimates of Ĥ over the identical set of (N, H) points of Fig. 6 (which used SS) except for the method of signal generation. The results, shown in Fig. 11, were similar to those in Fig. 6 for signals with H ≥ 0.5, but are biased upward in estimated Ĥ compared with SS-generated signals when N is small and H < 0.5. This is shown also by the comparison between Ĥ (SS) and Ĥ (SRA) in Fig. 12. At this point, we do not have evidence that the signal generating methods are wrong. However, one should remain a little suspicious since, like Schepers et al. (23), we find similar biases in the estimated Ĥ’s on the two methods of signal generation, SS and SRA. Perhaps the methods of generation are both wrong, or both the dispersional and Hurst analysis are wrong, or the methods of generating and analyzing are all a little wrong.
FIGURE 11.
Means of 100 estimates of the Hurst coefficient for fractal time series generated by the successive random addition method (SRA,——) and by spectral synthesis (SS,-----).
FIGURE 12.
Comparison of means of 100 estimates of Ĥ by dispersional analysis on signals generated by the methods of successive random additions (SRA, ordinate) with estimates of Ĥ on signals generated by spectral synthesis (SS, abscissa) for signals intended to have H = 0.1, 0.2, …, 0.9.
The SS8 signal-generating method should be used in order to avoid “end effects” due to the basic SS method which produces a signal where in effect the last point is nearest-neighbor to the first point and the correlation between these points is given by r1 = 23−2D − 1 or r1, = 22H−1 − 1. The SS method generates a circular array, so to speak. The results of generating signals only up to j = N/2 is that the power spectrum of the noise gives a curvilinear relationship between log(power) and log(frequency) having a power law slope of 2H − 1 at low frequencies (as it should) and then steepening gradually to have a slope of 2H + 1 at the highest frequencies (which is what is expected and observed for the motion, but which is too steep and is incorrect for a properly generated fBn).
A source of weakness must be susceptibility to nonstationarity in the signal. For example, a trend to larger or smaller mean values will increase the overall variance at all levels of resolution. (Trend correction will of course reduce this, but it may also cause us to ignore mistakenly such low frequency components of the signal.) A trend in variances will cause another type of problem in the analysis. These sources of potential error need evaluation.
Dispersional analysis is a predictor of the autocorrelation function for the time series. When an infinite time series is fractal the correlation falloff as a function of the distance between elements is given by Eq. 11. The integer interval between neighbors, n in Eq. 11, may be replaced by a noninteger, x, defined as true distance divided by the distance between centers of neighboring elements. The derivation is given by Bassingthwaighte and Beyer (5) following the presentation of the ideas by Mandelbrot and van Ness (19). We have not attempted in this study to make a direct comparison of the accuracy of the estimates of Ĥ from dispersion versus autocorrelation, but this needs doing. A shortcoming in Eq. 11 is that it applies to infinite length fractals only. The autocorrelation falls off faster for signals of finite length: correlation for points spaced at distances longer than half the total signal length are negative, whereas for infinite fractal signals with H > 0.5 there is never negative correlation. A new theory for the autocorrelation function for short fractal signals needs to be developed.
We have similar feelings of insecurity about some of the other methods for fractal time series analysis. In general, the feeling that further documentation of the methods is required applies to methods for analyzing signals due to deterministic chaos. The same issues of signal length, nonstationarity, influences of noise, and whether or not a single process is the basis of the signal (as opposed to a multicomponent signal) apply to chaotic or fractal signals. The technique used by Yamamato et al.(27,28,29), called coarse graining spectral analysis, ought in principle to be simpler than defining a mixture of two fractal signals or the combination of a chaotic and fractal signal; they attempt to separate a simple periodic signal from a fractal signal. An assessment of this technique would also include the influences of signal length, relative amplitudes of fractal and periodic components, and of white noise. Then we will have a better idea of the reliability of the approach.
There is also a need to make detailed comparisons on known signals in order to determine which of the various techniques are preferred under given circumstances. Perhaps one should provide a computer program that runs all of the various methods on a data set and gives the user a set of answers. When this hypothesized program is fully developed then maybe it can also provide measures of the relative reliability of the several techniques in assessing the characteristics of the data set.
CONCLUSION
Dispersional analysis is a relatively robust method of analysis of one-dimensional signals sampled at discrete, evenly spaced time intervals. The method reveals the correlation structure in data sets, even in the presence of white noise. Biases in the estimates of the fractal dimension, D, and the Hurst coefficient, H, tend toward the value for random noise (H = 0.5 or D = 1.5 for one dimension), but these biases are mild even for signals of even a few hundred elements. Similar results are obtained on artificial signals generated by the spectral synthesis method and the successive random addition method for times with H > 0.5. The spectral synthesis method for time series generation avoids bias due to correlation between the ends when a segment to be analyzed is taken as an internal section of a much longer time series.
Acknowledgments
The authors appreciate the help of James E. Lawson in the editing of the manuscript and figures. The code for signal generation and analysis is available by anonymous ftp to nsr.bioeng. washington.edu in the subdirectory pub/FRACTAL.
TERMINOLOGY
- Aj, Bj
jth coefficient in Fourier transform of Gauss( )
- β
Exponent, used as exponent for frequency where the power spectral density diminishes in proportion to frequency (i.e., density varies as 1/ωβ). For fractional Brownian motion, β = 2H + 1, and for fractional Brownian noise, β = 2H − 1
- β1β2
Skewness and kurtosis of a probability density function (and not related to the power law exponent β). β1 is third moment around the mean divided by the variance to the 3/2 power. β2 the fourth moment around the mean divided by the variance squared. Skewness different from zero indicates asymmetry. Kurtosis greater than 3.0 indicates high peakedness relative to Gaussian distribution
- D
Fractal dimension, E < D < E + 1
- Δt
Time interval between points
- E
Euclidean dimension as in one-, two-, or three-dimensional space
- fBn
Fractional Brownian noise, of which white noise is a special case with H = 0.5
- fBm
Fractional Brownian motion, the integral of fractional Brownian noise, of which classical Brownian motion is a special case with H = 0.5
- f(t)
Continuous representation of the discrete time series, fi, i = 1, 2, …, N at equally spaced intervals Δt
- F(t)
Continuous representation of the integral of f(t); the discrete time series for fractional Brownian motion is Fi, i = 1, 2, …, N and fi = Fi + 1−Fi
- Gauss( )
Gaussian random number generator with mean zero and SD = 1.0
- H
Hurst coefficient, 0 < H < 1, an indicator of smoothness in an fBn. The estimate of H is Ĥ
- m
Number of sequential points binned together to form a group
- n
Number of groups or bins (of m adjacent points each) composed out of the original series; generally m × n = N, when N is a power of two
- N
Number of points in an array
- ω
Frequency, used in power spectral analysis
- r
Correlation coefficient, r1, is the autocorrelation coefficient among pairs of nearest neighbors
- Rand( )
Uniform random number generator with an even probability, 0 < Rand( ) < 1.0
- SD
Standard deviation
- SRA
Successive Random Addition method for generating fBm
- SS, SS8
Spectral Synthesis method, and the same method beginning with a series eight times as long, then taking randomly an internal ⅛ of it
- τ
tau, period for the binning of the time series for dispersional analysis. The period τm Δt
APPENDIX: THE GAUSSIAN NATURE OF THE DISTRIBUTIONS OF THE ESTIMATES OF H
Only if the estimates of H are distributed as a Gaussian random probability density function should the standard deviations of the estimates be reported by using the mean and standard deviation. We used this standard statistical approach in drawing standard deviation bars on several of the figures and also in Table 1. In the review process, one careful reviewer raised the issue of whether or not the analysis of a fractional Brownian noise would give a Gaussian distribution of estimates, for if it did not then the statistics of identifying differences between signals would be dependent on different sets of criteria than are currently available in the literature.
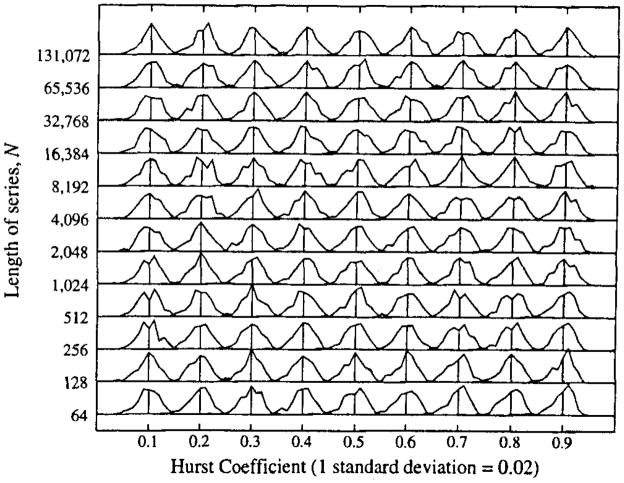
To answer this question, we analyzed the estimates from each of 100 series for each series length N from 26 to 217 and for each H from 0.1 to 0.9, for each of the two methods of signal generation, SS and SS8, a total of 216 sets of estimates from 21,600 series. For each of the 216 sets one obtains the mean, SD, skewness, and kurtosis. For Gaussian distributions the skewness β1 = 0.0 and the kurtosis β2 = 3.0.
The means of the 100 realizations using each generating method (SS and SS8) for each N, H pair are plotted in Fig. 6. Lumping together the results from the two generating methods, the standard deviations are listed in Table 1. These alone tell nothing about whether or not the pdf’s are Gaussian. Then the pdf’s for each N, H set of 200 realizations are shown in Fig. Al, where they are all normalized to their individual SD’s so that the shapes can be seen. (The actual SD’s are larger for small N, as in Table 1.) Since each pdf is composed of only 200 observations, the shapes are necessarily variable, and somewhat noisy, but they are not obviously different from Gaussian.
FIGURE A1.
Probability density functions for Ĥ for 200 realizations using 100 each generated by the SS and SS8 methods. From pdf is normalized with respect to the observed SD; the actual values of the SD’s are in Table 1, and were generally 0.01 to 0.02 for N = 217, and 0.15 to 0.2 for N = 26. The pdf’s tend to be slightly left skewed for high H and low N particularly, but are not significantly different from Gaussian distributions.
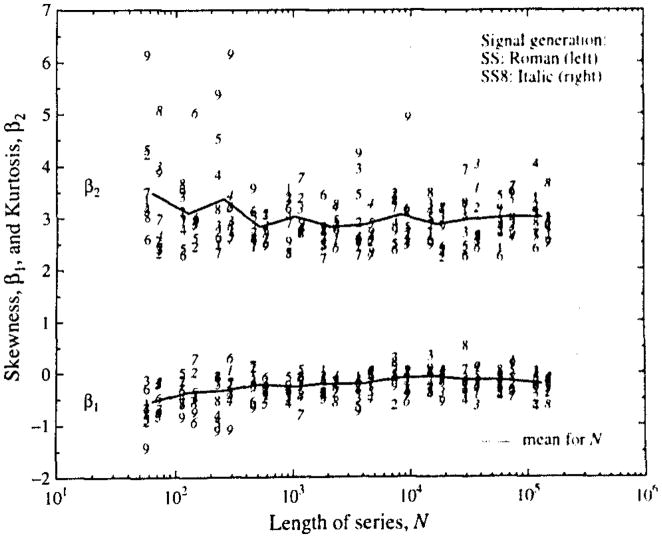
Skewness β1, and kurtosis β2 are shown in Fig. A2 for the 100 pdf’s from each of the SS and SS8 signal generating methods separately, in order to make the point that the signal generating method had a negligible effect on even these relatively sensitive parameters of the pdf’s. The mean values for skewness and kurtosis at each series length N are given by the horizontal lines between the results for the two signal generating methods, SS on the left, and SS8 on the right at each N.
FIGURE A2.
Skewness and kurtosis of the distributions of estimates of H by dispersional analysis. The abscissa is the number of points generated for each series, N. At each N, the means of the estimates of β1, and β2 from 100 series from the SS is on the left and the means from the SS8 series are on the right. The value for H used for signal generation is indicated by the ordinals 1 to 9 for H = 0.1 to 0.9. The combined mean for the 1,800 realizations from both signal generating methods for each N is indicated by the solid line joining these means.
Because the results from the SS and SS8 generating methods were not different their combined mean skewnesses and kurtosis are given in Table Al. The outliers in these analyses are the results at H = 0.9, for the skewness is more leftward, significantly so by a t test comparison against 0.0, and the kurtosis is 3.6, again statistically different by the same Gaussian statistical measure from the expected value of 3.0 for a normally distributed pdf. Apart then from the estimates of Ĥ for H = 0.9, the rest appear to have Gaussian-like statistics. Thus, for practical purposes we have reported standard deviation bars as if they were symmetrical about the mean. These skewnesses are not significantly different from zero, even for the ones most deviant from zero, those with H = 0.9 and N = 64. Another set of 100 trials using SS and a different set of seed numbers for the random number generator resulted in Ĥ’s with similar mean skewnesses which were slightly negative, and not statistically different (by t test) from either zero or the values reported in Table Al and Fig. A2.
TABLE Al.
Mean and SD’s of the estimates of skewness and kurtosis.
| Signal Generation | H | Skewness |
Kurtosis |
||
|---|---|---|---|---|---|
| Mean | SD | Mean | SD | ||
| SS Method | 0.100 | −0.114 ± 0.204 | 2.970 ± 0.434 | ||
| 0.200 | −0.227 ± 0.297 | 3.065 ± 0.509 | |||
| 0.300 | −0.157 ± 0.296 | 3.169 ± 0.379 | |||
| 0.400 | −0.352 ± 0.255 | 3.093 ± 0.454 | |||
| 0.500 | −0.264 ± 0.331 | 3.084 ± 0.753 | |||
| 0.600 | −0.205 ± 0.151 | 2.689 ± 0.400 | |||
| 0.700 | −0.192 ± 0.244 | 2.908 ± 0.515 | |||
| 0.800 | −0.198 ± 0.354 | 3.038 ± 0.405 | |||
| 0.900 | −0.481 ± 0.439 | 3.624 ± 1.140 | |||
| SS8 Method | 0.100 | −0.165 ± 0.202 | 2.900 ± 0.372 | ||
| 0.200 | −0.158 ± 0.181 | 2.858 ± 0.372 | |||
| 0.300 | −0.302 ± 0.220 | 3.072 ± 0.499 | |||
| 0.400 | −0.196 ± 0.219 | 2.887 ± 0.334 | |||
| 0.500 | −0.129 ± 0.195 | 2.835 ± 0.275 | |||
| 0.600 | −0.201 ± 0.315 | 2.998 ± 0.749 | |||
| 0.700 | −0.217 ± 0.298 | 2.911 ± 0.454 | |||
| 0.800 | −0.281 ± 0.262 | 3.154 ± 0.712 | |||
| 0.900 | −0.314 ± 0.374 | 3.329 ± 1.148 | |||
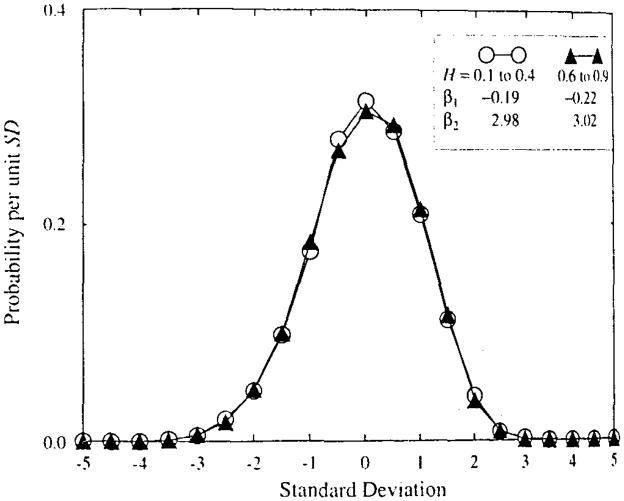
The shapes of the distributions of Ĥ are shown also in Fig. A3, where the distributions are given for all Ĥ for H’s of 0.1 to 0.4 and of 0.6 to 0.9. To do this each distribution was normalized to its mean and standard deviation and then the normalized distributions were summed together. The skewness and kurtosis for the normalized distributions are given in the figure. The idea that there is some left skewing of the distributions is affirmed by these plots, but the skewness β1, = −0.2 is small. The kurtosis is indistinguishable from the 3.0 of a Gaussian curve. We conclude that reporting means ± standard deviation is adequate to describe the distributions of estimates of H by dispersional analysis.
FIGURE A3.
Probability density functions of the estimates of H by dispersional analysis. Two hundred estimates at each H and N with 0.1 ≤ H ≤ 0.4 and 128 ≤ N = ≤ 131,072 were normalized to mean zero and SD = 1.0 and summed together to give the pdf shown by the open circles (○). Similarly, those with H’s from 0.6 to 0.9 were grouped (shown by filled triangles, ▲).
References
- 1.Bassingthwaighte JB. Physiological heterogeneity: fractals link determinism and randomness in structures and functions. New Physiol Sci. 1988;3:5–10. doi: 10.1152/physiologyonline.1988.3.1.5. [DOI] [PMC free article] [PubMed] [Google Scholar]
- 2.Bassingthwaighte JB, van Beek JHGM. Lightning and the heart: fractal behavior in cardiac function. Proc IEEE. 1988;76:693–699. doi: 10.1109/5.4458. [DOI] [PMC free article] [PubMed] [Google Scholar]
- 3.Bassingthwaighte JB, King RB, Roger SA. Fractal nature of regional myocardial blood flow heterogeneity. Circ Res. 1989;65:578–590. doi: 10.1161/01.res.65.3.578. [DOI] [PMC free article] [PubMed] [Google Scholar]
- 4.Bassingthwaighte JB, Malone MA, Moffett TC, King RB, Chan IS, Link JM, Krohn KA. Molecular and particulate depositions for regional myocardial flows in sheep. Circ Res. 1990;66:1328–1344. doi: 10.1161/01.res.66.5.1328. [DOI] [PMC free article] [PubMed] [Google Scholar]
- 5.Bassingthwaighte JB, Beyer RP. Fractal correlation in heterogeneous systems. Physica D. 1991;53:71–84. [Google Scholar]
- 6.Bassingthwaighte JB, Raymond GM. Evaluating rescaled range analysis for time series. Ann Biomed Eng. 1994;22:432–444. doi: 10.1007/BF02368250. [DOI] [PubMed] [Google Scholar]
- 7.Bassingthwaighte JB, Liebovitch LS, West BJ. Fractal Physiology. London: Oxford University Press; 1994. p. 364. [Google Scholar]
- 8.Chan IS, Goldstein AA, Bassingthwaighte JB. SENSOP: a derivative-free solver for non-linear least squares with sensitivity scaling. Ann Biomed Eng. 1993;21:621–631. doi: 10.1007/BF02368642. [DOI] [PMC free article] [PubMed] [Google Scholar]
- 9.Feder J. Fractals. New York: Plenum Press; 1988. p. 283. [Google Scholar]
- 10.Feller W. The asymptotic distribution of the range of sums of independent random variables. Ann Math Stat. 1951;22:427–432. [Google Scholar]
- 11.Glenny R, Robertson HT, Yamashiro S, Bassingthwaighte JB. Applications of fractal analysis to physiology. J Appl Physiol. 1991;70:2351–2367. doi: 10.1152/jappl.1991.70.6.2351. [DOI] [PMC free article] [PubMed] [Google Scholar]
- 12.Grant PE, Lumsden CJ. Fractal analysis of renal cortical perfusion. Invest Radiol. 1994;29:16–23. doi: 10.1097/00004424-199401000-00002. [DOI] [PubMed] [Google Scholar]
- 13.Higuchi T. Relationship between the fractal dimension and the power law index for a time series: a numerical investigation. Physica D. 1990;46:254–264. [Google Scholar]
- 14.Hurst HE. Long-term storage capacity of reservoirs. Trans Amer Soc Civ Engrs. 1951;116:770–808. [Google Scholar]
- 15.Hurst HE, Black RP, Simaiki YM. Long-term Storage: An Experimental Study. London: Constable; 1965. p. 145. [Google Scholar]
- 16.King RB, Bassingthwaighte JB. Temporal fluctuations in regional myocardial flows. Pflügers Arch (Eur J Physiol) 1989;413(4):336–342. doi: 10.1007/BF00584480. [DOI] [PMC free article] [PubMed] [Google Scholar]
- 17.King RB, Weissman LJ, Bassingthwaighte JB. Fractal descriptions for spatial statistics. Ann Biomed Eng. 1990;18:111–121. doi: 10.1007/BF02368424. [DOI] [PMC free article] [PubMed] [Google Scholar]
- 18.Mandelbrot BB, Wallis JR. Noah, Joseph, and operational hydrology. Water Resour Res. 1968;4:909–918. [Google Scholar]
- 19.Mandelbrot BB, Van Ness JW. Fractional brownian motions, fractional noises and applications. SIAM Rev. 1968;10:422–437. [Google Scholar]
- 20.Mandelbrot BB. The Fractional Geometry of Nature. San Francisco: W. H. Freeman; 1983. p. 468. [Google Scholar]
- 21.Peitgen HO, Saupe D. The Science of Fractal Images. New York: Springer-Verlag; 1988. p. 312. [Google Scholar]
- 22.Richardson LF. The problem of contiguity: an appendix to. Statistics of Deadly Quarrels. Gen Sys. 1961;6:139–187. [Google Scholar]
- 23.Schepers HE, van Beek JHGM, Bassingthwaighte JB. Comparison of four methods to estimate the fractal dimension from self-affine signals. IEEE Eng Med Biol. 1992;11:57–64. 71. doi: 10.1109/51.139038. [DOI] [PMC free article] [PubMed] [Google Scholar]
- 24.Schmittbuhl J, Vilotte JP, Roux S. Reliability of self-affine measurements. Phys Rev E. 1995;51:131–147. doi: 10.1103/physreve.51.131. [DOI] [PubMed] [Google Scholar]
- 25.Teich MC. Fractal character of the auditory neural spike train. IEEE Trans Biomed Eng. 1989;36:150–160. doi: 10.1109/10.16460. [DOI] [PubMed] [Google Scholar]
- 26.van Beek JHGM, Roger SA, Bassingthwaighte JB. Regional myocardial flow heterogeneity explained with fractal networks. Am J Physiol. 257 doi: 10.1152/ajpheart.1989.257.5.H1670. [DOI] [PMC free article] [PubMed] [Google Scholar]; Heart Circ Physiol. 1989;26:H1670–H1680. [Google Scholar]
- 27.Yamamoto Y, Hughson RL. Coarse-graining spectral analysis: new method for studying heart rate variability. J Appl Physiol. 1991;71:1143–1150. doi: 10.1152/jappl.1991.71.3.1143. [DOI] [PubMed] [Google Scholar]
- 28.Yamamoto Y, Hughson RL. Extracting fractal components from time series. Physcia D. 1993;68:250–264. [Google Scholar]
- 29.Yamamoto Y, Hughson RL. On the fractal nature of heart rate variability in humans: effects of data length and beta-adrenergic blockade. Am J Physiol. 1994;266:R40–R49. doi: 10.1152/ajpregu.1994.266.1.R40. [DOI] [PubMed] [Google Scholar]


