Abstract
Increased adipocyte size and number are associated with many of the adverse effects observed in metabolic disease states. While methods to quantify such changes in the adipocyte are of scientific and clinical interest, manual methods to determine adipocyte size are both laborious and intractable to large scale investigations. Moreover, existing computational methods are not fully automated. We, therefore, developed a novel automatic method to provide accurate measurements of the cross-sectional area of adipocytes in histological sections, allowing rapid high-throughput quantification of fat cell size and number. Photomicrographs of H&E-stained paraffin sections of murine gonadal adipose were transformed using standard image processing/analysis algorithms to reduce background and enhance edge-detection. This allowed the isolation of individual adipocytes from which their area could be calculated. Performance was compared with manual measurements made from the same images, in which adipocyte area was calculated from estimates of the major and minor axes of individual adipocytes. Both methods identified an increase in mean adipocyte size in a murine model of obesity, with good concordance, although the calculation used to identify cell area from manual measurements was found to consistently over-estimate cell size. Here we report an accurate method to determine adipocyte area in histological sections that provides a considerable time saving over manual methods.
Keywords: adipocyte, histology, paraffin embedding, diet, high fat, automation, histomorphometry, image analysis
Introduction
Unbiased approaches to the quantification of biological features in histological sections will facilitate high-throughput histomorphometry. A number of methods to assess adipocyte size and distribution have been described,1-6 but these do not provide the flexibility necessary for large-scale studies. Adipocyte size reflects adipocyte physiology, increased size being associated with compromised metabolism and the detrimental effects of obesity and type 2 diabetes.7,8 Adipose mass can expand by two mechanisms: hyperplasia (an increase in cell number) and hypertrophy (an increase in cell size).9 Automated methods would ideally determine both phenomena, allowing, for example, the effects of genetic manipulation or therapeutic intervention to be evaluated. Traditionally, individual adipocytes are measured microscopically following collagenase digestion of fat pads; however, this does not lend itself to retrospective or large-scale analysis and may lead to the loss of larger adipocytes.3 Furthermore, this method utilizes equipment not available to all laboratories and the osmium tetroxide protocol may cause cell swelling resulting in an overestimation of adipocyte size.3 Manual techniques to measure the cross-sectional area of adipocytes in histological sections were subsequently described, but these are laborious and demand discrimination, counting, and measurement of many hundreds of irregular events.4,5 This limits the number of fields that may be accurately counted in a timely fashion. More recently, manual quantification has been superseded by computational methods.1,2,6 However, some of those methods described to date are not fully automated as significant user input is required; thus the influence of human error cannot be entirely ruled out and further errors may be introduced in some of these methods as the formula used to calculate cellular area provides only an approximation. The technical issues facing the implementation of a fully-automated method are manifold as variation in staining intensities, tissue quality (particularly the fragmentation of the fragile adipocyte cell wall) and photomicrographic capture must be addressed. Moreover, an automated method must deploy a consistent set of rules in discriminating cells from artifacts, in order to minimize errors over a large number of images.
Image analysis is a multistep process. Original images must be pre-processed to improve signal-to-noise ratios and enhance feature segmentation and edge detection. Post-processing algorithms to deal with, for example, broken cells walls are essential if accurate measurements are to be made. Finally, the data must be output in a meaningful way. The method described herein uses existing principles in image analysis to provide a rapid automated determination of adipocyte size from H&E-stained histological sections. One major advantage of this technique is that it returns accurate cell area information as compared with manual methods. By comparison of our algorithm to a manual method, we were able to confirm its accuracy on adipocyte quantification in a murine model of obesity.
Results
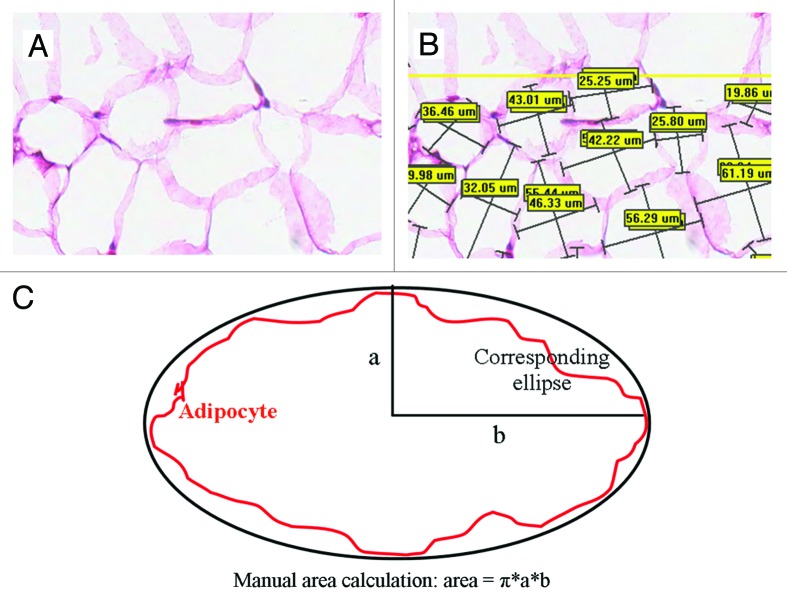
Whole-slide images were captured using a digital pathology platform (Aperio ScansScope CS). Using at least 16 representative fields of view per whole-slide image (a typical field of 160,000 µm2 is shown in Fig. 1A) manual measurements of adipocyte size were calculated. The perpendicular maximum (a) and minimum axes (b) were estimated for each adipocyte (Fig. 1B) by annotating images using Aperio ImageScope software. Adipocyte size (µm2) was approximated as the area of the ellipse whose major and minor axes are a and b, respectively, and calculated using the following equation (Fig. 1C):
Figure 1. Manual adipocyte measurement. Original H&E image of gonadal fat tissue (A). Manual annotation showing minor and major adipocyte axes (B). Diagram contrasting estimated elliptical area (black) to actual cell area (red) (C).
| Ellipse area = πab |
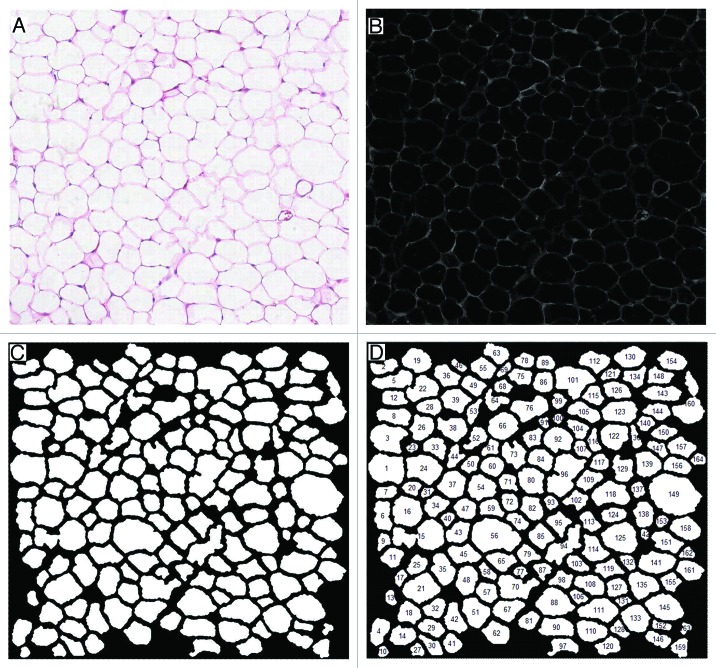
These images were then subjected to analysis with a fully-automated method. The saturation channel of the hue, saturation, value (HSV) color space clearly revealed adipocyte boundaries (Fig. 2A and B) and adipocytes were counted after extending damaged boundaries and excluding incomplete cells located at the edge of each image (Fig. 2C). The absolute area in pixels of each object was calculated and converted to µm2 (Fig. 2D).
Figure 2. Automated adipocyte size measurement. (A) Original H&E stained image. (B) Saturation channel isolated from HSV color space. (C) Binary image following intensity and morphological transformations. (D) Automated annotation.
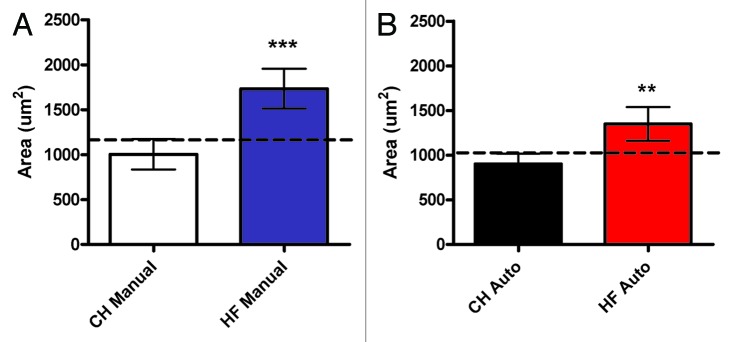
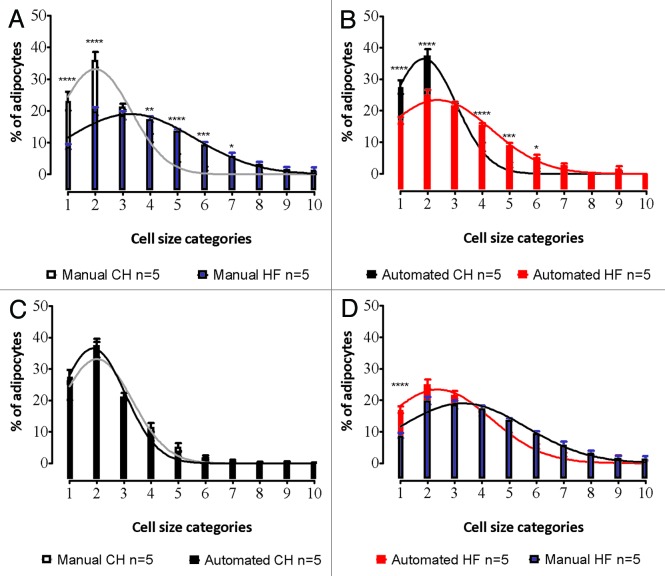
Both methods identified a significant (P < 0.01) increase in mean adipocyte size in tissue isolated from offspring of high-fat fed dams as compared with the offspring of chow-fed controls (Fig. 3). However, we found that the automated method consistently returned smaller values for cell size, the difference being exacerbated in larger cells. Specifically, the manual method returned an average fat cell size of 1004 µm2 in lean animals and 1733 µm2 in the high-fat group, compared with 901 µm2 and 1350 µm2 respectively by automated counting. This may have been as a consequence of over-estimates of area achieved with manual methods that rely on the calculation of an ellipse to approximate cell area. Specifically, ellipses are calculated from the longest axis values (which are themselves based in human judgment), as demonstrated in Figure 1C, and thus the area value obtained will consistently be a marginal over-estimate for a cell of irregular shape. In turn, this may explain the slight decrease in significance observed when diet-associated changes in fat size were assessed by the automated method compared with the manual approach. Similar changes in size distribution were observed in the offspring of high-fat fed groups with both methods (Fig. 4A and B). When the graphs of the two methods are superimposed, a slight leftward shift in the automated value is seen (Fig. 4C and D), consistent with more accurate size measurement as described above. The only point where a significant difference (P < 0.0001) was observed between automated and manual quantification (using a two-way ANOVA with a Bonferroni post-hoc test) was in the smallest size category (<500 µm2) in the offspring of the high-fat fed animals (Fig. 4D).

Figure 3. Comparison of mean adipocyte size derived from manual and automatic methods. Mean adipocyte size ± SD was calculated using at least 16 fields per whole-slide image, from at least 4 animals per group, chow (CH) of high-fat (HF) fed, using both manual ellipse measurements (A), and automatic pixel counting (B).
Figure 4. Comparison of adipocyte size distributions created using manual and automatic methods. Comparison between chow (CH) and high-fat (HF) fed adipocyte size is shown for manual (A) and automated methods (B). Cell size distributions in depots from CH animals were very similar when either manual or automated methods were used (C). Similar results were also seen for measurements from HF-diet fed animals, although an underestimation of the smallest groups (<500 µm2) was observed with manual counting, as was a slight rightward shift in the manual curve, consistent with size over-estimation (D).
Discussion
We have developed a novel automatic method to provide accurate measurements of the cross-sectional area of adipocytes in histological sections. Performance of our algorithm was consistent with routinely utilized manual methods10,11 and, moreover, we were able to establish increased accuracy in unsupervised area measurements. More specifically, we have determined that the manual method of calculating the cross-sectional area of adipocytes uses assumptions that lead to an over-estimation of cell size. The calculation assumes that adipocytes possess a regular shape, and that manual axis measurements represent the true maximal depth and width for any cell. However, we have demonstrated that this leads to an over-estimation of cell size by calculating the area of pixels within the cell boundary. Although the overall concordance between the two methods was high, we observed a statistical difference in the lowest cell size category (<500 µm2). We suggest that this is as a consequence of smaller adipocytes in the high-fat animals being more irregular in shape compared with the chow fed group, which is exacerbated by more arbitrary exclusion criteria in manual compared with computational counting, leading to a slight over-representation of adipocytes in the smallest category.
One problem facing both supervised and unsupervised methods is in determining if very large cells are truly individual objects, or arise from a loss or perturbation in separating plasma membranes. We purposefully avoided using a watershed-based method that splits large cells according to arbitrary criteria, such as that used by the freely available ImageJ Adipocytes Tool.6 We find that such methods over-estimate cells in the smallest size category. We are confident that the size distribution histograms presented in this report do not indicate an overrepresentation of cells in the largest category (which will contain any conflated groups of cells), particularly as we took steps to minimize processing artifacts during the preparation of tissue sections. Algorithmic methods to overcome problems in the analysis of histological sections with extensive fracturing of cell membranes will necessarily yield inaccurate results.
Overall we suggest that unlike manual counting and existing computational approaches, the method described herein can provide wholly-unsupervised, fast, high-throughput batch quantification of fat morphology in different states.
Material and Methods
Animals
Breeding, housing, and procedures were conducted in accordance with the UK Government Animals Scientific Procedures Act 1986 and approved by The University of Buckingham Ethical Review Board. Female offspring used in this study were generated in house from breedings of C57Bl6/J dams (Charles River) fed either standard laboratory chow containing 10% fat by energy (BK001E, B&K Universal Ltd) or a high-fat diet providing 42% calories by energy (829100, SDS Diets) throughout gestation. All mice were sacrificed at 6 weeks of age using a schedule 1 method and white gonadal adipose depots dissected for histological analysis.
Histology and image capture
Two tissues per animal (chow, n = 4 animals; high-fat, n = 5 animals) were fixed in 10% neutral buffered formalin for 6 h and dehydrated as standard before embedding in paraffin wax. Sections (4 µm) were cut and mounted on positively-charged glass slides and hematoxylin and eosin (H&E) staining was performed as standard. All tissues described in this study were processed simultaneously to minimize artifacts. Bright-field whole-slide images were captured at 40× optical magnification with an Aperio ScanScope CS instrument.
Automated size measurements
Image analysis algorithms were applied to the same images used for manual calculations, and implemented in MATLAB (R2011b, MathWorks). Images were transformed from red, green blue (RGB) color space into HSV color space. Automatic background subtraction was performed on the saturation channel only with a median filter of 71 × 71 pixels. Feature enhancement (to improve subsequent edge detection) was achieved with a Piecewise Linear Grey Level Transform (also known as gray level slicing) to enhance a specified set of gray level values.12 The resulting image was binarized to allow the application of standard morphological operations. First an open operator using a disc structuring element was used to separate connected cells by breaking connecting plasma membranes. To maintain the integrity of the cell membranes, a dilation operator with another disk structuring element was used, which helps to re-enforce boundary pixels eroded by the opening operator. Finally, the MATLAB function (imclearborder(image) was used to clear borders and so exclude incomplete cells located at the edge of the image to generate the final transformed image. Adipocytes were then counted, and the absolute pixel area of each object was calculated and converted to µm2. Just as a human operator will exclude structures that are too small to accurately classify as cells, our algorithm was designed to exclude objects <240 µm2, which may include cross-sections of fibroblastic preadipocytes,13 as artifacts. A fully functional copy version of our software is available for download (with example images) at http://webspace.buckingham.ac.uk/klanglands/ .
Statistical analysis
The number and size of adipocytes per each field of view were calculated and then summed to give values per animal comparing both manual and automatic methods. From these values either the mean size was calculated, or size distributions were plotted using 10 bins: 1 = 240–499 µm2; 2 = 500–999 µm2; 3 = 1000–1499 µm2; 4 = 1500–1999 µm2; 5 = 2000–2499 µm2; 6 = 2500–2999 µm2; 7 = 3000–3499 µm2; 8 = 3500–3999 µm2; 9 = 4000–4499 µm2; 10 > 4500 µm2. Data derived from at least four different animals is presented per chow or high-fat maternal group. Pair-wise comparisons were performed using the Student t-test, and distributions by 2-way (diet; size category) ANOVA in Prism 5 (GraphPad Software Inc.).
Acknowledgments
We thank Anita Roberts for her technical help with the husbandry of the study animals.
Glossary
Abbreviations:
- HSV
hue saturation and value
Disclosure of Potential Conflicts of Interest
No potential conflicts of interest were disclosed.
Footnotes
Previously published online: www.landesbioscience.com/journals/adipocyte/article/24652
References
- 1.Björnheden T, Jakubowicz B, Levin M, Odén B, Edén S, Sjöström L, et al. Computerized determination of adipocyte size. Obes Res. 2004;12:95–105. doi: 10.1038/oby.2004.13. [DOI] [PubMed] [Google Scholar]
- 2.Chen HC, Farese RV., Jr. Determination of adipocyte size by computer image analysis. J Lipid Res. 2002;43:986–9. [PubMed] [Google Scholar]
- 3.Hirsch J, Gallian E. Methods for the determination of adipose cell size in man and animals. J Lipid Res. 1968;9:110–9. [PubMed] [Google Scholar]
- 4.Di Girolamo M, Mendlinger S, Fertig JW. A simple method to determine fat cell size and number in four mammalian species. Am J Physiol. 1971;221:850–8. doi: 10.1152/ajplegacy.1971.221.3.850. [DOI] [PubMed] [Google Scholar]
- 5.Smith U, Sjöström L, Björnstorp P. Comparison of two methods for determining human adipose cell size. J Lipid Res. 1972;13:822–4. [PubMed] [Google Scholar]
- 6.Baecker V. MRI Adipocyte Tools. Montpellier RIO Imaging, 2012. [Google Scholar]
- 7.Trayhurn P. Hypoxia and adipose tissue function and dysfunction in obesity. Physiol Rev. 2013;93:1–21. doi: 10.1152/physrev.00017.2012. [DOI] [PubMed] [Google Scholar]
- 8.Guilherme A, Virbasius JV, Puri V, Czech MP. Adipocyte dysfunctions linking obesity to insulin resistance and type 2 diabetes. Nat Rev Mol Cell Biol. 2008;9:367–77. doi: 10.1038/nrm2391. [DOI] [PMC free article] [PubMed] [Google Scholar]
- 9.Jo J, Gavrilova O, Pack S, Jou W, Mullen S, Sumner AE, et al. Hypertrophy and/or Hyperplasia: Dynamics of Adipose Tissue Growth. PLoS Comput Biol. 2009;5:e1000324. doi: 10.1371/journal.pcbi.1000324. [DOI] [PMC free article] [PubMed] [Google Scholar]
- 10.O’Connell J, Lynch L, Cawood TJ, Kwasnik A, Nolan N, Geoghegan J, et al. The relationship of omental and subcutaneous adipocyte size to metabolic disease in severe obesity. PLoS One. 2010;5:e9997. doi: 10.1371/journal.pone.0009997. [DOI] [PMC free article] [PubMed] [Google Scholar]
- 11.Cinti S, Zingaretti MC, Cancello R, Ceresi E, Ferrara P. Morphologic Techniques for the Study of Brown Adipose Tissue and White Adipose Tissue #. T Adipose Tissue Protocols, 2001:21-51. [DOI] [PubMed] [Google Scholar]
- 12.Gonzalez RC, Richard E. Woods, digital image processing. ed: Prentice Hall Press, ISBN 0-201-18075-8 2002. [Google Scholar]
- 13.Smorlesi A, Frontini A, Giordano A, Cinti S. The adipose organ: white-brown adipocyte plasticity and metabolic inflammation. Obes Rev. 2012;13(Suppl 2):83–96. doi: 10.1111/j.1467-789X.2012.01039.x. [DOI] [PubMed] [Google Scholar]


