Abstract
We demonstrate high speed, swept source optical coherence microscopy (OCM) using a MEMS tunable vertical cavity surface-emitting laser (VCSEL) light source. The light source had a sweep rate of 280 kHz, providing a bidirectional axial scan rate of 560 kHz. The sweep bandwidth was 117 nm centered at 1310 nm, corresponding to an axial resolution of 13.1 µm in air, corresponding to 8.1 µm (9.6 µm spectrally shaped) in tissue. Dispersion mismatch from different objectives was compensated numerically, enabling magnification and field of view to be easily changed. OCM images were acquired with transverse resolutions between 0.86 µm - 3.42 µm using interchangeable 40X, 20X and 10X objectives with ~600 µm x 600 µm, ~1 mm x 1 mm and ~2 mm x 2 mm field-of-view (FOV), respectively. Parasitic variations in path length with beam scanning were corrected numerically. These features enable swept source OCM to be integrated with a wide range of existing scanning microscopes. Large FOV mosaics were generated by serially acquiring adjacent overlapping microscopic fields and combining them in post-processing. Fresh human colon, thyroid and kidney specimens were imaged ex vivo and compared to matching histology sections, demonstrating the ability of OCM to image tissue specimens.
OCIS codes: (110.4500) Optical coherence tomography; (140.3600) Lasers, tunable; (170.3880) Medical and biological imaging; (180.1790) Confocal microscopy; (180.6900) Three-dimensional microscopy
1. Introduction
Optical coherence microscopy (OCM) uses coherence-gated detection to remove out-of-focus light and improves contrast and imaging depth over conventional reflectance confocal microscopy for imaging scattering tissues [1, 2]. When used in conjunction with high numerical aperture (NA) objectives, OCM can achieve sufficient transverse resolution to provide real time visualization of both structural and cellular morphology without the need for extrinsic contrast agents. The utility of OCM to identify pathologies has been demonstrated in ex vivo studies using human breast, thyroid and renal tissue [3–6]. OCM may be a promising alternative to frozen section analysis histology for intraoperative assessment of cancer margins. Breast, lung, thyroid, and head and neck cancers would benefit from an imaging modality that enables real time assessment of surgical specimens and could reduce the rates of second surgeries from positive or close surgical margins [7–9]. OCM also has a broad range of applications for research and biological microscopy, ranging from cellular level imaging of the cortex in small animals, to in vivo imaging of developmental biology specimens [10–14].
To date, most OCM systems have used on time-domain OCT detection, which enables video-rate imaging of en face planes [3, 4]. However one limitation of time-domain OCM (TD-OCM) is that only a single coherence-gated depth is acquired. This increases the complexity of the system because both the confocal and coherence-gate depths must be carefully matched, and either the specimen or microscope must also be axially stepped to acquire data at different depths. The majority of commercial scanning microscopes use two axis galvanometer scanners where the mirrors are separated by a small distance and therefore produce a parasitic path length delay variation when the beam is scanned. This causes a curvature in the en face image surface which does not match the image plane of the objective [15]. It is possible to design a custom scanning system where the two galvanometer mirrors are relay imaged onto each other to produce a path length invariant scan. However, the majority of microscopes do not use this design. The requirement of a specially designed microscope system which has a path length invariant scanner has prevented TD-OCM from being used with many existing microscope platforms. Furthermore, the requirement of dispersion matched sample and reference arms makes changing microscope objectives and magnifications difficult using TD-OCM because the reference arm dispersion must be changed when the objective is changed.
Fourier domain detection has significant advantages over time domain detection which overcome these limitations. Fourier domain detection allows simultaneous acquisition of multiple depths, simplifying the acquisition of en face images [16]. Post-processing algorithms may be applied to Fourier domain OCM data in order to compensate for both path length variations across the scan field as well as dispersion mismatch between sample and reference arms [17, 18]. This enables swept source or spectral domain OCM to be integrated with a wide range of existing scanning microscopes.
In addition spectral information enables methods such as light scattering spectroscopy (LSS) and Fourier domain low coherence interferometry (fLCI), in which spectroscopic information is used to enhance OCM image contrast and provide quantitative information, such as nuclear size and density [19–21]. Furthermore, functional imaging methods, such as Doppler OCT, can be applied to extract blood flow and enhance visualization of vasculature [22, 23]. Finally, access to phase enables numerical correction of aberrations, as demonstrated in methods such as interferometric synthetic aperture microscopy (ISAM) [24].
Swept source OCM (SS-OCM) has several advantages over spectral domain OCM (SD-OCM). SS-OCM does not require a spectrometer or line scan camera and can be more readily extended to longer wavelengths such as 1.3 µm where tissue scattering is reduced and image depths are improved compared with shorter wavelengths. In addition, swept source enables dual-balanced detection which removes common-mode noise, and optical clocking to eliminate the need for wavenumber calibration and improve processing speeds. Since the imaging speed of swept source detection is determined by the laser sweep repetition rate rather than camera read rates as in spectral domain detection, swept source can generally achieve much higher imaging speeds. High speed is critical for OCM imaging because each pixel in the en face image requires an axial scan. A key limitation for the development of SS-OCM systems has been the lack of high speed, broadly tunable swept source light sources.
Vertical Cavity Surface-Emission Laser (VCSEL) sources can operate at MHz sweep rates, are broadly tunable at 1 µm and 1.3 µm wavelengths and are well suited for SS-OCM [25, 26]. Recently, our group demonstrated VCSEL technology for ophthalmic imaging and achieved adjustable sweep rates from 60 kHz up to 1.2 MHz [27]. In this study, we demonstrate SS-OCM using a high speed, prototype VCSEL light source operating at 1310 nm with a 280 kHz sinusoidal sweep frequency and bidirectional A-scan rate of 560 kHz (Thorlabs, Inc. and Praevium Research, Inc.). Data was acquired using optical clocking, eliminating the need for spectral resampling and significantly reduced the effects of drift and variations in the laser sweep. A tuning range of 117 nm was achieved, which provided an axial resolution of 13.1 µm in air, corresponding to ~8.1 µm (9.6 µm spectrally shaped) in tissue. Four interchangeable objectives (40X, 20X and 10X) were used to achieve transverse resolutions between 0.86 µm - 3.42 µm, over ~600 µm x 600 µm, ~1 mm x 1 mm and ~2 mm x 2 mm fields of view (FOV), respectively. Ex-vivo SS-OCM images acquired from fresh human colon, thyroid and kidney specimens were compared with corresponding histological sections to demonstrate visualization of cellular and morphological features.
2. Methods
2.1. System setup
Figure 1 shows a schematic of the SS-OCM system design. The light source output is split between optical clocking and imaging arms. Glass blanks were used in the reference arm to approximately dispersion match the optical components in the sample arm. Residual dispersive mismatch, originating from glasses used in the objective lenses, was numerically compensated in post-processing. The sample arm consisted of a collimating lens (fc = 11 mm), two-axis galvanometer scanner with 6 mm mirrors (Model 6210H, Cambridge Tech), compound scan lens (fs = 37.5 mm), compound tube lens (ft = 85 mm) and objective lens. SS-OCM images were acquired using four different objectives to trade off transverse resolution versus FOV. The objectives used were an Olympus 40X water immersion objective (40X/W, LUMPLFL 40XW/IR2, NA = 0.8), Zeiss 20X air objective (20X/air, LD Plan-Neofluar 441340, NA = 0.4), Zeiss 20X water immersion objective (20X/W, N-Achroplan 420957, NA = 0.5) and Zeiss 10X water immersion objective (10X/W, Achroplan 440039, NA = 0.3).
Fig. 1.
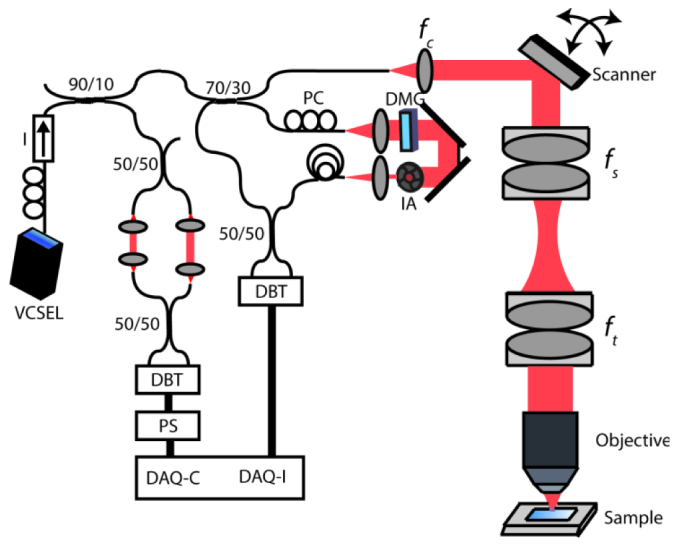
Schematic of the VCSEL SS-OCM System. Data was acquired using a dual-balanced detector with 200 MHz bandwidth. DAQ: Data acquisition card. DAQ-C: External clock channel. DAQ-I: Acquisition channel. DMG: Dispersion matching glass. IA: Iris attenuator. DBT: Dual balanced detector. PS: Pulse shaper. I: Isolator, PC: Polarization controller. Focal lengths of collimating, scan and tube lenses are fs = 11 mm, fs = 37.5 mm and ft = 85 mm, respectively.
Tissue samples were mounted in a histological cassette modified to include a coverglass imaging window. Specimens were compressed against the glass window in order to provide a flat imaging surface. After imaging, the specimens were fixed in 10% neutral buffered formalin in the cassette in order to maintain tissue orientation for histological processing.
The optical clock arm of the SS-OCM system consisted of a Mach-Zehnder interferometer (MZI) with a single pass air path length mismatch of ~5.6 mm that generated a peak sampling frequency of 400 MHz. The MZI signal was detected by a second dual-balanced detector, amplitude normalized using a Thorlabs prototype clocking circuit and used to clock the data acquisition card (DAQ Alazar 500 MHz, ATS9350, AlazarTech). The optical path lengths and electrical cable and circuit delays in the imaging arm were carefully matched to that of the MZI clock arm to ensure that the clock timing was correct.
The SS-OCM fringes were sampled linear in wavenumber, thus eliminating the need for computationally intensive time to wavenumber resampling and interpolation in post-processing [28]. Furthermore, optical clocking provides stable acquisition of fringes and is insensitive to slow drift or sweep-to-sweep variations of the light source.
An analog I/O card (NI PCI-6751, National Instruments) was used to drive the scanning mirrors and synchronize the mirror scanning with DAQ acquisition. Data acquisition and image preview were performed using custom-developed C + + software, and image post-processing was performed using MATLAB (MathWorks).
2.2. Characterization of system performance
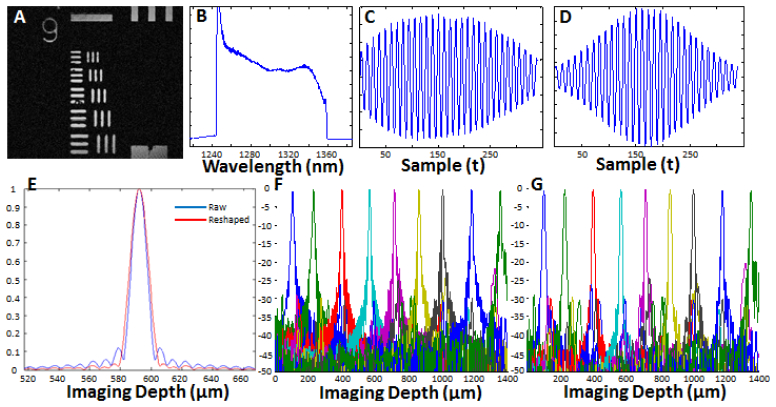
Figure 2 shows a summary of the system performance. A transverse resolution better than 2.2 µm was measured for the 40X/W objective by identifying the smallest resolvable element in an USAF 1951 resolution test chart [Fig. 2(a)], and a more accurate 1/e2 transverse resolution of 0.86 µm was measured using a knife edge [29]. Using the same method, the transverse resolutions of the 20X/W, 20X/air and 10X/W objectives were measured as 1.71 µm, 1.62 µm and 3.42 µm, respectively. The confocal parameter of the 40X/W objective was measured to be 9.4 µm (in water), which yields a very high axial sectioning resolution, but gives a very limited depth of field. The confocal parameters of the 20X water and air objectives and the 10X/W objective were measured to be 34 µm in water (20X/W), 23 µm in air (20X/air) and 119 µm in water (10X/W), respectively, which are 4 (20X/W), 3 (20X/Air) and 15 (10X/W) times the axial resolution. The FOVs for the 40X, 20X and 10X objectives were measured to be 600 µm x 600 µm, 1 mm x 1 mm and 2 mm x 2 mm, respectively.
Fig. 2.
System characterization. A) OCM image of a USAF 1951 resolution test chart acquired with the 40X water immersion objective. B) Spectrum of the VCSEL measured with an optical spectrum analyzer showing a 117 nm tuning range. C) Mirror fringe signal acquired using optical clocking. D) Spectrally reshaped fringe signal. E) Axial PSF of the raw fringe (blue line) with 11.4 µm resolution in air (~8.1 µm in tissue), and spectrally reshaped fringe (red line) with 13.5 µm resolution in air (~9.6 µm in tissue). F) Sensitivity fall-off of the VCSEL swept source obtained from the raw fringes and spectrally reshaped fringes (G), showing no significant change in the signal sensitivity across the imaging range.
The VCSEL swept source laser used in these experiments was centered at 1310 nm with a full sweep range of 117 nm [Fig. 2(b)]. Figure 2(c) shows an OCT fringe signal acquired from a mirror. The signal has no frequency chirp, consistent with optically clocked wavenumber linearization and matched dispersion between the sample and reference arms. An axial resolution of 11.4 µm in air, corresponding to ~8.1 µm (9.6 µm spectrally shaped) in tissue, was measured using the full width at half maximum (FWHM) of the point spread function (PSF) of a single reflector [Fig. 2(e)]. It should be noted that due to the re-arming time requirement of the acquisition card (256 sample clock cycles), it was not possible to acquire the full spectrum of the fringe signal, which contributed to the side lobes seen in Fig. 2(e). To mitigate this effect, spectral reshaping is performed with a Gaussian window which resulted in the fringe signal and PSF shown in Figs. 2(d) and 2(e), respectively. The axial resolution was reduced to 13.5 µm in air, corresponding to ~9.6 µm in tissue, due to the spectral reshaping process. Finally, Figs. 2(f) and 2(g) show the sensitivity falloff characteristics of the VCSEL source for the raw and spectrally reshaped fringes, where a uniform sensitivity can be observed throughout the imaging rage of the system, demonstrating the long coherence length of the light source.
The output power of the VCSEL swept source was about 40 mW and 19.8 mW was incident into the sample arm. The throughput of the 40X/W Olympus was 35% and all Zeiss objectives had a throughput of 45% and measured sensitivities were 98.1 dB and 99 dB.
2.3. OCT signal processing and display
Since OCT fringes were acquired using optical clocking, the signals were already linearly spaced in wavenumber and no resampling was necessary. To remove fixed pattern noise and any spectrally-dependent fiber optic coupler imbalance, a background spectrum, calculated by averaging 200 fringes acquired when the beam is scanned off the sample, was first subtracted from each fringe spectrum. Each OCT fringe spectrum was then divided by a median filter smoothed, averaged background spectrum envelope curve to remove any spectral modulations. Next, the fringe spectra were multiplied by a phase term to numerically correct for dispersion imbalance and Gaussian reshaped to reduce side lobes in the axial PSFs [30]. Using optical clocking with a VCSEL sweep rate of 280 kHz and a 400 MHz maximum clock frequency, 357 samples were acquired on each forward and backward sweep, which were zero padded to 2048 points prior to Fourier transformation. Finally, the fringe spectra were Fourier transformed to generate A-scans and cross-sectional OCM images. En face OCM images were generated by selecting a depth-of-interest from all cross-sectional images in a volumetric data set and a square root compression was applied to the intensity for visualization [31].
2.4. Scan delay variation correction and generation of large field mosaic images
It has been difficult to adapt TD-OCM to existing commercial scanning microscopes because the majority of these instruments use a scan design where the optical path length delay varies as the beam is scanned. One of the key advantages of Fourier domain detection is that it acquires a range of delays simultaneously and therefore it is possible to correct for this scan delay curvature in post processing, enabling use in existing scanning microscope systems. In this study, we specifically chose a beam scanning design which is similar to standard scanning microscopes in order to demonstrate this concept.
Scan delay was compensated using a calibration to extract the delay curvature of the scan, similar to the methods previously demonstrated in the literature [17, 18]. For this purpose, the reflection from the cover slip was segmented from each cross sectional frame, then a third order smoothing median filter was applied to construct the three dimensional surface profile. This profile was then used to shift each individual A-line in the image to generate an image corresponding to a flattened delay scan. As an example, Fig. 3(d) shows a surface plot from the cover slip surface taken with the 40X/W objective, where a total delay variation of >50 µm can be observed throughout the FOV. Figures 3(a)–3(c) shows the impact of the scan delay curvature on images generated from an ex vivo human colon sample using the 40X/W objective. Note that in Figs. 3(a) and 3(b), which are selected from two different depths of the same data set (~30 µm apart), different portions of the field of view are in focus. This can be clearly seen by the visualization of goblet cells at the regions where the sample is in focus (pointed by the arrows). By compensating the scan delay variation, the image shown in Fig. 3(c) is generated, which shows uniform focus throughout the FOV. Notice that in Fig. 3(c), goblet cells are visible in both of the regions highlighted in Figs. 3(a) and 3(b).
Fig. 3.
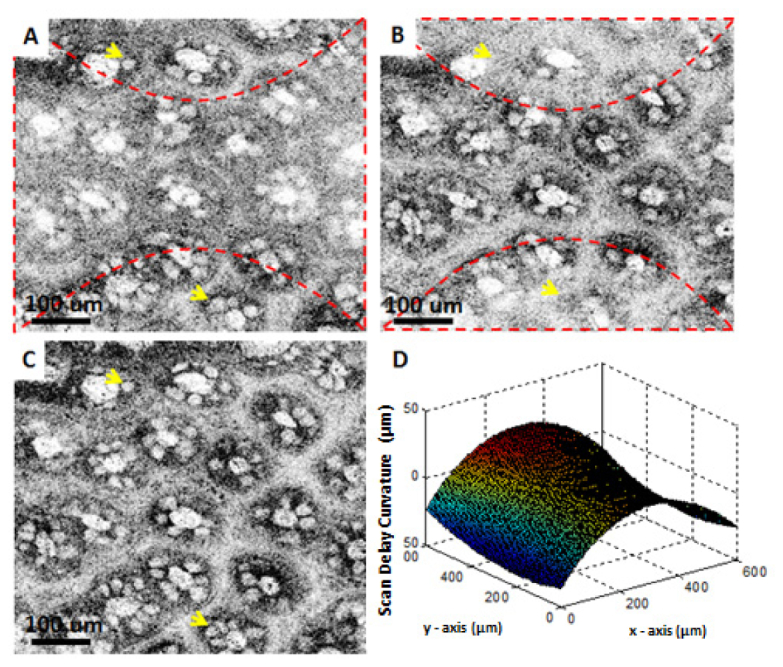
Correction of delay variation with scanning demonstrated in images of fresh human colon obtained ex vivo. (A) and (B) are from two different depths from the same data set, where (C) is the calibrated image. (D) shows a surface plot of the cover slip surface taken with the 40X/W objective. Dashed lines in (A) and (B) indicate the regions that are in focus for that particular depth. Arrows point to goblet cells.
The main disadvantage of using high magnification is that the FOV is small. One approach to overcome this limitation is to initially survey the specimen with a low magnification objective, then zoom into regions of interest by switching to a higher magnification objective. The ability to change objectives and numerically compensate dispersion is important for many applications. However, there are also applications when one wants to obtain high resolution images from the entire surface of the specimen. One method to overcome the FOV limitation is to acquire a number of small FOV images from different regions of the sample and then combine these images to generate a large FOV stitched image. This is a well-known research problem in image processing and there are many algorithms to construct seamless composite images by combining individual frames [32]. Image Composite Editor (ICE), which is a closed source, but freeware program from Microsoft, provides a reliable and robust environment for generating large field stitched images. For generating the mosaic images, ICE performs a two-step process consisting of (1) alignment of frames within each other based on image features, and (2) composition of the large field mosaic image by using several image blending algorithms such as graph-cut optimization and gradient domain image-fusion algorithms, which accounts for possible intensity and rotational variations between the overlapping fields [33, 34]. After the stitching is completed, images can be converted to a deep zoom format which produces a hierarchical scheme with different magnification levels. This format can be opened using the HD View program from Microsoft which seamlessly allows the user to pan around the images and zoom to regions of interest, producing the native high resolution view. Furthermore, the HD View program is integrated with internet browsers allowing the user to send the links of the stitched data set or the specific views to satellite locations, eliminating the need for physically transporting large amount of data. In this study we have implemented mosaic imaging by using high speed motorized stages (MTS50-Z8, Thorlabs). Individual small field images are acquired with a 50% overlap to ensure a seamless stitching by providing sufficient corresponding features between overlapping frames.
3. Results and discussion
Studies were performed under an IRB protocol approved by the Beth Israel Deaconess Medical Center and Massachusetts Institute of Technology. OCM imaging was performed ex vivo on freshly excised specimens of normal human colon as well as normal and neoplastic kidney and thyroid. All specimens used in this study were discarded and not required for clinical diagnosis. The specimens were stored in chilled Dulbecco’s Modified Eagle Medium (DMEM) and imaged within several hours after removal from the body. Prior to imaging, the specimens were immersed in a 6% acetic acid solution for ~1 minute followed by a ~30 second wash with water, in order to increase the nuclear contrast by condensing nuclear material in the cell and increasing the nuclear scattering [35]. After imaging, specimens were fixed in 10% neutral buffered formalin for a minimum of 24 hours, and then sent for standard histological processing. Histological sections were obtained along the en face planes at different depths in order to ensure correspondence with OCM images.
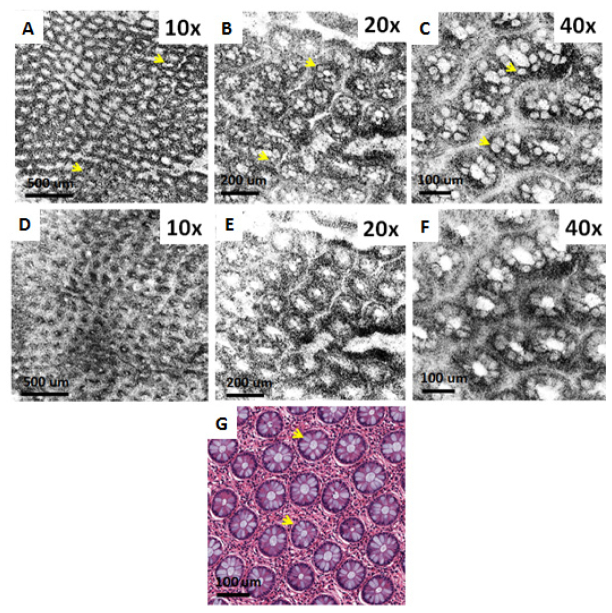
OCM images were obtained by raster scanning an area of 1024 B-scans, each consisting of 1024 A-scans. The volumetric data contained 1024 x 1024 x 1024 voxels and was acquired in ~2 seconds per data set. For the high power objectives (40X and 20X), the specimen was moved in the axial direction to set the focal plane at various depths within the first 200 µm below the tissue surface and imaging was repeated at those depths. Figure 4 shows ex vivo OCM images of a normal human colon specimen taken with three different magnification objectives, together with corresponding histology. The architectural morphology of the crypt pattern can be appreciated with the 10X objective over a relatively large FOV, whereas the 20X and 40X objectives resolve the finer details of the crypt structures. Close agreement can be observed between OCM images and the corresponding histology shown in Fig. 4(g). Note that OCM images clearly delineate the mucin secreting goblet cells residing in the crypts.
Fig. 4.
Ex vivo OCM images (A-C) and corresponding histology (G) of fresh human colon specimen obtained using the 10X/W, 20X/W and 40X/W objectives. (D-F) Show the corresponding simulated confocal images. Arrows point to goblet cells.
In addition, Fig. 4 also demonstrates the advantage of coherence gating in OCM over confocal gating employed in confocal microscopy. Simulated confocal microscopy images can be generated from the OCM volumes by summing the OCM signal over all depth ranges. This produces an image where unwanted scattered light is rejected only by the confocal gate. Figures 4(d)–4(f) show simulated confocal images which were generated from the OCM data shown in Figs. 4(a)–4(c) by summing over all axial depth. Image blurring and loss of contrast is observed in the simulated confocal images obtained with all of the magnifications. OCM can achieve much better contrast because unwanted scattered light is rejected by the coherence gating [1, 16]. The coherence gate is very effective in rejecting multiply scattered light, even in the limit where a high NA objective is used and the confocal gate is short. Although the axial resolution and the confocal parameter for the 40X objective are comparable (9.6 µm vs. 9.4 µm, respectively), there is a significant amount of unwanted scattered light which is rejected by the coherence gate. Coherence gating improves sharpness and contrast for all magnifications, although the effect is especially dramatic for low magnifications because the confocal gate is very long.
Figure 5 shows ex vivo OCM images of a fresh normal human thyroid specimen taken with three different objectives, together with corresponding histology. The architectural morphology of normal thyroid, characterized by the presence of well-organized large circular and oval follicles filled with colloid of varying densities can be seen on both OCM images and H&E histology. Similar to the images of the colon specimen, the 10X objective provides a large field of view for the general architecture of the thyroid, whereas finer details can be appreciated in the images obtained with the higher magnification objectives (20X and 40X) over a smaller FOV.
Fig. 5.
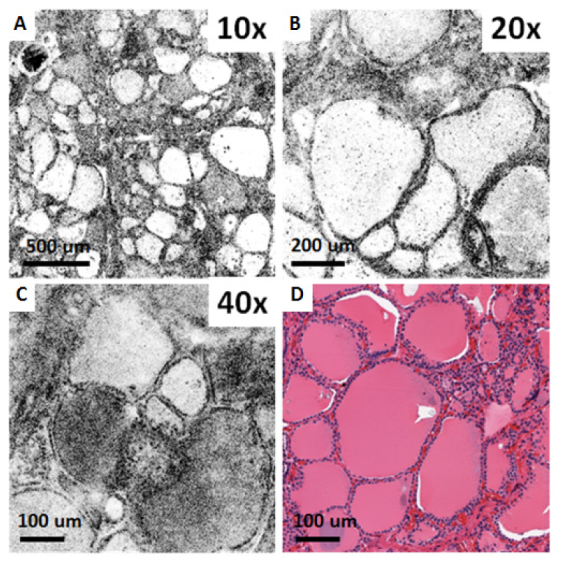
Ex vivo OCM images (A-C) and corresponding histology (D) of a fresh normal human thyroid specimen obtained using the 10X/W, 20X/W and 40X/W objectives.
Although OCM images shown in Figs. 3 to 5 are from a single depth, it is possible to extract different depths from the 3D data sets. Depending on the objective NA, multiple high resolution en face images from a ~50-150 µm depth range can be acquired simultaneously. This is analogous to serial sectioning in histology and can provide information on the three dimensional structure of tissue. This is a significant advantage over TD-OCM, as well as confocal and multiphoton system that require mechanical translation of the delay or objective to generate images from different depths. As an example, Fig. 6 shows a volumetric OCM data set from the thyroid in Fig. 5. In Figs. 6(c)–6(e) three different en face planes are selected from the same data set, 50 µm, 130 µm and 180 µm below the specimen surface. Depth-dependent features of the follicular architecture can be clearly observed in the OCM images. As shown in Fig. 6(b), cross sectional images can also be displayed.
Fig. 6.
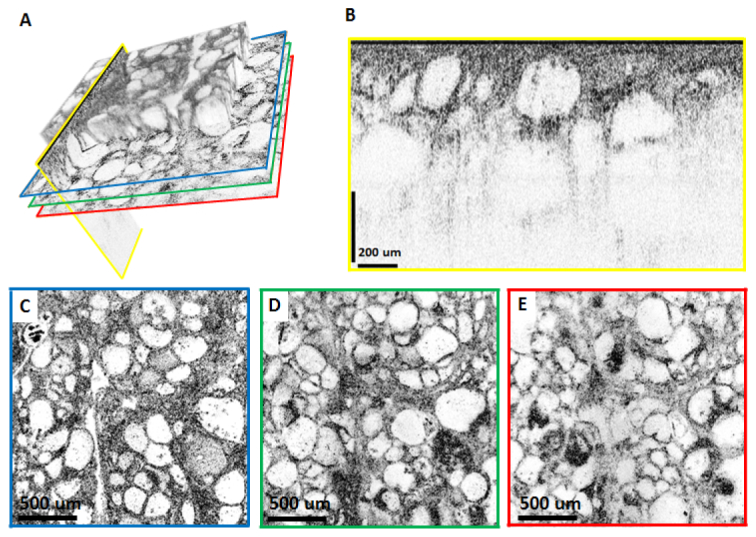
Depth resolved OCM with the 10X/W objective imaging a fresh ex vivo human thyroid specimen. (A) Volume rendering emphasizing that arbitrary planes can be selected for visualization. For the imaging planes indicated by the colored lines, reconstructed cross sectional and en face images are shown in (B-E). (C-E) are en face images from 50 µm, 130 µm and 180 µm below the surface of the specimen, respectively. The cross sectional image in (B) is displayed using logarithmic scale, whereas (C-E) are displayed using square root scale.
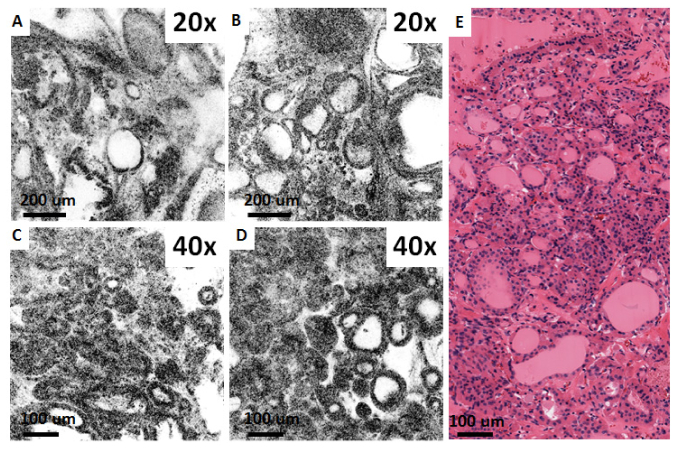
Figure 7 shows ex vivo OCM images of a fresh human thyroid specimen with a histological diagnosis of multinodular goiter, taken with the 40X/W and 20X/air objectives, together with corresponding histology. The images in Fig. 6 differ from the normal thyroid in Fig. 5 and exhibit large variation in follicle size, significant number of microfollicles, as well as numerous irregularly shaped follicles.
Fig. 7.
Ex vivo OCM images (A-D) and corresponding histology (E) from fresh thyroid specimen with a histological diagnosis of multinodular goiter, obtained using the 20X/air and 40X/W objectives.
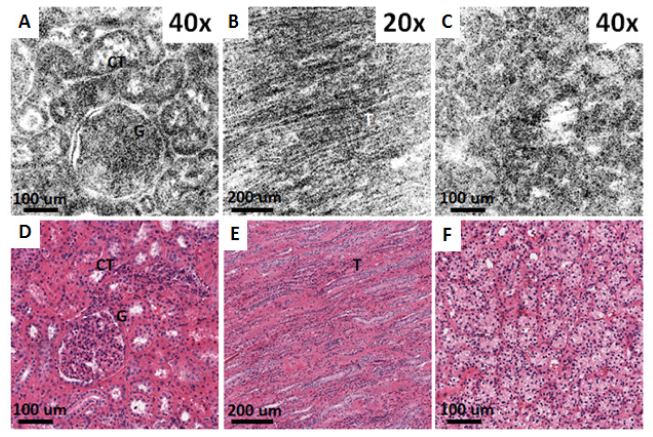
Figure 8 shows ex vivo OCM images from fresh normal and neoplastic human kidney specimens taken with the 40X/W and 20X/W objectives, together with corresponding histology. Figures 8(a) and 8(d) show a glomerulus and surrounding convoluted tubules which are characteristic of normal renal cortex. Conversely, Figs. 8(b) and 8(e), show the collecting ducts from renal medulla, seen as elongated tubular structures. Figures 8(c) and 8(f) are of a kidney neoplasm and show disruption of the normal kidney architecture with no apparent glomeruli and tubules, consistent with clear cell renal cell carcinoma (CC-RCC).
Fig. 8.
Ex vivo OCM images (A-C) and corresponding histology (D-F) from fresh normal human kidney (A, B, D, E) and clear cell renal cell carcinoma specimens (C, F) obtained using the 40X/W (A,C) and 20X/W (B) objectives. (A, D, C, F) are from renal cortex, whereas (B, E) are from renal medulla. CT: Convoluted tubules, G: Glomerulus, T: Collecting ducts.
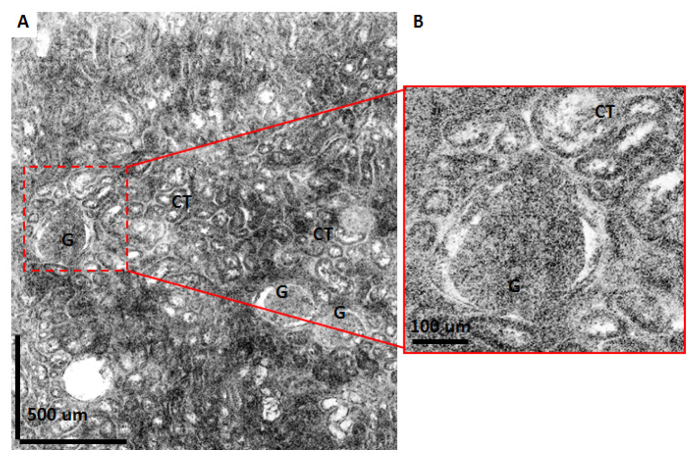
Figure 9 shows a large field of view ex vivo OCM image from a fresh normal human kidney specimen. The OCM image shown in this figure is generated by combining 30 frames taken with the 40X/W objective to obtain a 1.8 mm by 2.1 mm total field. Glomeruli and convoluted tubules can be observed throughout the imaging field, consistent with the characteristics of normal renal cortex. As previously described, the deep zoom display format allows the user to pan around the images and zoom to regions of interest enabling a more detailed examination. Figure 9(b) shows an example where a region with a glomerulus surrounded by convoluting tubules is enlarged to show finer details.
Fig. 9.
Large field mosaic OCM image of a normal human kidney specimen. Image is constructed by merging 30 frames taken with the 40X/W objective producing a total field of 1.8 mm x 2.1 mm. (B) shows a zoomed view for the region shown with dashed lines in (A). CT: Convoluted tubules, G: Glomerulus.
One disadvantage of acquiring individual square fields to construct the mosaic image is that the acquisition speed will be limited by the translation stages, which have to perform a discrete movement after acquiring each frame. For our study, this added an additional ~1 second to the acquisition of each volumetric data set. An alternative to acquiring individual square fields is to obtain long strip images by continuously translating along one axis while acquiring the image [36]. In this case the acquisition speed for the total mosaic will be mainly limited by the A-scan rate of the system. For the system employed in this study, the total time required to acquire the whole field of view shown in Fig. 9 was about ~3 to 4 minutes. This also included the time required to save the volumetric data sets to the hard drive, which constituted the main bottleneck in extending the total imaging time. Nevertheless, using solid state disc technology and improved data saving algorithms we anticipate that this time can be significantly reduced. Finally, generating the mosaic image using the ICE took about ~2 minutes on a standard dual core personal computer.
4. Conclusion
In conclusion, this study demonstrates swept source OCM imaging using a high speed swept VCSEL light source. SS-OCM has powerful advantages compared to TD-OCM. Almost all commercial scanning microscopes have a varying path length delay as the beam is scanned. This causes TD-OCM to fail because it is not possible to keep the coherence gate in the image plane as the beam is scanned. In order to use TD-OCM, it is necessary to custom design a microscope which relay images the two galvo scanner axes in order to maintain constant delay while scanning. SS-OCM solves this problem because it acquires a volumetric image over a range of path delays. As shown, it is possible to compensate path length delay variation. This means SS-OCM can be adapted to a wide range of commercial microscopes.
TD-OCM requires using matched glass thickness in the reference and sample arm. This makes it difficult to change objectives with TD-OCM, because glass in the reference arm must be changed when the objective is changed. SS-OCM has the advantage that dispersion matching can be performed numerically so that objectives can be readily changed to vary magnification and field of view. When lower NA objectives are used, SS-OCM has the advantage that it acquires multiple depth en face images simultaneously.
The study also investigates SS-OCM for pathology imaging in human tissues ex vivo. Normal and pathologic colon, thyroid and renal specimens were imaged and compared with corresponding histology to understand which features could be visualized using OCM. En face imaging has the advantage that it achieves excellent transverse image resolutions of 1 to 2 µm, enabling visualization of cellular features. Coherence gating was shown to improve image sharpness and contrast compared with confocal gating only. This improvement was observed even at high magnification, high NA imaging which had a short confocal gate. We demonstrated imaging at 1.3 µm because this wavelength has reduced scattering and improved imaging depth in biological tissue. Microscope objective transmissions are lower at this wavelength, however this is the most commonly used wavelength for imaging tissues. It is also possible to perform SS-OCM using 1 µm VCSEL light sources. This would improve the transmission through the objectives, but image penetration depth would be reduced because of increased scattering.
Although the axial resolution of the system was limited to 13.1 µm in air, corresponding to 8.1 µm in tissue (9.6 µm spectrally shaped) due to sweep range of the laser, next generation VCSELs are expected to have ~160 nm sweep range which will improve the axial resolution to <6 µm in tissue. The current study was performed with 560 kHz axial scan rates, but improvements in VCSEL sweep rates should enable >1 MHz axial scan rates. These high speeds are important because each pixel in the en face OCM image requires an axial scan.
In summary, SS-OCM is a powerful technology for real time, microscopic volumetric imaging. The ability to improve image sharpness and contrast over confocal microscopy in scattering tissues as well as the adaptability of this technology to existing commercial scanning microscope platforms are important features which promise to enable many new applications.
Acknowledgments
We gratefully acknowledge scientific contributions of Jens Peupelmann, Peter Heim, Pak Cho, Changyi Li, Scott Jobling, John Hryniewicz, Alan Donaldson, Anjul Davis and Scott Barry at Thorlabs, Inc for preparing and supplying the VCSEL module used in the study, as well as Chen D. Lu, Jonathan J. Liu, Hsiang-Chieh Lee at MIT, and Aaron D. Aguirre at the Brigham and Women’s Hospital, for discussions and technical assistance. The research was sponsored in part by the National Institute of Health R01-CA75289-17, R44-CA101067-06, R01-EY011289-27, R01-HL095717-04 and R01-NS057476-05; the Air Force Office of Scientific Research FA9550-12-1-0499 and Medical Free Electron Laser Program FA9550-10-1-0551, German Research Foundation DFG-GSC80-SAOT and DFG-HO-1791/11-1, and materials support from Thorlabs, Inc.
References and links
- 1.Izatt J. A., Hee M. R., Owen G. M., Swanson E. A., Fujimoto J. G., “Optical coherence microscopy in scattering media,” Opt. Lett. 19(8), 590–592 (1994). 10.1364/OL.19.000590 [DOI] [PubMed] [Google Scholar]
- 2.Aguirre A. D., Hsiung P., Ko T. H., Hartl I., Fujimoto J. G., “High-resolution optical coherence microscopy for high-speed, in vivo cellular imaging,” Opt. Lett. 28(21), 2064–2066 (2003). 10.1364/OL.28.002064 [DOI] [PubMed] [Google Scholar]
- 3.Aguirre A. D., Chen Y., Bryan B., Mashimo H., Huang Q., Connolly J. L., Fujimoto J. G., “Cellular resolution ex vivo imaging of gastrointestinal tissues with optical coherence microscopy,” J. Biomed. Opt. 15(1), 016025 (2010). 10.1117/1.3322704 [DOI] [PMC free article] [PubMed] [Google Scholar]
- 4.Zhou C., Cohen D. W., Wang Y., Lee H.-C., Mondelblatt A. E., Tsai T.-H., Aguirre A. D., Fujimoto J. G., Connolly J. L., “Integrated optical coherence tomography and microscopy for ex vivo multiscale evaluation of human breast tissues,” Cancer Res. 70(24), 10071–10079 (2010). 10.1158/0008-5472.CAN-10-2968 [DOI] [PMC free article] [PubMed] [Google Scholar]
- 5.Zhou C., Wang Y., Aguirre A. D., Tsai T. H., Cohen D. W., Connolly J. L., Fujimoto J. G., “Ex vivo imaging of human thyroid pathology using integrated optical coherence tomography and optical coherence microscopy,” J. Biomed. Opt. 15(1), 016001 (2010). 10.1117/1.3306696 [DOI] [PMC free article] [PubMed] [Google Scholar]
- 6.Lee H. C., Zhou C., Cohen D. W., Mondelblatt A. E., Wang Y., Aguirre A. D., Shen D., Sheikine Y., Fujimoto J. G., Connolly J. L., “Integrated optical coherence tomography and optical coherence microscopy imaging of ex vivo human renal tissues,” J. Urol. 187(2), 691–699 (2012). 10.1016/j.juro.2011.09.149 [DOI] [PMC free article] [PubMed] [Google Scholar]
- 7.Kayser K., Anyanwu E., Bauer H. G., Vogt-Moykopf I., “Tumor Presence at Resection Boundaries and Lymph-Node Metastasis in Bronchial Carcinoma Patients,” Thorac. Cardiovasc. Surg. 41(5), 308–311 (1993). 10.1055/s-2007-1013878 [DOI] [PubMed] [Google Scholar]
- 8.Fleming F. J., Hill A. D. K., Mc Dermott E. W., O’Doherty A., O’Higgins N. J., Quinn C. M., “Intraoperative margin assessment and re-excision rate in breast conserving surgery,” Eur. J. Surg. Oncol. 30(3), 233–237 (2004). 10.1016/j.ejso.2003.11.008 [DOI] [PubMed] [Google Scholar]
- 9.Binahmed A., Nason R. W., Abdoh A. A., “The clinical significance of the positive surgical margin in oral cancer,” Oral Oncol. 43(8), 780–784 (2007). 10.1016/j.oraloncology.2006.10.001 [DOI] [PubMed] [Google Scholar]
- 10.Hettinger J. W., de la Peña Mattozzi M., Myers W. R., Williams M. E., Reeves A., Parsons R. L., Haskell R. C., Petersen D. C., Wang R., Medford J. I., “Optical coherence microscopy. a technology for rapid, in vivo, non-destructive visualization of plants and plant cells,” Plant Physiol. 123(1), 3–16 (2000). 10.1104/pp.123.1.3 [DOI] [PMC free article] [PubMed] [Google Scholar]
- 11.Hoeling B. M., Fernandez A. D., Haskell R. C., Huang E., Myers W. R., Petersen D. C., Ungersma S. E., Wang R. Y., Williams M. E., Fraser S. E., “An optical coherence microscope for 3-dimensional imaging in developmental biology,” Opt. Express 6(7), 136–146 (2000). 10.1364/OE.6.000136 [DOI] [PubMed] [Google Scholar]
- 12.Choma M. A., Ellerbee A. K., Yazdanfar S., Izatt J. A., “Doppler flow imaging of cytoplasmic streaming using spectral domain phase microscopy,” J. Biomed. Opt. 11(2), 024014 (2006). 10.1117/1.2193167 [DOI] [PubMed] [Google Scholar]
- 13.Vinegoni C., Ralston T., Tan W., Luo W., Marks D. L., Boppart S. A., “Integrated structural and functional optical imaging combining spectral-domain optical coherence and multiphoton microscopy,” Appl. Phys. Lett. 88(5), 053901 (2006). 10.1063/1.2171477 [DOI] [Google Scholar]
- 14.Srinivasan V. J., Radhakrishnan H., Jiang J. Y., Barry S., Cable A. E., “Optical coherence microscopy for deep tissue imaging of the cerebral cortex with intrinsic contrast,” Opt. Express 20(3), 2220–2239 (2012). 10.1364/OE.20.002220 [DOI] [PMC free article] [PubMed] [Google Scholar]
- 15.Tang S., Krasieva T. B., Chen Z., Tromberg B. J., “Combined multiphoton microscopy and optical coherence tomography using a 12-fs broadband source,” J. Biomed. Opt. 11(2), 020502 (2006). 10.1117/1.2193428 [DOI] [PubMed] [Google Scholar]
- 16.Huang S. W., Aguirre A. D., Huber R. A., Adler D. C., Fujimoto J. G., “Swept source optical coherence microscopy using a Fourier domain mode-locked laser,” Opt. Express 15(10), 6210–6217 (2007). 10.1364/OE.15.006210 [DOI] [PubMed] [Google Scholar]
- 17.Graf B. W., Adie S. G., Boppart S. A., “Correction of coherence gate curvature in high numerical aperture optical coherence imaging,” Opt. Lett. 35(18), 3120–3122 (2010). 10.1364/OL.35.003120 [DOI] [PMC free article] [PubMed] [Google Scholar]
- 18.Graf B. W., Boppart S. A., “Multimodal In Vivo Skin Imaging with Integrated Optical Coherence and Multiphoton Microscopy,” IEEE J. Sel. Top. Quantum Electron. 18(4), 1280–1286 (2012). 10.1109/JSTQE.2011.2166377 [DOI] [PMC free article] [PubMed] [Google Scholar]
- 19.Wax A., Yang C. H., Izatt J. A., “Fourier-domain low-coherence interferometry for light-scattering spectroscopy,” Opt. Lett. 28(14), 1230–1232 (2003). 10.1364/OL.28.001230 [DOI] [PubMed] [Google Scholar]
- 20.Xu C. Y., Vinegoni C., Ralston T. S., Luo W., Tan W., Boppart S. A., “Spectroscopic spectral-domain optical coherence microscopy,” Opt. Lett. 31(8), 1079–1081 (2006). 10.1364/OL.31.001079 [DOI] [PubMed] [Google Scholar]
- 21.Tang S., Sun C. H., Krasieva T. B., Chen Z., Tromberg B. J., “Imaging subcellular scattering contrast by using combined optical coherence and multiphoton microscopy,” Opt. Lett. 32(5), 503–505 (2007). 10.1364/OL.32.000503 [DOI] [PMC free article] [PubMed] [Google Scholar]
- 22.Vakoc B. J., Lanning R. M., Tyrrell J. A., Padera T. P., Bartlett L. A., Stylianopoulos T., Munn L. L., Tearney G. J., Fukumura D., Jain R. K., Bouma B. E., “Three-dimensional microscopy of the tumor microenvironment in vivo using optical frequency domain imaging,” Nat. Med. 15(10), 1219–1223 (2009). 10.1038/nm.1971 [DOI] [PMC free article] [PubMed] [Google Scholar]
- 23.Liu G., Jia W., Sun V., Choi B., Chen Z., “High-resolution imaging of microvasculature in human skin in-vivo with optical coherence tomography,” Opt. Express 20(7), 7694–7705 (2012). 10.1364/OE.20.007694 [DOI] [PMC free article] [PubMed] [Google Scholar]
- 24.Ralston T. S., Marks D. L., Carney P. S., Boppart S. A., “Interferometric synthetic aperture microscopy,” Nat. Phys. 3(2), 129–134 (2007). 10.1038/nphys514 [DOI] [PMC free article] [PubMed] [Google Scholar]
- 25.V. Jayaraman, J. Jiang, H. Li, P. Heim, G. Cole, B. Potsaid, J. G. Fujimoto, and A. Cable, “OCT imaging up to 760kHz axial scan rate using single-mode 1310nm MEMS-tunable VCSELs with> 100nm tuning range,” in CLEO: Science and Innovations (Optical Society of America, 2011). [Google Scholar]
- 26.V. Jayaraman, J. Jiang, B. Potsaid, G. Cole, J. Fujimoto, and A. Cable, “Design and performance of broadly tunable, narrow line-width, high repetition rate 1310nm VCSELs for swept source optical coherence tomography,” in Proc. of SPIE Vol, 2012), 82760D–82761. 10.1117/12.906920 [DOI] [Google Scholar]
- 27.B. Potsaid, V. Jayaraman, J. G. Fujimoto, J. Jiang, P. J. S. Heim, and A. E. Cable, “MEMS tunable VCSEL light source for ultrahigh speed 60kHz-1MHz axial scan rate and long range centimeter class OCT imaging,” in SPIE BiOS, (International Society for Optics and Photonics, 2012), 82130M–82130M–82138. [Google Scholar]
- 28.Xi J. F., Huo L., Li J. S., Li X. D., “Generic real-time uniform K-space sampling method for high-speed swept-Source optical coherence tomography,” Opt. Express 18(9), 9511–9517 (2010). 10.1364/OE.18.009511 [DOI] [PMC free article] [PubMed] [Google Scholar]
- 29.Rajadhyaksha M., Anderson R. R., Webb R. H., “Video-rate confocal scanning laser microscope for imaging human tissues in vivo,” Appl. Opt. 38(10), 2105–2115 (1999). 10.1364/AO.38.002105 [DOI] [PubMed] [Google Scholar]
- 30.Wojtkowski M., Srinivasan V. J., Ko T. H., Fujimoto J. G., Kowalczyk A., Duker J. S., “Ultrahigh-resolution, high-speed, Fourier domain optical coherence tomography and methods for dispersion compensation,” Opt. Express 12(11), 2404–2422 (2004). 10.1364/OPEX.12.002404 [DOI] [PubMed] [Google Scholar]
- 31.A. D. Aguirre, “Advances in Optical Coherence Tomography and Microscopy for endoscopic applications and functional neuroimaging,” Ph D (Harvard-MIT Division of Health Sciences and Technology, 2008). [Google Scholar]
- 32.Szeliski R., “Image alignment and stitching: a tutorial,” Found. Trends. Comput. Graph. Vis. 2(1), 1–104 (2006). 10.1561/0600000009 [DOI] [Google Scholar]
- 33.Agarwala A., Dontcheva M., Agrawala M., Drucker S., Colburn A., Curless B., Salesin D., Cohen M., “Interactive digital photomontage,” ACM Trans. Graphic 23(3), 294–302 (2004). 10.1145/1015706.1015718 [DOI] [Google Scholar]
- 34.Winder S., Hua G., Brown M., “Picking the best DAISY,” in IEEE Conference on Computer Vision and Pattern Recognition, 2009, pp. 178–185 [Google Scholar]
- 35.Drezek R. A., Collier T., Brookner C. K., Malpica A., Lotan R., Richards-Kortum R. R., Follen M., “Laser scanning confocal microscopy of cervical tissue before and after application of acetic acid,” Am. J. Obstet. Gynecol. 182(5), 1135–1139 (2000). 10.1067/mob.2000.104844 [DOI] [PubMed] [Google Scholar]
- 36.Abeytunge S., Li Y., Larson B., Toledo-Crow R., Rajadhyaksha M., “Rapid confocal imaging of large areas of excised tissue with strip mosaicing,” J. Biomed. Opt. 16(5), 050504 (2011). 10.1117/1.3582335 [DOI] [PMC free article] [PubMed] [Google Scholar]


