

Abstract
Objective
The goal of this work was to evaluate machine learning methods, binary classification and sequence labeling, for medication–attribute linkage detection in two clinical corpora.
Data and methods
We double annotated 3000 clinical trial announcements (CTA) and 1655 clinical notes (CN) for medication named entities and their attributes. A binary support vector machine (SVM) classification method with parsimonious feature sets, and a conditional random fields (CRF)-based multi-layered sequence labeling (MLSL) model were proposed to identify the linkages between the entities and their corresponding attributes. We evaluated the system's performance against the human-generated gold standard.
Results
The experiments showed that the two machine learning approaches performed statistically significantly better than the baseline rule-based approach. The binary SVM classification achieved 0.94 F-measure with individual tokens as features. The SVM model trained on a parsimonious feature set achieved 0.81 F-measure for CN and 0.87 for CTA. The CRF MLSL method achieved 0.80 F-measure on both corpora.
Discussion and conclusions
We compared the novel MLSL method with a binary classification and a rule-based method. The MLSL method performed statistically significantly better than the rule-based method. However, the SVM-based binary classification method was statistically significantly better than the MLSL method for both the CTA and CN corpora. Using parsimonious feature sets both the SVM-based binary classification and CRF-based MLSL methods achieved high performance in detecting medication name and attribute linkages in CTA and CN.
Keywords: attribute linkages, natural language processing, multi-layered sequence labeling, clinical trial announcements, clinical notes
Objective
This work focused on the linkage detection problem in two clinical corpora, clinical trial announcements (CTA) and clinical notes (CN). The three specific aims of our research were: (1) to develop linkage detection for medications in two clinical text types relevant for clinical trial eligibility screening (trial announcements and electronic health record notes); (2) to evaluate a novel multi-layered sequence labeling (MLSL) approach in linkage detection; and (3) to test the feasibility of high accuracy linkage detection with parsimonious feature sets.
Background and significance
Because of the dismal clinical trial enrollment rates and consequent detrimental effect on drug development, facilitating clinical trial eligibility screening—for example, through automation—is a high-priority topic in biomedical informatics research.1–3 The ability to recognize medications and their corresponding attributes (such as dosage, form, and frequency) in CTA and CN is a preliminary and critical step to automate clinical trial eligibility screening. Automatic medication linkage detection is a challenging task. The Third4 and Fourth5 i2b2 workshops on natural language processing (NLP) challenges for clinical records included linkage detection or tasks that can be addressed with similar methods (eg, relation discovery). The Third i2b2 challenge task required the identification of medications as well as their dosages, modes (routes) of administration, frequencies, durations, and reasons for administration in the discharge summaries. Although the workshop did not specifically evaluate medication and attribute linkage detection, all teams treated it as the second step of the medication extraction task—detecting the entities first and then linking these entities.6–13 The Fourth i2b2 challenge task classified the relations between a pair of entities (one of the entities being ‘medical problem’) appearing in the same sentence into three categories: treatment–problem relations, test–problem relations, or medical problem (problem–problem) relations.5 The same binary classification method can also be used to address our linkage detection problem, that is, whether there is a linkage between medication entities and attribute entities or not. With an annotated data set, most teams in the Fourth i2b2 task used supervised learning methods, particularly binary classification methods, such as support vector machine (SVM), for the relation classification.14–23
In the i2b2 tasks contextual or lexical features were the most common features in most of the supervised classification systems, such as Patrick's work in the Third i2b2 task.23 Morpho-syntactic features and semantic features were considered as classification features in the Fourth i2b2 tasks.18 19 This paper treats the linkage detection task as a binary classification problem using similar token feature sets as described in Patrick's work23 as well as the part-of-speech (POS) tokens proposed in this paper. Our experiments study the binary classification performance between different feature sets, and compare the binary classification approach with other methods.
Linkages can also be detected using a semi-supervised method24 and sequence labeling for structured multi-label tasks. McDonald et al built a model smoothing the predicted labels in order to deal with nested, discontinuous, and overlapping labeling in the task of segmentation.25 Byrne addressed the nested named entity recognition challenge by transferring the nested entities into the binary classification problem.26 Alex et al proposed a method for nested entity identification using the output of a previous step as the input to the next.27 Finkel et al proposed using a discriminative constituency parser which can identify nested entities of either the same type or different types.28 These earlier works concentrated on entity recognition, while the task in our paper was linkage detection between an entity and its attributes, given the input from a previous step of entity recognition.
The Third i2b2 task (medication information extraction) used a corpus of 1249 patient discharge summaries including 696 training records (17 annotated documents) and 533 testing records. The Fourth i2b2 task (concepts and relation classification) had a corpus of 1748 patient discharge summaries, consisting of 394 annotated reports in the training set, 477 annotated reports in the testing set, and an additional 877 non-annotated reports. Xu et al built their medication information extraction system, called MedEx, using a corpus with 50 notes from the discharge summaries with annotated data for training and testing.6 The current paper will use two large annotated corpora for the evaluation—1655 CN and 3000 CTA.
Data and methods
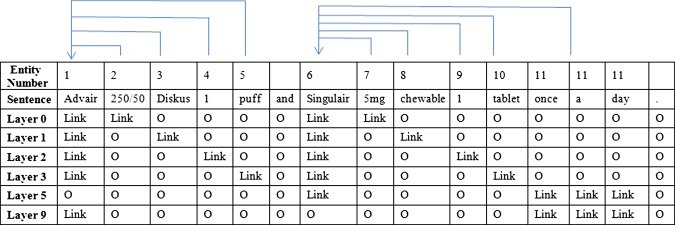
The linkage detection task associates attributes to their corresponding medication entities, assuming medications and attributes have already been identified in a prior step. For example, the algorithm will analyze the sentence: ‘Advair 250/50 diskus 1 puff and Singulair 5 mg chewable 1 tablet once a day.’ In this sentence, Advair and Singulair are the medication names, while 250/50, diskus, 1, puff, 5 mg, chewable, 1, tablet, and once a day are the attributes. In this example, 250/50, diskus, 1, and puff are the attributes of Advair, while 5 mg, chewable, 1, tablet, and once a day are the attributes of Singulair as shown in figure 1. Note that Advair is always a BID (twice a day) medication, so we did not assign once a day as an attribute of Advair.
Figure 1.

Examples of linkages between medications and their attributes. Access the article online to view this figure in colour.
We define medication entities used in the linkage detection task as either medication names or medication types. Medication names are specific names of drugs, biological substances, treatments, etc. Medication types refer to classes of drugs (eg, ‘antibiotics,’ ‘anti-inflammatory drugs,’ or ‘benzodiazapines’), types of drug therapy (‘chemotherapy’), and general references to medications (‘study drug,’ ‘other drugs,’ ‘medication’). Attributes define how much, how often, and in what form medications or medication types are taken. In this paper, we distinguished the attributes of Date, Dosage, Duration, Form, Frequency, Modifier, Route, Strength, and Status change, based on the schema of the SHARPn project.29
Data sets and gold standard
Two corpora, CTA and CN, were used for evaluating linkage detection between medications and their attributes. The CN corpus has 1655 physician notes from a stratified random sampling of 5 million notes composed by clinicians from Cincinnati Children's Hospital Medical Center during 2010. The CTA corpus consists of 3000 CTA randomly selected from 105 000 announcements on the ClinicalTrials.gov website. The study was conducted under an approved Institutional Review Board protocol for the CN. To create a gold standard, both the CN and CTA corpora were manually annotated by two annotators (native English speakers with Bachelor degrees). All notes were double annotated based on the SHARPn guideline and schema.29 The CTA corpus will be released publicly when the grant-funded period ends (December 2013).
Table 1 describes the most important descriptive statistics of the two corpora. Details of the corpora and the processes of gold standard development are thoroughly described in a paper accepted for publication.30 There are 42 854 annotated entities in CN, and 31 652 annotated entities in CTA. In CN 40% of the entities are medications and 60% are attributes, while in CTA 70% of the entities are medications and 30% are attributes. In CTA, 91% of medication–attribute linkages have two or fewer entities between medications and their attributes and less than 1% of the linkages have more than five entities between medications and their attributes. However, in CN, around 20% of linkages have more than five entities between medications and their corresponding attributes.
Table 1.
Descriptive statistics of the two corpora
| CN | CTA | |||||
|---|---|---|---|---|---|---|
| Description of corpora | ||||||
| Total no. of documents | 1655 | 3000 | ||||
| Description of entities | No. of entities | % | No. of entities | % | ||
| Total no. of entities | 42854 | 100 | 31652 | 100 | ||
| Total no. of medication entities | 16792 | 39 | 21575 | 69 | ||
| Medication | 12517 | 29 | 9968 | 32 | ||
| Medication type | 4275 | 10 | 11789 | 37 | ||
| Total no. of attributes | 26062 | 61 | 9077 | 31 | ||
| Date | 122 | 0.3 | 16 | 0.05 | ||
| Dosage | 1885 | 4 | 645 | 2 | ||
| Duration | 620 | 1 | 644 | 2 | ||
| Form | 4411 | 10 | 482 | 2 | ||
| Frequency | 4551 | 11 | 381 | 1 | ||
| Modifier | 1769 | 4 | 5827 | 18 | ||
| Route | 3237 | 8 | 893 | 3 | ||
| Status change | 2982 | 7 | 598 | 2 | ||
| Strength | 6485 | 15 | 409 | 1 | ||
| Description of medication–attribute binary linkages | ||||||
| No. of linkages | % | No. of linkages | % | |||
| Total no. of linkages | 27135 | 100 | 11127 | 100 | ||
| Date | 131 | 0.5 | 15 | 0.1 | ||
| Dosage | 1929 | 7 | 726 | 7 | ||
| Duration | 682 | 2.5 | 841 | 8 | ||
| Form | 4461 | 16 | 497 | 4 | ||
| Frequency | 4722 | 17 | 420 | 4 | ||
| Modifier | 1835 | 7 | 6520 | 59 | ||
| Route | 3306 | 12 | 962 | 9 | ||
| Status change | 3552 | 13 | 729 | 7 | ||
| Strength | 6517 | 24 | 417 | 4 | ||
| | ||||||
| Number of entities between the binary linkages of medications and attributes | ||||||
| No. of entities between two entities | No. of linkages | % | Cumulative % | No. of linkages | % | Cumulative % |
| 0 | 3927 | 14 | 14 | 1263 | 11 | 11 |
| 1 | 8681 | 32 | 46 | 6633 | 60 | 71 |
| 2 | 4740 | 17 | 63 | 2227 | 20 | 91 |
| 3 | 3212 | 12 | 75 | 589 | 5 | 96 |
| 4 | 2714 | 10 | 85 | 198 | 2 | 98 |
| 5 | 1900 | 7 | 93 | 78 | 0.7 | 98.7 |
| 6 | 1025 | 4 | 97 | 49 | 0.4 | 99.1 |
| ≥7 | 933 | 3 | 100 | 90 | 0.9 | 100 |
CN, clinical notes; CTA, clinical trial announcements.
We used approximate randomization to test the differences between the results of various system outputs. This method is not dependent on the underlying distribution of the data.31 To show statistical significance, we accepted p values as significant if they were lower than 0.05.
Binary classification-based linkage detection
Linkage detection can be addressed as a binary classification problem, that is, given a candidate pair of medication name and attribute, the classifier classifies it into the linked or not-linked category. For instance, the example in figure 1 has the linkage pairs of (Advair, 250/50), (Advair, diskus), (Advair, 1), (Advair, puff), (Singulair, per day), (Singulair, 5 mg), and so on.
The first step in dealing with linkage detection using a binary classification method was to generate candidate linkage pairs. These candidate pair sets should include as many gold standard linkage pairs as possible in order to maximize recall. One way to generate the candidate pairs is to combine all medications and attributes in a certain scope. If there are m medications and n attributes in this scope, then the number of all possible medication–attribute pair combinations is m×n. Although the use of documents as boundaries can cover all medication–attribute pairs, it will also significantly increase the number of candidate pairs. In our pilot study, CN generated 1 038 057 candidate pairs and CTA generated 170 125 candidate pairs, while line breaks for sentence segments generated more than 280 000 candidate linkage pairs, which cover 87.4% of 27 135 gold standard linkage pairs in CN, and generated more than 29 000 candidate pairs, which cover 89% of 11 127 gold standard pairs in CTA. In order to further reduce the number of candidate pairs in CN, we used two continuous spaces as sentence boundaries. This method generated 192 863 candidate pairs, which cover 87.2% of true pairs. Sections such as ‘history’ or ‘diagnosis’ in CN can further be used to detect linkage boundaries.32 When the section header was combined with two continuous spaces as sentence detectors, the system generated 148 525 candidate pairs, which cover 87.1% of the gold standard pairs. Consequently, the precision will increase slightly because the noise will decrease, but the recall will have a performance ceiling.
Good feature sets are another key issue for binary classification. Three types of features, as listed in figure 2, were used. cTAKES generated the token features and POS features. Semantic types for medications and attributes were pre-annotated by our medication entity detectors. The position relations were calculated with our scripts.
Figure 2.

Features for binary classification-based linkage detection.
In this experiment we compared the two following types of feature sets:
TOKEN: ‘Semantic’ and ‘Token’ features from figure 2 F1–F2 and F3–F7
POS: ‘Semantic’ and ‘Part-of-Speech’ features from figure 2 F1–F2 and F8–F14.
Using tokens as features, 21 847 and 18 544 unique tokens are present in the CN and CTA corpus, respectively. We used the five features listed in figure 2 F3–F7, so there were 109 257 features in CN and 92 720 features in CTA. The size of the feature set increased quickly, along with the unique tokens, in the corpus. There were 49 unique POS tags in the corpora, which combined with the features listed in figure 2 F8–F18 resulted in 539 (49×11=539) features. The size of the POS feature set is much smaller than the size of the TOKEN feature set. In addition, the POS feature set is independent from the corpus, that is, the feature set will be stable and will not change with the corpus.
The binary classification-based method can use any binary classification algorithm to detect the linkages. We evaluated SVM (LIBSVM33) and MaxEnt (MALLET34) algorithms for binary classification in order to identify a better classification algorithm for linkage detection.
Multi-layered sequence labeling-based linkage detection
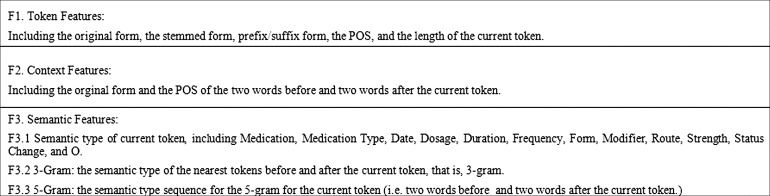
It is not intuitive to imagine linkage detection as a sequence labeling problem, not only because the same attributes can be linked to multiple medications and the same medications have multiple attributes, but also because the links overlap each other. The standard sequence labeling method requires links to be converted into BIO-encoding, where a tag is assigned to each token to indicate whether this token is at the beginning (B), inside (I), or outside (O) of a link. However, BIO-encoding is not directly applicable when tokens belong to more than one link and the links are overlapping. Therefore, we propose a MLSL model to represent the medication–attribute linkages, that is, in each layer, the linkages are modeled as an independent BIO problem. The layers are defined by the number of entities between each medication–attribute pair. The outputs of this model, trained on each individual layer, are combined by taking the union.
Figure 3 shows a representation of the linkage detection problem via the MLSL model. The layer number indicates how many entities occur between the members of the pair. For example, layer 0 means there are no additional entities between the members of the pair, that is, the medication and its attribute are right next to each other.
Figure 3.
Examples of representative medication–attribute linkages using the multi-layered sequence labeling model. Access the article online to view this figure in colour.
Feature representation for each token in the feature space for the sequence labeling model consists of token features, context features, and semantic features, as described in figure 4.
Figure 4.
Features for the multi-layered sequence labeling.
We used conditional random fields (CRF) for the sequence labeling task and applied the MALLET implementation.34 According to table 1, less than 1% of the medication–attribute pairs for CTA, and less than 5% of the pairs for CN, were in the layers higher than 7. Therefore, in the experiment, we defined layer 0 to layer 6 based on the number of entities between members of a medication–attribute pair. Layer 7 collapsed all cases of linked pairs in the same ‘catch-all-layer’ when the number of entities between members of the corresponding pairs was more than 6. The model was trained with layer 0 to layer 7. The combined output was the union of each layer's output. We also reported the cumulative precision, recall, and F-measure for each layer, that is, the results from the previous layer were combined into the next layer for the evaluation. Therefore, the results from layer n would include all the results from layer n−1, layer n−2, …., layer 0.
Results
In order to evaluate the linkage detection methods, we conducted the experiments on the task of identifying the linkages between the medication entities and nine attributes. We evaluated two machine learning approaches for linkage detection, a binary classification-based method and a MLSL method. Three standard NLP metrics to measure performance: precision (positive predictive value), recall (sensitivity), and F-measure (F), were used for the evaluation. They were defined as shown in figure 5.
Figure 5.
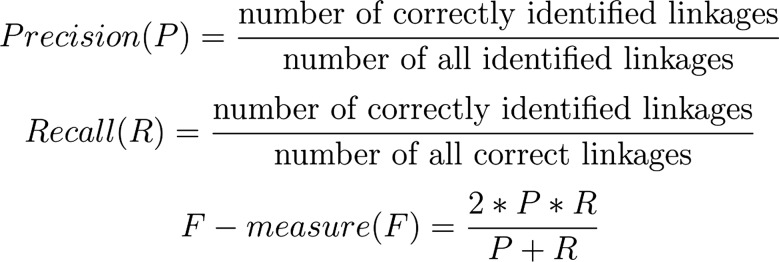
Evaluation measures.
In order to perform manual error analyses, we designated 10% of the documents as the development set, and 90% of the documents as the experimental set. For the machine learning, binary classification, and MLSL method, the standard 10-fold cross-validation was used. The results in tables 2 and 3 are the averages of the 10-fold cross-validation sets.
Table 2.
Results of binary classification-based linkage detection: TOKEN versus POS and SVM versus MaxEnt
| Corpora | Features | Method | P | R | F |
|---|---|---|---|---|---|
| CTA | TOKEN | SVM | 0.93 | 0.93 | 0.93 |
| POS | 0.82 | 0.81 | 0.81 | ||
| TOKEN | MaxEnt | 0.92 | 0.93 | 0.92 | |
| POS | 0.81 | 0.80 | 0.81 | ||
| CN | TOKEN | SVM | 0.93 | 0.94 | 0.94 |
| POS | 0.85 | 0.90 | 0.87 | ||
| TOKEN | MaxEnt | 0.93 | 0.94 | 0.93 | |
| POS | 0.81 | 0.84 | 0.83 |
CN, clinical notes; CTA, clinical trial announcements; F, F-measure; P, precision; POS, part-of-speech; R, recall; SVM, support vector machine.
Table 3.
Cumulative results of multi-layered sequence labeling linkage detection
| Corpus | CTA | CN | |||||
|---|---|---|---|---|---|---|---|
| Features | Layer | P | R | F | P | R | F |
| Unigram (Order 1) | L0 | 0.938 | 0.596 | 0.729 | 0.918 | 0.276 | 0.424 |
| L1 | 0.867 | 0.710 | 0.780 | 0.873 | 0.484 | 0.623 | |
| L2 | 0.852 | 0.721 | 0.781 | 0.848 | 0.608 | 0.708 | |
| L3 | 0.848 | 0.723 | 0.780 | 0.821 | 0.704 | 0.758 | |
| L4 | 0.847 | 0.724 | 0.780 | 0.784 | 0.771 | 0.777 | |
| L5 | 0.847 | 0.724 | 0.780 | 0.760 | 0.802 | 0.781 | |
| L6 | 0.847 | 0.724 | 0.780 | 0.749 | 0.812 | 0.779 | |
| L7 | 0.847 | 0.724 | 0.780 | 0.743 | 0.816 | 0.778 | |
| 3Gram | L0 | 0.936 | 0.599 | 0.730 | 0.925 | 0.278 | 0.427 |
| L1 | 0.864 | 0.716 | 0.783 | 0.879 | 0.494 | 0.632 | |
| L2 | 0.850 | 0.727 | 0.784 | 0.853 | 0.623 | 0.720 | |
| L3 | 0.847 | 0.729 | 0.784 | 0.827 | 0.721 | 0.770 | |
| L4 | 0.846 | 0.730 | 0.784 | 0.789 | 0.789 | 0.789 | |
| L5 | 0.846 | 0.731 | 0.784 | 0.765 | 0.820 | 0.791 | |
| L6 | 0.846 | 0.731 | 0.784 | 0.753 | 0.828 | 0.789 | |
| L7 | 0.846 | 0.731 | 0.784 | 0.748 | 0.832 | 0.788 | |
| 5Gram | L0 | 0.943 | 0.602 | 0.734 | 0.939 | 0.283 | 0.434 |
| L1 | 0.883 | 0.725 | 0.796 | 0.899 | 0.496 | 0.639 | |
| L2 | 0.869 | 0.735 | 0.796 | 0.876 | 0.622 | 0.727 | |
| L3 | 0.867 | 0.738 | 0.797 | 0.847 | 0.720 | 0.779 | |
| L4 | 0.866 | 0.739 | 0.797 | 0.806 | 0.788 | 0.796 | |
| L5 | 0.866 | 0.739 | 0.797 | 0.760 | 0.802 | 0.781 | |
| L6 | 0.866 | 0.739 | 0.797 | 0.749 | 0.812 | 0.779 | |
| L7 | 0.866 | 0.739 | 0.797 | 0.743 | 0.816 | 0.778 | |
| Order 4 | L0 | 0.956 | 0.584 | 0.725 | 0.945 | 0.267 | 0.416 |
| L1 | 0.924 | 0.724 | 0.812 | 0.917 | 0.479 | 0.629 | |
| L2 | 0.914 | 0.738 | 0.816 | 0.888 | 0.612 | 0.725 | |
| L3 | 0.913 | 0.739 | 0.817 | 0.853 | 0.712 | 0.776 | |
| L4 | 0.913 | 0.740 | 0.817 | 0.811 | 0.780 | 0.795 | |
| L5 | 0.913 | 0.740 | 0.817 | 0.786 | 0.813 | 0.799 | |
| L6 | 0.913 | 0.741 | 0.817 | 0.772 | 0.823 | 0.797 | |
| L7 | 0.913 | 0.741 | 0.817 | 0.768 | 0.828 | 0.797 | |
CN, clinical notes; CTA, clinical trial announcements; F, F-measure; P, precision; R, recall.
Baseline: rule-based linkage detection
The rule-based approach relies on the assumption that medication attributes usually belong to the medications closest to them, and those medications and their attributes most likely co-occur within a sentence boundary.35 In the Third i2b2 task,4 one of the organizers’ heuristics stated that attributes more than two lines away from the medication names should not be considered for linking, and most groups followed this instruction.8–13 However, detecting sentence boundaries could be challenging in clinical corpora. CN can be written in concise ways, such as using multiple spaces instead of punctuation to separate the different sentences. Similar challenges exist in CTA texts: new lines and line breaks often indicate the sentence boundaries. In our pilot study, we found that using line breaks as sentence boundaries can correctly detect 89% and 87% of linkage boundaries for the CTA and CN corpora, respectively. Therefore, line breaks were used to detect the medication–attribute co-occurrence boundaries for both the CTA and CN corpora, and the heuristic further limits this by linking attributes to the preceding medication in the sentence. If there was no medication in front of the attribute, then the attribute was linked to the medication that followed it within a maximum of two sentences, so that the attributes are associated to the next medication name. This method achieved 0.76 precision, 0.68 recall, and 0.72 F-measure for the CTA corpus, but only 0.46 precision, 0.37 recall, and 0.41 F-measure for the CN corpus.
Binary classification-based linkage detection
A smaller feature set for the classification problem can avoid the potential problem of over-fitting. Therefore, we expect to find that the classification that uses a parsimonious feature set can still achieve reasonably high performance. Both the SVM (linear kernel with default gamma value of 1 and cost value of 1000) and MaxEnt methods were applied for the binary classification linkage detection using the POS and TOKEN feature sets. Table 2 shows the results of the binary classification method. When the feature space is large (ie, in case of the TOKEN feature set) or the linkage structure is simple, the MaxEnt algorithm's performance is close to SVM's. In TOKEN feature experiments, the precision, recall, and F-measure of MaxEnt and SVM are 0.93/0.93/0.93 and 0.92/0.93/0.92, respectively, in CTA, and 0.93/0.94/0.94 and 0.93/0.94/0.93, respectively, in CN. In POS feature experiments, the precision, recall, and F-measure of MaxEnt and SVM are 0.82/0.81/0.81 and 0.81/0.80/0.81, respectively, in the CTA corpus. However, when the feature space is more parsimonious and the corpus structure is more complicated (ie, POS features in CN), SVM is better than MaxEnt. The precision, recall, and F-measure of SVM and MaxEnt are 0.85/0.90/0.87 and 0.81/0.84/0.83, respectively. The binary classification method, with both TOKEN and POS features for using either the SVM or MaxEnt algorithms, performs significantly better than the baseline rule -based method (p<0.01).
Multi-layered sequence labeling-based linkage detection
Different combinations of features and different CRF parameters were tested in the experiments, as shown in table 4. For the CRF algorithm itself, we also tested how many labels were considered before and after the current token, that is, the order of CRF. In the unigram system, we only considered the token before and the token after when predicting the label of the current token, that is, order=1. We increased the CRF window sizes and measured their impact on performance. With the unigram feature sets, experiments were conducted on order 1, 2, 3, 4, and 5.
Table 4.
Description of experiment groups
| Token features | Context features | Semantic type | 3Gram | 5Gram | Order | |
|---|---|---|---|---|---|---|
| Unigram | X | X | X | Order 1 | ||
| 3Gram | X | X | X | X | Order 1 | |
| 5Gram | X | X | X | X | Order 1 | |
| Order 4 | X | X | X | Order 4 |
The cumulative results of four experiments on the MLSL model are shown in table 3. The best F-measure for the unigram system is achieved at layer 2 for CTA and layer 5 for CN. Precision, recall and F-measure are 0.85/0.72/0.78, respectively, for CTA and 0.76/0.80/0.781, respectively, for CN. We notice that, although recall kept rising with the number of layers, precision also dropped. Both corpora achieved the best F-measure results at the layer that cumulatively covered 90% of the linkages; that is, layer 2 for CTA and layer 5 for CN, in both the unigram and 3Gram systems. The 5Gram feature set provided 0.87/0.74/0.80 precision, recall, and F-measure for the baseline system, respectively, for the CTA corpus in layer 3, and 0.81/0.79/0.80 precision, recall, and F-measure, respectively, for the CN corpus in layer 4. The best result was on order 4. Precision, recall and F-measure were 0.913/0.739/0.817, respectively, for the CTA corpus and were achieved at layer 3. For the CN corpus, the best result was achieved at layer 4 with precision, recall and F-measure being 0.786/0.813/0.799, respectively.
The best performing MLSL method (order 4) is statistically significantly better than the rule-based method (p<0.01). However, the best performing binary classification method (SVM with TOKEN features) is significantly better than the MLSL method (p<0.01) for both the CTA and CN corpora.
Discussion
In CTA, the most frequent linkage is Modifier (59% of linkages), the least frequent linkage is Date (less than 1%), and the other types of linkages are each less than 10% (ranging from 4% to 9%). In CN, the most frequent linkage is Strength (24%), while the two least frequent linkages are Date and Duration (less than 1% and 3%, respectively). The other types of linkages range from 7% to 24%.
In CTA, most medication–attribute linkages have none or one or two entities between the medication and its next attribute. These linkages cover 91% of all linkages, with less than 1% of the linkages having more than five entities between medications and their attributes. In CN, the number of entities between medications and their attributes is more evenly distributed than in CTA, although approximately 20% of the linkages have more than five entities between medications and their corresponding attributes.
Comparison of the results of the baseline rule-based method with the results of the machine learning methods shows that the machine learning methods (both the classification and labeling methods) perform statistically significantly better than the rule-based method. We found that binary classification-based linkage detection with the TOKEN features performs better than with the POS feature set in both the CTA and CN corpora. The TOKEN feature set can achieve 0.93 F-measure with around 100 000 features, while the POS feature set can achieve 0.81 F-measure for CTA and 0.87 for CN with far fewer (less than 500) features. However, this is not surprising considering that the feature space of the TOKEN set is 200 times larger than the POS set. Some tokens that strongly indicate the linkages, such as tablet, obviously contribute to the classifier. Although a high F-measure is important, the huge feature space makes that model prone to over-fitting.
The number of linkage pairs in CN is three times the number of pairs in CTA. Therefore, we infer that large training data for the SVM method with POS features will help improve performance, but it is not necessarily true for the SVM method with TOKEN features.
Comparison of the feature sets of unigram, 3Gram, and 5Gram for the MLSL method shows that both the 3Gram and 5Gram feature sets performed better than the unigram system, with 5Gram performing better than 3Gram. This means that increasing the window size of n-gram semantic types will help to improve the performance of the MLSL method.
The MLSL method had its best performance of 0.82 F-measure for CTA with order 2 and 0.80 for CN with order 4. As expected the higher order model helps to improve MLSL performance. This result was better than the SVM method with the POS features for CTA but not for CN. Since 90% of pairs in CTA are in layer 0, 1, and 2, but only 60% of pairs in CN are in the same layers, we argue that the more complicated structure of CN can explain why the MLSL method performs better on CTA and why the higher order (4) is needed for the best performance from CN.
Because we use the number of entities between the linkage pairs to define the layers in the MLSL model, the models in each layer are independent from each other. This independence can help modeling of the overlapping linkage labels. However, our current approach misses the information for the connections between different layers, that is, the next layer could use the linkage detections from the previous layer, but we did not implement this feature. Consequently, our current approach loses some of the advantage of sequence learning, that is, the predictions in the previous stage can help to predict the labels in the next stage. In our future work, we would like to expand the model for cumulative sequence learning and to link other clinically relevant entities and attributes (eg, diagnoses and their modifiers).
Conclusion
The purpose of this research was to detect the linkages between medications and their corresponding attributes. We used two corpora, CN and CTA. CN has higher linkage density and more complicated linkage structures than CTA. We explored the features for the binary classification method and were able to define a parsimonious feature set, POS features, for linkage detection to avoid potential over-fitting problems while preserving a reasonably high performance. The results indicated that this method achieves 0.81 F-measure for CN and 0.87 F-measure for CTA with only approximately 500 features. We proposed a MLSL model for the linkage detection problem, which decouples the multi-label problem into layers; each layer only deals with one type of label and the labels in each individual layer are continuous and sequential. The experiment indicates that the performance of this approach is close to that of the SVM method with POS features.
Acknowledgments
We appreciate the suggestions of the anonymous institutional review board (IRB) members who approved our IRB protocol and the suggestions of three anonymous reviewers for our HISB 2012 conference submissions.
Footnotes
Contributors: QL designed the study and ran approximately 80% of the experiments, analyzed the results, created the tables and figures, and contributed to the draft and final manuscript. LD provided guidance in the gold standard vetting process and supervised the development of the gold standard. MK and LS conducted the entire annotation task. HZ and TL contributed ideas for algorithm development, made useful suggestions, and each ran 10% of the experiments. This project was supervised by IS. This manuscript was prepared by QL, TL, and IS with additional contributions by all authors. All authors read and approved the final manuscript.
Funding: The authors and annotators were supported by internal funds from Cincinnati Children's Hospital Medical Center. IS and LD were partially supported by grants 5R00LM010227-04, 1R21HD072883-01, 1U01HG006828-01, and 3U01HG006828-01S1.
Competing interests: None.
Ethics approval: This study was approved by the Institutional Review Board.
Provenance and peer review: Not commissioned; externally peer reviewed.
Open Access: This is an Open Access article distributed in accordance with the Creative Commons Attribution Non Commercial (CC BY-NC 3.0) license, which permits others to distribute, remix, adapt, build upon this work non-commercially, and license their derivative works on different terms, provided the original work is properly cited and the use is non-commercial. See: http://creativecommons.org/licenses/by-nc/3.0/
References
- 1.Winer E, Gralow J, Diller L, et al. Clinical cancer advances 2008: major research advances in cancer treatment, prevention, and screening—a report from the American Society of Clinical Oncology. J Clin Oncol, 2009;27:812–26 [DOI] [PMC free article] [PubMed] [Google Scholar]
- 2.Clinical Trial Facts & Figures: General Patient Recruitment Information, The Center for Information and Study on Clinical Research Participation (CISCRP), http://www.ciscrp.org/professional/facts_pat.html#5 (accessed 18 Jul 2012).
- 3.Tassignon JP, Sinackevich N. Speeding the critical path. Applied Clinical Trials, 2004
- 4.Uzuner Ö, Solti I, Cadag E. Extracting medication information from clinical text. J Am Med Inform Assoc 2010;17:514–18 [DOI] [PMC free article] [PubMed] [Google Scholar]
- 5.Uzuner Ö, South B, Shen S, et al. 2010 i2b2/VA challenge on concepts, assertions, and relations in clinical text. J Am Med Inform Assoc 2011;18:552–6 [DOI] [PMC free article] [PubMed] [Google Scholar]
- 6.Xu H, Stenner S, Doan S, et al. MedEx: a medication information extraction system for clinical narratives. J Am Med Inform Assoc 2010;17:19–24 [DOI] [PMC free article] [PubMed] [Google Scholar]
- 7.Doan S, Bastarache L, Klimkowski S, et al. Integrating existing natural language processing tools for medication extraction from discharge summaries. J Am Med Inform Assoc 2010;17:528–31 [DOI] [PMC free article] [PubMed] [Google Scholar]
- 8.Spasić I, Sarafraz F, Keane J, et al. Medication information extraction with linguistic pattern matching and semantic rules. J Am Med Inform Assoc 2010;17:532–5 [DOI] [PMC free article] [PubMed] [Google Scholar]
- 9.Mork J, Bodenreider O, Demner-Fushman D, et al. Extracting Rx information from clinical narrative. J Am Med Inform Assoc 2010;17:536–9 [DOI] [PMC free article] [PubMed] [Google Scholar]
- 10.Tikk D, Solt I. Improving textual medication extraction using combined conditional random fields and rule-based systems. J Am Med Inform Assoc 2010;17:540–4 [DOI] [PMC free article] [PubMed] [Google Scholar]
- 11.Yang H. Automatic extraction of medication information from medical discharge summaries. J Am Med Inform Assoc 2010;17:545–8 [DOI] [PMC free article] [PubMed] [Google Scholar]
- 12.Hamon T, Grabar N. Linguistic approach for identification of medication names and related information in clinical narratives. J Am Med Inform Assoc 2010;17:549–54 [DOI] [PMC free article] [PubMed] [Google Scholar]
- 13.Deléger L, Grouin C, Zweigenbaum P. Extracting medical information from narrative patient records: the case of medication-related information. J Am Med Inform Assoc 2010;17:555–8 [DOI] [PMC free article] [PubMed] [Google Scholar]
- 14.Bruijn B, Cherry C, Kiritchenko S, et al. Machine-learned solutions for three stages of clinical information extraction: the state of the art at i2b2 2010. J Am Med Inform Assoc 2011;18:557–62 [DOI] [PMC free article] [PubMed] [Google Scholar]
- 15.Aberdeen J, Coarr M, Tresner-Kirsch D, et al. MITRE system for clinical assertion status classification Cheryl Clark. J Am Med Inform Assoc 2011;18:563–7 [DOI] [PMC free article] [PubMed] [Google Scholar]
- 16.Roberts K, Harabagiu S. A flexible framework for deriving assertions from electronic medical records. J Am Med Inform Assoc 2011;18:568–73 [DOI] [PMC free article] [PubMed] [Google Scholar]
- 17.Torii M, Wagholikar K, Liu H. Using machine learning for concept extraction on clinical documents from multiple data sources. J Am Med Inform Assoc 2011;18:580–7 [DOI] [PMC free article] [PubMed] [Google Scholar]
- 18.Minard A, Ligozat A, Abacha A, et al. Hybrid methods for improving information access in clinical documents: concept, assertion, and relation identification. J Am Med Inform Assoc 2011;18:588–93 [DOI] [PMC free article] [PubMed] [Google Scholar]
- 19.Rink B, Harabagiu S, Roberts K. Automatic extraction of relations between medical concepts in clinical texts. J Am Med Inform Assoc 2011;18:594–600 [DOI] [PMC free article] [PubMed] [Google Scholar]
- 20.Jiang M, Chen Y, Liu M, et al. A study of machine-learning-based approaches to extract clinical entities and their assertions from discharge summaries. J Am Med Inform Assoc 2011;18:601–6 [DOI] [PMC free article] [PubMed] [Google Scholar]
- 21.D'Avolio L, Nguyen T, Goryachev S, et al. Automated concept-level information extraction to reduce the need for custom software and rules development. J Am Med Inform Assoc 2011;18:607–13 [DOI] [PMC free article] [PubMed] [Google Scholar]
- 22.Patrick J, Nguyen D, Wang Y, et al. A knowledge discovery and reuse pipeline for information extraction in clinical notes. J Am Med Inform Assoc 2011;18:574–9 [DOI] [PMC free article] [PubMed] [Google Scholar]
- 23.Patrick J, Li M. High accuracy information extraction of medication information from clinical notes: 2009 i2b2 medication extraction challenge. J Am Med Inform Assoc 2010;17:524–7 [DOI] [PMC free article] [PubMed] [Google Scholar]
- 24.Li Q, He D, Mao M. A study of relation annotation in business environments using web mining. Proc of International Conf on Semantic Computing, 2009. Berkeley, CA [Google Scholar]
- 25.McDonald R, Crammer K, Pereira F. Flexible text segmentation with structure multilabel classification. Proc of Human Language Technology Conf and Conf on Empirical Methods in Natural Language Processing (HLT/EMNLP), 2005 [Google Scholar]
- 26.Byrne K. Nested named entity recognition in historical archive text. Proc of the International Conf on Semantic Computing (ICSC), 2007 [Google Scholar]
- 27.Alex B, Haddow B, Grover C. Recognising nested named entities in biomedical text. Proceedings of the Workshop on BioNLP 2007: Biological, Translational, and Clinical Language Processing. [Google Scholar]
- 28.Finkel J, Manning C. Nested named entity recognition. Proc of Human Language Technology Conf and Conf on Empirical Methods in Natural Language Processing (HLT/EMNLP), 2009 [Google Scholar]
- 29.SHARPn annotation guidelines (Expected release, September, 2012). www.sharpn.org. (Oral communication from SHARPn's NLP PI)
- 30.Deleger L, Li Q, Lingren T, et al. Building gold standard corpora for medical natural language processing tasks. Proc AMIA Annu Symp 2012. (Accepted for publication) [PMC free article] [PubMed] [Google Scholar]
- 31.Noreen EW. Computer-intensive methods for testing hypotheses: an introduction. New-York: Wiley, 1989 [Google Scholar]
- 32.Denny JC, Miller RA, Johnson KB, et al. Development and evaluation of a clinical note section header terminology. Proc. AMIA Annu Symp 2008;156–60 [PMC free article] [PubMed] [Google Scholar]
- 33.Chang C, Lin C. LIBSVM: a library for support vector machines. ACM Transactions on Intelligent Systems and Technology, 2011. http://www.csie.ntu.edu.tw/~cjlin/libsvm [Google Scholar]
- 34.McCallum AK. MALLET: A machine learning for language toolkit. 2002. http://mallet.cs.umass.edu
- 35.Yarowsky D. One sense per collocation, Proc of the ARPA Human Language Technology Workshop 1993 [Google Scholar]