

Abstract
Background
In randomised trials testing treatments for acute ischaemic stroke, imaging markers of tissue reperfusion and arterial recanalisation may provide early response indicators.
Objective
To determine the predictive value of structural, perfusion and angiographic imaging for early and late clinical outcomes and assess practicalities in three comprehensive stroke centres.
Methods
We recruited patients with potentially disabling stroke in three stroke centres, performed magnetic resonance (MR) or CT, including perfusion and angiography imaging, within 6 h, at 72 h and 1 month after stroke. We assessed the National Institutes of Health Stroke Scale (NIHSS) score serially and functional outcome at 3 months, tested associations between clinical variables and structural imaging, several perfusion parameters and angiography.
Results
Among 83 patients, median age 71 (maximum 89), median NIHSS 7 (range 1–30), 38 (46%) received alteplase, 41 (49%) had died or were dependent at 3 months. Most baseline imaging was CT (76%); follow-up was MR (79%) despite both being available acutely. At presentation, perfusion lesion size varied considerably between parameters (p<0.0001); 40 (48%) had arterial occlusion. Arterial occlusion and baseline perfusion lesion extent were both associated with baseline NIHSS (p<0.0001). Recanalisation by 72 h was associated with 1 month NIHSS (p=0.0007) and 3 month functional outcome (p=0.048), whereas tissue reperfusion, using even the best perfusion parameter, was not (p=0.11, p=0.08, respectively).
Conclusion
Early recanalisation on angiography appeared to predict clinical outcome more directly than did tissue reperfusion. Acute assessment with CT and follow-up with MR was practical and feasible, did not preclude image analysis, and would enhance trial recruitment and generalisability of results.
Keywords: Stroke
Introduction
New treatments for acute ischaemic stroke are likely to have modest effects, so randomised controlled trials (RCTs) based on clinical outcomes need large sample sizes. Large trials are expensive and time consuming. Imaging might accelerate drug evaluation by providing markers of clinically relevant treatment effects in the initial ‘proof-of-concept’ phase and potential imaging surrogate outcome markers in phase 3 trials.1
Reperfusion of the ischaemic tissue, recanalisation of the occluded artery or subacute infarct size1 on CT or MRI are all potential imaging markers. Arterial recanalisation was associated with more independent survival after stroke.2 Tissue reperfusion was associated with reduced final infarct size and possibly, with improved functional outcomes.3 4 Arterial recanalisation is not the same as tissue reperfusion, though these terms are often used interchangeably, adding to difficulties in interpreting previous studies.5
Perfusion and angiographic imaging have some disadvantages. Both require intravenous contrast (contraindicated in renal impairment and in diabetic patients receiving oral hypoglycaemic agents). Image acquisition and processing may delay treatment, attenuating tissue salvage. Patients must cooperate for diagnostic-quality images to be obtained. Some CT scanners have limited brain coverage for perfusion imaging. CT angiography (CTA) and perfusion imaging increase the radiation dose. Some patients with hyperacute stroke do not tolerate (or have contraindications to) MRI.6 The definition of tissue at risk of infarction varies7; which of the many perfusion parameters,8 flow thresholds9 and image acquisition and processing parameters9 to use has yet to be agreed.
Whether reperfusion or recanalisation is the better or more practical marker for clinically relevant outcomes is unclear, there being few previous comparisons and these used magnetic resonance (MR) data.10 Performing either perfusion or angiographic imaging, rather than both, would make assessment of the patient with hyperacute stroke easier and faster. Being able to use either CT or MRI would also increase access by centres and patients to trials and might help to enhance recruitment rates beyond those seen in RCTs that to date have used advanced imaging to select patients for inclusion.
We undertook this study in three regional stroke centres to test strategies for use of imaging in future clinical trials: first, practical aspects for trial design such as the effect on recruitment and image analysis of allowing use of either CT or MR in patients with hyperacute stroke; and second, whether imaging measures of tissue perfusion or arterial patency were most strongly associated with clinically relevant parameters.
Methods
This prospective study was conducted in three comprehensive regional UK stroke centres. The study was approved by the Scotland A multicentre research ethics committee (07/MRE00/96), and written informed consent was obtained from all competent patients, or from a relative of patients incapacitated by their stroke. There were limited data on which to calculate sample size. We aimed to recruit equal proportions of patients with CT and MR, perfusion and angiography at baseline and to test feasibility by the proportion recruited with each modality. We aimed to recruit at least 80 patients within the 2 years available for the study to obtain data to enable formal sample size calculations based on proportions with perfusion or angiographic lesions and associations with clinical and imaging outcomes for future RCTs. A STROBE checklist is included in online supplementary material.
Patient recruitment
We considered all patients with potentially disabling acute ischaemic stroke who could be imaged within 6 h of stroke onset with CT or MR. Patients with MR-incompatible implants or other standard MR contraindications were excluded from MR but could still have CT; patients with impaired renal function (estimated glomerular filtration rate ≤30 ml/min) were excluded. We recorded numbers of potentially eligible patients who were not recruited and the main reason for exclusion. Alteplase and other licensed acute treatments were given according to clinical indication.
Clinical assessment
We assessed National Institutes of Health Stroke Scale (NIHSS) score at baseline, 24 h, 72 h, 7 and 30 days, and stroke subtype by the Oxfordshire Community Stroke Project (OCSP) classification. We obtained demographic data, past medical history, medications and vital signs at baseline. We assessed functional outcome using the modified Rankin Scale (mRS) by structured interview,11 blind to early clinical and all imaging results, at 1 and 3 months.
Image acquisition
We performed admission imaging with either plain CT brain scan, CT perfusion (CTP) with bolus tracking of intravenous contrast and circle of Willis CTA; or with MR including diffusion imaging (DWI), T2-weighted or FLAIR, T2*-weighted imaging, perfusion imaging (MRP) by intravenous gadolinium bolus tracking and circle of Willis MR angiography (MRA). We aimed for a 50 : 50 balance with CT and MR, the choice of baseline imaging being dictated by scanner availability, patient compliance and contraindications. However, all three sites had hospital-based, research-dedicated MR scanners available in working hours and National Health Service CT scanners. We performed follow-up imaging with MR in all MRI-compatible patients at 72 h and 30 days, irrespective of the baseline imaging modality, and with CT for MR-incompatible patients. We used 72 h (3 days) for optimum capture of early imaging outcomes (72 h is the time at which peak infarct swelling occurs) and to assess haemorrhagic transformation. One centre did not perform 30-day angiography. CTP slices were located to cover any ischaemic lesion visible on plain CT and/or the standard Alberta Stroke Program Early CT Score (ASPECTS) score slices12 if no lesion was visible. We harmonised the protocols between centres to a common standard but otherwise left them as optimised for each site and scanner.
Image analysis
All analyses were blinded to clinical, imaging and outcome information. Image data were transferred via the Scottish National Picture Archiving and Communication System for central image analysis. We anonymised the data (using DICOMConfidential13) for offline central analysis.
The perfusion parameter maps were generated offline using validated software.8 14 All baseline and follow-up MR diffusion, perfusion and CT data were registered to the baseline CT volume brain image or MR DWI B0 image and motion corrected. Quantitative (cerebral blood flow (CBF); cerebral blood volume (CBV); and mean transit time (MTT); time to peak (TTP) of the residue function (Tmax) and relative (arrival time fitted (ATF); TTP) parameter maps were produced. We performed deconvolution using singular value decomposition, by a delay-insensitive method (block-circulant matrix),8 14 15 and took arterial input function from the proximal contralateral middle cerebral artery (MCA) and venous outflow from the sagittal sinus. We did not apply specific thresholds, preferring to evaluate a range of parameters as these have not yet been widely tested against clinical or other imaging parameters,7 and consensus on processing9 has still to be decided through the Stroke Imaging Roadmap (STIR)16 and Stroke Treatment Academic Industry Roundtable (STAIR) groups (update expected 2013).
One expert neuroradiologist performed qualitative image assessment. We quantified the ischaemic lesion extent on structural MR and plain CT imaging using the Third International Stroke Trial (IST-3)17 and ASPECTS scores12 which have similar inter- and intrarater reliability.18 ASPECTS quantifies perfusion and structural lesions in the MCA territory.12 The IST-3 score assesses all vascular territories and codes lesion location, extent, degree of tissue attenuation/signal intensity and mass effect.17 We quantified lesion swelling,17 presence and location of hyperattenuated artery17 19 haemorrhagic transformation and general brain appearance (prior stroke lesions, leukoaraiosis20 and atrophy21).
We rated the extent of perfusion lesions using (1) the ASPECTS score,12 subtracting a point for each brain region affected, even in part, by the perfusion lesion and (2) by recording if there was (a) no visible perfusion lesion, (b) a visible perfusion lesion that was no more than 80% of, (c) about the same size as, or (d) 20% or more larger by visually estimated volume than the structural ischaemic lesion. These cut-off points were chosen to reflect previous studies.3 We scored all of the above perfusion parameters without thresholds (in the absence of a clearly agreed or validated threshold)7 and the extent of contrast enhancement on the dynamic source images (‘raw data’). Mismatch was defined as a perfusion lesion >1 ASPECTS points larger than the structural lesion.
We scored arterial patency in the affected artery on CTA or MRA using base and maximum intensity projection angiographic images and the Mori22 23 and Thrombolysis in Myocardial Infarction (TIMI)24 scores, rating the primary occlusive lesion and patency of the immediately distal visible arteries, but not the distal arterial tree or tissue perfusion.
Data management and statistical analysis
We entered data into a purpose-designed centralised electronic case record form with consistency checks. The statistical analysis plan was finalised 6 months before recruitment completion. There were few differences in patient characteristics between centres, so we analysed the whole cohort together. We assessed changes in baseline clinical, structural, perfusion and angiography characteristics at 72 h and at 30 days. We analysed change in the extent of perfusion lesion between time points using (1) the change in ASPECT score and (2) change classified as ‘any reduction’, ‘no change’ or ‘any increase’ in perfusion lesion extent. We analysed change in arterial patency by change in the hyperattenuated artery sign and change in Mori/TIMI scores separately, and then created a composite score of ‘change in any of hyperattenuated artery or angiographic patency based on the TIMI score’. We did not impute missing data as the major reason for not undergoing follow-up imaging was death or being too unwell. We used the Spearman rank correlation and 95% CI, and the Wilcoxon–Mann–Whitney, Kruskal–Wallis and χ2 tests to explore associations between variables. We applied Bonferroni correction for multiple comparisons to the ASPECTS measurement of multiple perfusion parameter lesion sizes at baseline; other p values are not corrected.
Results
Recruitment
We screened 360 potentially eligible patients from 21 April 2008 to 31 March 2010 and recruited 83 (23%). The main reasons for exclusion were mild stroke/late arrival 125 (35%), outside 9:00–17:00 59 (16%), intolerant of imaging 12 (3%), refused consent 17 (5%), recruited to a competing study 52 (14%) or haemorrhagic stroke 4 (1%).
Patient characteristics
Of the 83 recruited, median age 71 years (maximum 89), 60% were male and vascular risk factors were common (see online supplementary table S1). Almost half, 38 (46%), received alteplase open label; two patients were randomised (to control) in a trial of alteplase in acute ischaemic stroke (http://www.ist3.com). The median baseline NIHSS score was 7, range 1–30, and 62 (75%) had total or partial anterior circulation stroke. At 3 months, 41 (49.4%) were dependent or had died (mRS 3–6).
Most baseline imaging was with CT (63/83, 76%) but most follow-up imaging was with MR. The median time to first scan was 2.75 h (minimum 1.25, maximum 5.58 h), 42/83 patients (51%) being imaged <3 h and 49% from 3 to 6 h. Follow-up imaging was obtained in 72 at 72 h and 48 at 30 days (see online supplementary table S2). The main reasons for missing follow-up imaging were death (10) or being too unwell (20). Fewer patients completed perfusion and angiography imaging than structural imaging, but the completion rate did not differ between the first two modalities.
Structural imaging
At baseline, 63/83 (76%) patients had a visible ischaemic lesion on structural imaging, most (76%) in the MCA territory (see online supplementary table S2). Background brain changes included severe cerebral atrophy (9, 11%), severe white matter lesions (11, 13%) and prior infarct (24, 29%).
Perfusion imaging
The proportion of visible perfusion lesions at baseline and their size varied between perfusion parameters (figure 1). MTT-based parameters (MTT, ATF, TTP, and Tmax) were larger than CBF or CBV (signed-rank test p<0.0001 for all CBV and p<0.0009 for all CBF comparisons with MTT-based parameters, Bonferroni corrected). MTT-based lesions also showed more mismatch (figure 2). MTT-based lesion sizes did not differ, so we used Tmax in all further comparisons. At baseline, a Tmax lesion was visible in 48 (61%) patients, 31 of whom (65% of those with a Tmax lesion, 39% of all patients) had mismatch (see online supplementary table S2); by 30 days, the Tmax lesion volume had decreased in 32, was unchanged in 13 and increased in three patients; mismatch persisted on Tmax in 5 (10%) at 72 h and 1 (5%) at 30 days.
Figure 1.
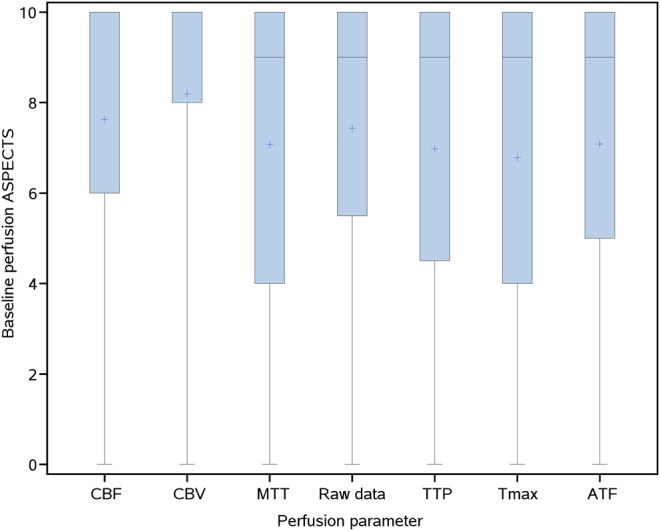
Extent of the perfusion lesion at baseline according to various perfusion parameters as quantified by the ASPECTS score. Shaded areas represent the IQR; horizontal line within the shaded area is the median, point marked within the shaded area is the mean. Where not shown separately, the median has the same value as the upper quartile: ASPECTS=10. ASPECTS, Alberta Stroke Program Early CT Score; ATF, arrival time fitted; CBF, cerebral blood flow; CBV, cerebral blood volume, MTT, mean transit time; raw data, lesion as seen on preprocessed perfusion image; TTP, time to peak; Tmax, time to peak of the residue function.
Figure 2.
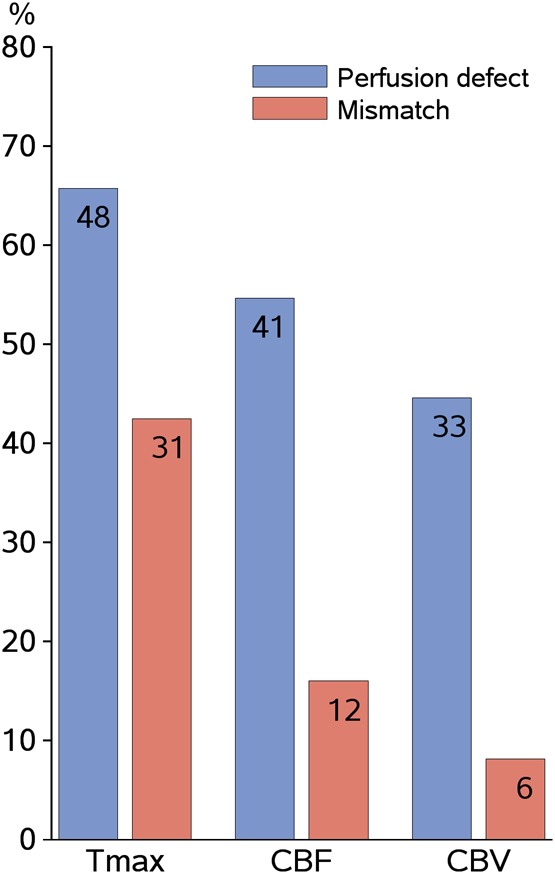
Perfusion lesions and mismatch rates by perfusion parameter. Mismatch defined as a perfusion lesion >20% larger than the structural lesion. CBF, cerebral blood flow; CBV, cerebral blood volume; Tmax, time to peak of the residue function, a measure of mean transit time.
Angiographic imaging
At baseline, 40/83 (48%) patients had an occluded intracranial artery, most being in the MCA main stem (22%) or MCA branch (27%, see online supplementary table S2). Sixteen patients without baseline arterial occlusion (16/43, 37%) had a baseline perfusion deficit on one or more perfusion parameters (figure 3, shows association for Tmax). Arterial occlusion persisted in 16 (40% of those with baseline occlusion or 22% of those imaged) at 72 h and in 4/48 (8%) at 30 days.
Figure 3.
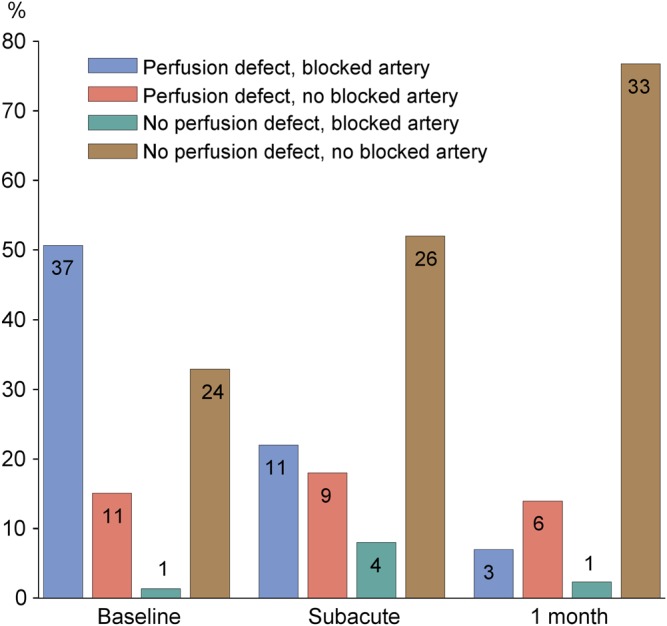
Proportions of patients with/without a perfusion defect (on Tmax) and/or arterial obstruction within 6 h, at 72 h and 30 days after stroke. Numbers on bars are numbers of patients. Tmax, time to peak of the residue function, a measure of mean transit time.
Baseline clinical and imaging associations
At baseline, a higher NIHSS score was associated with larger lesions on structural (p<0.0001) and perfusion imaging (all parameters, p<0.02–0.001) by ASPECTS and with arterial occlusion (p<0.001, table 1). Larger structural and perfusion lesions, but not arterial occlusion, were associated with increasing age; time to scanning was not associated with any imaging parameter. Arterial occlusion was associated with increasing baseline structural lesion extent (p<0.0001) and larger perfusion lesions (all p<0.0001, see online supplementary table S3).
Table 1.
Association between baseline clinical (stroke severity and subtype, age and time to baseline scan) and imaging (structural, perfusion, arterial patency) variables
| CT or MR: | Structural imaging | Perfusion imaging | Angiography | ||||||
|---|---|---|---|---|---|---|---|---|---|
| Variable | ASPECTS score | IST-3 score | Tmax w.r.t. structural lesion* | Tmax ASPECTS score | CBF w.r.t structural lesion* | CBF ASPECTS score | CBV w.r.t. structural lesion* | CBV ASPECTS score | Arterial occlusion |
| NIHSS baseline | −0.67 (−0.77 to −0.52); p<0.0001 | 0.60 (0.44 to 0.73); p<0.0001 | 0.33 (0.11 to 0.52); p=0.004 | −0.63 (−0.75 to −0.47); p<0.0001 | 0.34 (0.12 to 0.53); p=0.003 | −0.61 (−0.74 to −0.45); p<0.0001 | 0.38 (0.16 to 0.56); p=0.00074 | −0.59 (−0.72 to −0.42); p<0.0001 | p<0.0001 |
| OCSP | p<0.0001 | p<0.0001 | p<0.0001 | p<0.0001 | p=0.00025 | p<0.0001 | p=0.00042 | p<0.0001 | p<0.0001 |
| Age (years) | −0.25 (−0.44 to −0.03); p=0.03 | 0.28 (0.06 to 0.47); p=0.01 | 0.19 (−0.04 to 0.41); p=0.10 | −0.27 (−0.47 to −0.04); p=0.02 | 0.19 (−0.04 to 0.40); p=0.09 | −0.27 (−0.47 to −0.05); p=0.02 | 0.26 (0.04 to 0.46); p=0.02 | −0.34 (−0.53 to −0.12); p=0.003 | 0.19 |
| Time to first scan (hours) | 0.07 (−0.16 to 0.29); p=0.57 | −0.10 (−0.32 to 0.14); p=0.41 | −0.21 (−0.42 to 0.03); p=0.08 | 0.18 (−0.06 to 0.39); p=0.14 | −0.22 (−0.43 to 0.02); p=0.07 | 0.20 (−0.03 to 0.41); p=0.09 | −0.08 (−0.31 to 0.16); p=0.51 | 0.11 (−0.13 to 0.34); p=0.36 | 0.56 |
Angiography data analysed by Wilcoxon–Mann–Whitney test, except for OCSP which was analysed by χ2 test. All other associations assessed by Spearman correlation and 95% CI, except for OCSP groups which are compared using the Kruskal–Wallis test.
*Expresses the extent of the perfusion lesion with respect to the structural lesion according to whether there was (a) no visible lesion, (b) a visible lesion that was less than 80% of (c) the same size as, or (d) more than 20% larger than the structural ischaemic lesion.
ASPECTS, Alberta Stroke Program Early CT Score; CBF, cerebral blood flow; CBV, cerebral blood volume; IST-3, Third International Stroke Trial; MR, magnetic resonance; NIHSS, National Institutes of Health Stroke Scale; OCSP, Oxfordshire Community Stroke Project classification of stroke subtype; Tmax, time to peak of the residue function; w.r.t, with respect to.
Imaging and clinical outcome, reperfusion and recanalisation
Infarct extent on structural imaging at 1 month was associated with baseline NIHSS (Spearman correlation ASPECTS −0.59 (95% CI −0.75 to −0.36), p<0.001; IST-3 0.44 (95% CI 0.17 to 0.65), p=0.002) and with baseline OCSP (Kruskal–Wallis test: ASPECTS p=0.0002, IST-3 p=0.0071). Reperfusion by 72 h —that is, reduction in the perfusion lesion ASPECTS score, showed no consistent association by any perfusion parameter, with NIHSS at 72 h or 1 month or mRS at 1 or 3 months (table 2). However, arterial recanalisation by 72 h was associated with NIHSS at 7 days (p=0.04) and 1 month (p=0.0007) and with mRS at 1 (p=0.04) and 3 months (p=0.03; Wilcoxon).
Table 2.
Imaging evidence of lesion reperfusion or arterial recanalisation and associations with clinical outcomes
| Parameter | Reperfusion | CT or MR perfusion: evidence of reperfusion on: | CTA or MRA: recanalisation composite measure | ||||||
|---|---|---|---|---|---|---|---|---|---|
| Tmax | p Value | CBF | p Value | CBV | p Value | p Value | |||
| NIHSS day 7 (median, IQR) | Yes | 6 (3, 11.5) | 0.066 | 6 (3, 13) | 0.15 | 6 (3, 10.5) | 0.30 | 4.50 (2, 7) | 0.044 |
| No | 3 (1, 6) | 3 (1, 7) | 3 (1, 7) | 9 (3.5, 13.5) | |||||
| NIHSS 1 month (median, IQR) | Yes | 2 (1, 5) | 0.11 | 2 (1, 6) | 0.064 | 2 (1, 6) | 0.16 | 1 (0, 3) | 0.00065 |
| No | 1 (0, 3) | 1 (0, 3) | 1.5 (0, 3) | 5 (3, 11) | |||||
| mRS at 3 months (median, IQR) | Yes | 3 (2, 4) | 0.076 | 3 (2, 4) | 0.067 | 3 (2, 4) | 0.11 | 2 (1, 3) | 0.028 |
| No | 2 (1, 3) | 2 (1, 3) | 2 (1, 3) | 3 (2, 4) | |||||
| Age, years (median, IQR) | Yes | 74 (65, 82) | 0.074 | 74 (65, 82) | 0.047 | 75 (67, 83) | 0.0085 | 70 (63, 79) | 0.58 |
| No | 68 (60, 77) | 69 (51, 74) | 67 (51, 72) | 70 (63, 77) | |||||
p Values are for the Wilcoxon–Mann–Whitney test comparing groups with/without reperfusion/recanalisation.
CBF, cerebral blood flow; CBV, cerebral blood volume; CTA, CT angiography; MR, magnetic resonance; MRA, MR angiography; mRS, modified Rankin Scale; NIHSS, National Institutes of Health Stroke Scale.
Other imaging outcomes
Infarct swelling at 72 h was associated with larger perfusion lesions at baseline (Tmax, Spearman −0.536 (95% CI −0.688 to −0.337), p value <0.0001) and with persistent arterial occlusion at 72 h (Spearman −0.338, (95% CI −0.529 to −0.114), p=0.0035). Haemorrhagic transformation at 72 h was associated with baseline arterial occlusion (p=0.02) but not perfusion lesion extent or change in perfusion lesion by any parameter, or change in arterial patency.
Discussion
In this direct comparison in patients with moderate to severe stroke, half of whom were receiving intravenous alteplase, we found consistent associations between arterial occlusion/recanalisation and neurological or functional outcomes, but more variable clinical associations with NIHSS and mRS for perfusion lesions and reperfusion regardless of the perfusion parameter used. Potential imaging markers should be clinically relevant.25 The clinical relevance of arterial occlusion and recanalisation is supported by a meta-analysis of observational data,2 although meta-analyses are less clear for tissue perfusion, mismatch or reperfusion.4 26
We identify several other points of value for future stroke trials. Nearly 80% had a visible ischaemic lesion on baseline structural imaging, although most had CT and more than half were scanned within 3 h of stroke, confirming the usefulness of CT in moderate to severe stroke with a structured review process. MR with DWI might have shown acute ischaemic lesions in a higher proportion, but at the risk of patient loss to recruitment. We achieved high recruitment rates, while also giving thrombolytic treatment to nearly half the patients. We demonstrate that it is feasible to recruit with CT and follow-up with MR, removing the requirement to use only one modality in clinical trials, increasing patient participation and recruitment rates. We recruited four times as many patients during the study by allowing use of CT at presentation and MR for follow-up than if we had insisted on MR at presentation, despite having research-dedicated MR scanners in all three centres. We performed early follow-up imaging at 72 h to capture peak infarct swelling and haemorrhagic transformation, but follow-up imaging could be performed earlier depending on its main purpose. These actions together, if used in RCTs, would increase the generalisability of the results, reduce time to trial completion and costs and enhance the rate at which new treatments could be tested.
Our study had limitations. We were unable to recruit some patients outside 9:00–17:00 (16%). The difficulty of performing MR at presentation mirrors experience of other observational studies6 and RCTs.3 27 We used three CT and three MR scanners so our data will include between-scanner variability. However, no two scanners’ performance, even the same make and model, are identical or remain static. We minimised the impact of scanner variability by using sequences optimised for each scanner and centralised analysis. Furthermore, between-patient biological variability is generally larger than between-scanner variability, large sample sizes overcome patient and centre heterogeneity and provide generalisable results. CTP may cover less brain than MRP, but we scored all brain regions showing any involvement in the perfusion lesion, minimising the effect of reduced brain coverage. Visual quantification can be performed when volume assessment cannot —for example, where there is incomplete lesion coverage, or scan quality (eg, movement artefact) precludes computational assessment. We used a composite angiographic score, including evidence of arterial occlusion on angiography or hyperattenuated artery/absent flow void, but only after testing the individual components. Hyperattenuated artery is specific for arterial occlusion, although lacks sensitivity, but its disappearance was an independent predictor of good outcome in a large alteplase registry,19 justifying its use in a composite arterial patency score. We did not evaluate CTP base images which may help detect small peripheral arterial branch occlusions, potentially blunting the sensitivity of the association between occlusion/recanalisation and outcome. We did not report the results by alteplase allocation because use of alteplase was non-random and the bioeffects of alteplase contribute to the analysis of reperfusion and recanalisation. We did not use apparent diffusion coefficient (ADC), CT attenuation or perfusion threshold values to define lesions. However, there is no clear ADC threshold for infarct core,28 the observer reliability of ADC-based lesion measurement is limited,29 there is no validated perfusion threshold7 30 and different perfusion parameters produce widely different lesions.8
The study also had strengths. We used pragmatic composite imaging outcome measures but only after testing individual parameters; the composite measures were prespecified, as specific and as valid for defining recanalisation and reperfusion as possible.5 7 The qualitative image rating, performed by one observer carefully blinded to all other scan and clinical data, used extensively validated tools,12 17 18 31 and minimised observer variability. TIMI and Mori scores have been used widely by others,10 23 27 32 although the way in which they are used varies and other scores exist that should be tested in future work. We scored the primary point of arterial occlusion, thereby avoiding conflating several different aspects of vascular patency in one score, as discussed.33 We tested multiple perfusion parameters, demonstrating again the wide variability in lesion frequency, size and more importantly, confirming the variable relationship to functional outcome.8 We found little association between mismatch identified by any perfusion parameter and infarct growth or final clinical outcome. Our visual assessment method might have been insensitive, but there is good agreement between qualitative and quantitative data,29 and this result agrees with previous observational studies8 and trials.4 We show that persistent arterial occlusion and extensive perfusion defect at presentation predicted subacute lesion swelling; and arterial occlusion at baseline, but not recanalisation or reperfusion, was associated with haemorrhagic transformation. Many investigators prefer lesion volume to scoring measures, but volumes are unusable on poor quality images or where there is limited lesion coverage, and ‘volume’ does not distinguish the true increase in lesion extent from apparent growth due to swelling. Confounding effects of swelling on lesion volume might have influenced previous analyses.1 Insistence on quantitative analyses may restrain study design, resulting in data loss and slower recruitment. Our sample size is similar to that of other studies using multimodal imaging performed in many more centres.3
One previous study compared MR perfusion and angiography imaging with clinical variables in the same patients.10 This small study found stronger associations for clinical outcome with reperfusion, but their analysis might have been influenced by double counting perfusion in the version of the angiography (TIMI) score that was used. Another study that compared baseline CTP, CTA, plain CT and a composite score in 44 patients, found that CTP was a slightly stronger predictor of 3 month mRS than CTA, but that the composite score was the best predictor, but did not assess recanalisation or reperfusion.34 No other studies allowed both CT and MR to be used in the same patients. We examined all angiographic scores for stroke33: all conflate two or three components in one score—the primary obstruction, the vessels distal to the obstruction and tissue perfusion. This might have contributed to difficulties when using the scores in the past. No additional perfusion thresholds or parameters have been published since the systematic reviews of perfusion imaging.7
Angiography imaging of intracranial arteries with CT or MR is a clinically relevant marker for use in acute stroke treatment trials. Insistence on use of MR to assess patients before recruitment in trials will increase the number of centres required to overcome the restricted recruitment, increase costs, restrict the range of patients that can be recruited and limit generalisability of results. CT is the most commonly used modality for patient assessment before thrombolytic treatment; substantial data are now available indicating that it can be used safely in this situation.35 With appropriate image processing methods, both CT and MR can be used in patient follow-up; this increases flexibility, recruitment rates and generalisability of results. Visual image scoring was sensitive and detected changes in lesions and clinical outcomes with variation in perfusion or angiography lesion scores. Efforts to standardise acquisition, analysis and interpretation of perfusion imaging are required to reduce perfusion lesion variation; offline processing tools36 may help if quickly accessible and widely available. Scores for arterial occlusion and recanalisation should focus on arterial not tissue components now that perfusion imaging is available.
If imaging is to be used as a ‘biomarker’ in acute stroke trials, then it should measure a pathological process and predict resulting benefit, or harm. A ‘qualified biomarker’ is not yet validated.25 A ‘surrogate outcome marker’ is a biomarker which definitely substitutes for a clinical endpoint and measures drug efficacy or toxicity. Biomarker validation is a graded, incremental, evidentiary process. Biomarkers should reflect clinically relevant endpoints.25 Arterial recanalisation may more closely match the requirements of a biomarker than perfusion imaging, partly because tissue perfusion varies more with biological and technical factors than does angiography, so has a more complex relationship to clinical parameters. However, considerably more data from perfusion and angiography imaging are required before imaging markers can substitute for clinical outcomes. Future RCTs and observational multicentre studies using complex imaging could maximise patient recruitment by using CT or MR at baseline and for follow-up. Pragmatic use of qualitative visual scoring and quantitative analyses also minimises data loss, maximising accessibility, recruitment and generalisability.
Supplementary Material
Acknowledgments
We thank the radiographers, nursing and medical staff of the three centres for their support in undertaking the study.
Footnotes
Contributors: JMW: funding, study design, data collection, analysis, drafting and editing of manuscript. KWM: funding, study design, data collection, drafting and editing of manuscript. M-JM: funding, study design, data collection, editing of manuscript. CW: statistical analysis, editing of manuscript. FMcV: patient recruitment, data collection, analysis, editing of manuscript. TC: perfusion data processing, central image data management, editing of manuscript. KS: data management and verification, data entry, study administration, editing of manuscript. RT, PA, KD: patient recruitment, data collection and entry, editing of manuscript. AM, study design, data collection, editing of manuscript.
Funding: The work was supported by the Translational Medicine Research Collaboration (a consortium comprising the Universities of Aberdeen, Dundee, Edinburgh and Glasgow, the four associated NHS Health Boards (Grampian, Tayside, Lothian and Greater Glasgow and Clyde), Scottish Enterprise and Pfizer—project NS_EU_082, funding for RT and KD), the Stroke Association (funding for RT; TSA 2006/11), the Patrick Berthoud Charitable Trust (funding for KD), the Scottish Funding Council through the Scottish Imaging Network, A Platform for Scientific Excellence (SINAPSE) Collaboration (http://www.sinapse.ac.uk, funding for JMW and KWM).
Competing interests: None. The work was performed independently of the funders. The authors hold the data and performed all analysis and interpretation. The views are those of the authors and do not reflect the views of the funders.
Ethics approval: Scotland A Multicentre research ethics committee.
Provenance and peer review: Not commissioned; externally peer reviewed.
Data sharing statement: Image and numerical data are available from the authors upon request subject to a collaboration agreement. The anonymised data will be placed in the public domain once the study publication is complete.
References
- 1.Ebinger M, Christensen S, De Silva DA, et al. Expediting MRI-based proof-of-concept stroke trials using an earlier imaging end point. Stroke 2009;40:1353–8 [DOI] [PubMed] [Google Scholar]
- 2.Rha J, Saver JL. The impact of recanalization on ischemic stroke outcome. A meta-analysis. Stroke 2007;38:967–73 [DOI] [PubMed] [Google Scholar]
- 3.Davis SM, Donnan G, Parsons MW, et al. Effects of alteplase beyond 3 h after stroke in the Echoplanar Imaging Thrombolytic Evaluation Trial (EPITHET): a placebo-controlled radomised trial. Lancet Neurol 2008;7:299–309 [DOI] [PubMed] [Google Scholar]
- 4.Mishra NK, Albers GW, Davis SM, et al. Mismatch-based delayed thrombolysis. A meta-analysis. Stroke 2010;41:e25–33 [DOI] [PubMed] [Google Scholar]
- 5.Soares BP, Chien JD, Wintermark M. MT and CT monitoring of recanalization, reperfusion, and penumbra salvage. Everything that recanalizes does not necessarily reperfuse! Stroke 2009;40:S24–7 [DOI] [PubMed] [Google Scholar]
- 6.Barber PA, Hill MD, Eliasziw M, et al. Imaging of the brain in acute ischaemic stroke: comparison of computed tomography and magnetic resonance diffusion-weighted imaging. J Neurol Neurosurg Psychiatry 2005;76:1528–33 [DOI] [PMC free article] [PubMed] [Google Scholar]
- 7.Dani KA, Thomas RGR, Chappell FM, et al. Computed tomography and magnetic resonance perfusion imaging in ischemic stroke: definitions and thresholds. Ann Neurol 2011;70:384–401 [DOI] [PubMed] [Google Scholar]
- 8.Kane I, Carpenter T, Chappell F, et al. Comparison of 10 different magnetic resonance perfusion imaging processing methods in acute ischemic stroke. Effect on lesion size, proportion of patients with diffusion/perfusion mismatch, clinical scores, and radiologic outcomes. Stroke 2007;38:3158–64 [DOI] [PubMed] [Google Scholar]
- 9.Dani KA, Thomas RG, Chappell FM, et al. Systematic review of perfusion imaging with computed tomography and magnetic resonance in acute ischemic stroke: heterogeneity of acquisition and postprocessing parameters: a Translational Medicine Research Collaboration multicentre acute stroke imaging study. Stroke 2012;43:563–6 [DOI] [PubMed] [Google Scholar]
- 10.De Silva DA, Fink JN, Christensen S, et al. Assessing reperfusion and recanalization as markers of clinical outcomes after intravenous thrombolysis in the echoplanar imaging thrombolytic evaluation trial (EPITHET). Stroke 2009;40:2872–4 [DOI] [PubMed] [Google Scholar]
- 11.Wilson JT, Hareendran A, Hendry A, et al. Reliability of the modified Rankin Scale across multiple raters: benefits of a structured interview. Stroke 2005;36:777–81 [DOI] [PubMed] [Google Scholar]
- 12.Barber PA, Demchuk AM, Zhang J, et al. Validity and reliability of a quantitative computed tomography score in predicting outcome of hyperacute stroke before thrombolytic therapy. ASPECTS Study Group. Alberta Stroke Programme Early CT Score. Lancet 2000;355:1670–4 [DOI] [PubMed] [Google Scholar]
- 13.Rodríguez González D, Carpenter T, van Hemert JI, et al. An open source toolkit for medical imaging de-identification. Eur Radiol 2010;20:1896–904 [DOI] [PubMed] [Google Scholar]
- 14.Carpenter T, Armitage PA, Bastin ME, et al. DSC perfusion MRI—quantification and reduction of systematic errors arising in areas of reduced cerebral blood flow. Magn Reson Med 2006;55:1342–9 [DOI] [PubMed] [Google Scholar]
- 15.Wu O, Ostergaard L, Weisskoff RM, et al. Tracer arrival timing-insensitive technique for estimating flow in MR perfusion-weighted imaging using singular value decomposition with a block-circulant deconvolution matrix. Magn Reson Med 2003;50:164–74 [DOI] [PubMed] [Google Scholar]
- 16.Wintermark M, Albers GW, Alexandrov AV, et al. Acute stroke imaging research roadmap. Stroke 2008;39:1621–8 [DOI] [PubMed] [Google Scholar]
- 17.Wardlaw JM, Sellar RJ. A simple practical classification of cerebral infarcts on CT and its interobserver reliability. AJNR Am J Neuroradiol 1994;15:1933–9 [PMC free article] [PubMed] [Google Scholar]
- 18.Wardlaw JM, von Kummer R, Farrall AJ, et al. A large web-based observer reliability study of early ischaemic signs on computed tomography. The Acute Cerebral CT Evaluation Of Stroke Study (ACCESS). PLoS ONE 2010;5:e15757. [DOI] [PMC free article] [PubMed] [Google Scholar]
- 19.Kharitonova T, Thoren M, Ahmed N, et al. Disappearing hyperdense middle cerebral artery sign in ischemic stroke patients treated with intravenous thrombolysis—clinical course and prognostic significance. J Neurol Neurosurg Psychiatry 2008;80:273–8 [DOI] [PubMed] [Google Scholar]
- 20.van Swieten JC, Hijdra A, Koudstaal PJ, et al. Grading white matter lesions on CT and MRI: a simple scale. J Neurol Neurosurg Psychiatry 1990;53:1080–3 [DOI] [PMC free article] [PubMed] [Google Scholar]
- 21.Farrell C, Chappell F, Armitage PA, et al. Development and initial testing of normal reference MR images for the brain at ages 65–70 and 75–80 years. Eur Radiol 2008;19:177–83 [DOI] [PubMed] [Google Scholar]
- 22.Mori E, Yoneda Y, Tabuchi M, et al. Intravenous recombinant tissue plasminogen activator in acute carotid artery territory stroke. Neurology 1992;42:976–82 [DOI] [PubMed] [Google Scholar]
- 23.Arnold M, Nedeltchev K, Remonda L, et al. Recanalisation of middle cerebral artery occlusion after intra-arterial thrombolysis: different recanalisation grading systems and clinical functional outcome. J Neurol Neurosurg Psychiatry 2005;76:1373–6 [DOI] [PMC free article] [PubMed] [Google Scholar]
- 24.TIMI Study Group The Thrombolysis in Myocardial Infarction (TIMI) trial. Phase I findings. N Engl J Med 1985;312:932–6 [DOI] [PubMed] [Google Scholar]
- 25.Biomarkers Definitions Working Group Biomarkers and surrogate endpoints: preferred definitions and conceptual framework. Clin Pharmacol Ther 2001;69:89–95 [DOI] [PubMed] [Google Scholar]
- 26.Kane I, Sandercock P, Wardlaw J. Magnetic resonance perfusion diffusion mismatch and thrombolysis in acute ischaemic stroke: a systematic review of the evidence to date. J Neurol Neurosurg Psychiatry 2007;78:485–91 [DOI] [PMC free article] [PubMed] [Google Scholar]
- 27.Hacke W, Furlan AJ, Al-Rawi Y, et al. Intravenous desmoteplase in patients with acute ischaemic stroke selected by MRI perfusion-diffusion weighted imaging or perfusion CT (DIAS-2): a prospective, randomised, double-blind, placebo-controlled study. Lancet Neurol 2008;8:141–50 [DOI] [PMC free article] [PubMed] [Google Scholar]
- 28.Chemmanam T, Campbell BC, Christensen S, et al. Ischemic diffusion lesion reversal is uncommon and rarely alters perfusion-diffusion mismatch. Neurology 2010;75:1040–7 [DOI] [PubMed] [Google Scholar]
- 29.Luby M, Ku KD, Latour LL, et al. Visual perfusion-diffusion mismatch is equivalent to quantitative mismatch. Stroke 2011;42:1010–14 [DOI] [PMC free article] [PubMed] [Google Scholar]
- 30.Thomas RGR, Lymer GKS, Armitage PA, et al. Apparent diffusion coefficient thresholds and diffusion lesion volume in acute stroke. J Stroke Cerebrovasc Dis. Published Online First: 24 November 2012.10.1016/j.jstrokecerebrovasdis.2012.09.018 [DOI] [PubMed] [Google Scholar]
- 31.Puetz V, Dzialowski I, Hill MD, et al. The Alberta Stroke Program Early CT Score in clinical practice: what have we learned? Int J Stroke 2009;4:354–64 [DOI] [PubMed] [Google Scholar]
- 32.Khatri P, Neff J, Broderick JP, et al. Revascularization end points in stroke interventional trials: recanalization versus reperfusion in IMS-I. Stroke 2005;36:2400–3 [DOI] [PubMed] [Google Scholar]
- 33.Wardlaw JM, von Kummer R, Carpenter T, et al. Protocol for the perfusion and angiography imaging sub-study of the Third International Stroke Trial (IST-3) of alteplase treatment within six hours of acute ischaemic stroke. Int J Stroke 2013.10.1111/j.1747-4949.2012.00946.x [DOI] [PubMed] [Google Scholar]
- 34.Nabavi DG, Kloska SP, Nam EM, et al. MOSAIC: Multimodal Stroke Assessment Using Computed Tomography: novel diagnostic approach for the prediction of infarction size and clinical outcome. Stroke 2002;33:2819–26 [DOI] [PubMed] [Google Scholar]
- 35.The IST-3 Collaborative Group The benefits and harms of intravenous thrombolysis with recombinant tissue plasminogen activator within 6 h of acute ischaemic stroke (the third international stroke trial [IST-3]): a randomised controlled trial. Lancet 2012;379:2352–63 [DOI] [PMC free article] [PubMed] [Google Scholar]
- 36.Lansberg MG, Lee J, Christensen S, et al. RAPID automated patient selection for reperfusion therapy: a pooled analysis of the Echoplanar Imaging Thrombolytic Evaluation Trial (EPITHET) and the Diffusion and Perfusion Imaging Evaluation for Understanding Stroke Evolution (DEFUSE) Study. Stroke 2011;42:1608–14 [DOI] [PMC free article] [PubMed] [Google Scholar]
Associated Data
This section collects any data citations, data availability statements, or supplementary materials included in this article.