

Abstract
Concerns about reproductive and developmental health risks of exposure to organophosphate (OP) pesticides, phthalates, and bisphenol A (BPA) among the general population are increasing. Six dialkyl phosphate (DAP) metabolites, 3,5,6-trichloro-2-pyridinol (TCPy), BPA, and fourteen phthalate metabolites were measured in 10 pooled urine samples representing 110 pregnant women who participated in the Norwegian Mother and Child Birth Cohort (MoBa) study in 2004. Daily intakes were estimated from urinary data and compared with reference doses (RfDs) and daily tolerable intakes (TDIs). The MoBa women had a higher mean BPA concentration (4.50 μg/L) than the pregnant women in the Generation R Study (Generation R) in the Netherlands and the National Health and Nutrition Examination Survey (NHANES) in the United States. The mean concentration of total DAP metabolites (24.20 μg/L) in MoBa women was higher than that in NHANES women but lower than that in Generation R women. The diethyl phthalate metabolite mono-ethyl phthalate (MEP) was the dominant phthalate metabolite in all three studies, with the mean concentrations of greater than 300 μg/L. The MoBa and Generation R women had higher mean concentrations of mono-n-butyl phthalate (MnBP) and mono-isobutyl phthalate (MiBP) than the NHANES women. The estimated average daily intakes of BPA, chlorpyrifos/chlorpyrfios-methyl and phthalates in MoBa (and the other two studies) were below the RfDs and TDIs. The higher levels of metabolites in the MoBa participants may have been from intake via pesticide residues in food (organophosphates), consumption of canned food, especially fish/seafood (BPA), and use of personal care products (selected phthalates).
Keywords: Organophosphate (OP) pesticides, Bisphenol A (BPA), Phthalates, Biological monitoring, Environmental Exposure
1. Introduction
Concerns about health risks of exposure to organophosphate (OP) pesticides, phthalates, and bisphenol A (BPA) have led to increased monitoring of exposure levels among general populations (Landrigan et al., 1999; Hauser and Calafat, 2005; Engel et al., 2007; Eskenazi et al., 2007; Chapin et al., 2008; Lang et al., 2008). Biological monitoring, mainly in urine, has been reported for these chemicals most frequently among adults and children (Koch et al., 2003; Matsumoto et al., 2003; Silva et al., 2004; Barr et al., 2005; Calafat et al., 2005). Fetuses are often more sensitive to harm from environmental toxicants, and prenatal exposures have been associated with adverse health outcomes in reproductive, neurodevelopmental, and cardiovascular systems (Selevan et al., 2000). Associations of prenatal OP pesticide exposure at low levels with adverse neurodevelopment have been reported (Engel et al., 2007; Eskenazi et al., 2007). The National Toxicology Program Review Panel (National Toxicology Program, 2008) had “some concern” that early life exposure to low levels of BPA may cause behavioral abnormalities, based on the results of animal experiments. Experimental animal studies have also found reproductive and developmental toxicity of some phthalates (Kavlock et al., 2002) and in humans an association of prenatal phthalate exposure at background levels with reduced anogenital distance has been reported (Swan et al., 2005).
In this report, we present the average levels of metabolites of OP pesticides, phthalates, and BPA in pooled urine specimens from pregnant women participating in the Norwegian Mother and Child Cohort Study (MoBa). The primary objective was to provide data on exposure levels of these chemicals to inform the planning of studies on potential health effects in this large cohort. To place the results in perspective, we compared them to findings in other studies. We also estimated daily intakes for selected compounds based on the urinary data and compared them with the reference doses (RfDs) of the US Environmental Protection Agency (USEPA, 2008) and the tolerable daily intakes (TDIs) of the European Food Safety Authority (EFSA, 2008).
2. Materials and Methods
2.1 Study populations
This study is based on the Norwegian Mother and Child Cohort Study (MoBa) conducted by the Norwegian Institute of Public Health (Magnus et al., 2006), the Generation R study in the Netherlands (Jaddoe et al., 2006), and the National Health and Nutrition Examination Survey (NHANES) 2001–2004 in the United States (US) (CDC, 2008b).
MoBa (Magnus et al., 2006)
In brief, MoBa is a pregnancy cohort started in 1999, with the aim of including 100,000 pregnant women by 2008. The majority of all pregnant women in Norway were invited to participate, and the response rate was around 44%. Pregnant women were recruited to the study through a postal invitation in connection with a routine ultrasound examination offered to all pregnant women in Norway at 17–18 weeks of gestation (www.fhi.no/morogbarn). The Regional Committee for Medical Research and the Norwegian Data Inspectorate have approved the study. Each pregnant woman was asked to provide biological specimens (urine and blood) and complete a series of questionnaires. In September 2004, 110 urine specimens of 7 ml that were received by the biobank were processed as usual except instead of discarding the urine not needed for long-term storage, the excess was divided into groups for pooling (Ronningen et al., 2006). To reduce laboratory costs we pooled specimens before analysis. Such pooling has been shown to be a valid and cost-efficient approach to biomonitoring levels of contaminants (Weinberg and Umbach, 1999; Faraggi et al., 2003; Schisterman and Vexler, 2008). Ten pools, each comprising one 1 ml urine sample from 11 women, were created (Figure 1). The mean age of women in MoBa was 30 years (range: 15–53 years).
Figure 1.
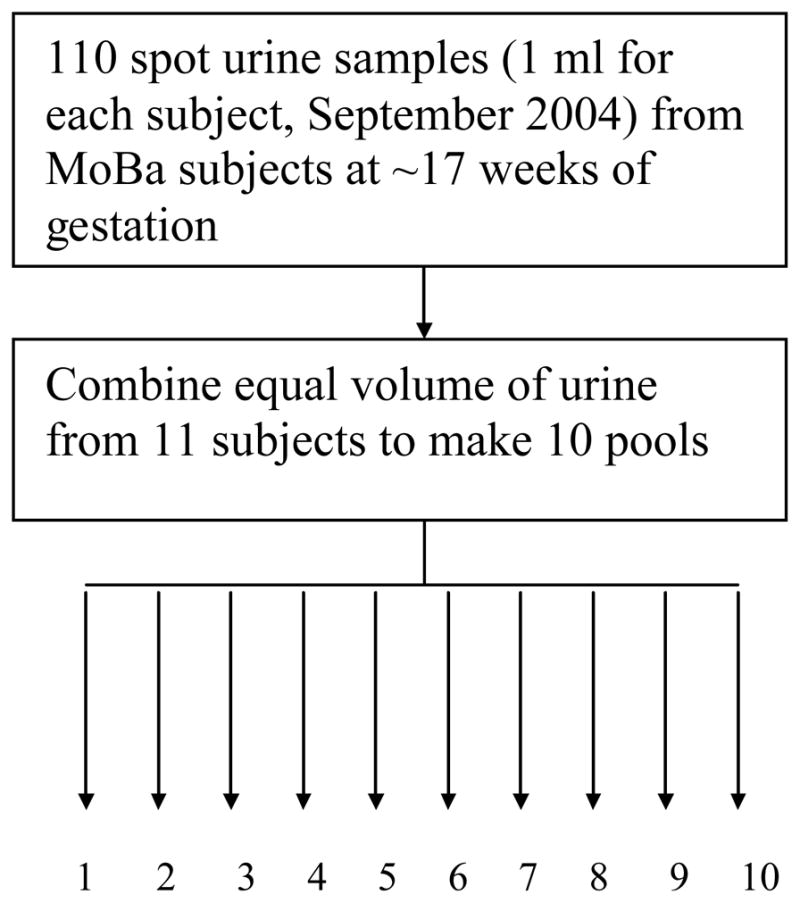
Source of the 10 pooled samples
Generation R (Jaddoe et al., 2006)
The Generation R study is a population-based birth cohort study in the city of Rotterdam, the Netherlands. Nearly 10,000 women who resided in the study area and had a delivery date between April 2002 and January 2006 were enrolled either during pregnancy or in the first months after the birth of their child, when newborns visited child health centers. Women (n=8,880) enrolled during pregnancy were asked to provide a spot urine sample at their first study visit, usually early in pregnancy (<18 weeks of gestational age). The health of their offspring is being followed to young adulthood. We randomly selected 100 urine samples from women whose pregnancy resulted in a live birth, who enrolled after February of 2004, and who had a specimen collected after 20 weeks of gestation. The mean age of the women was 30 years (range: 18–41 years).
NHANES (CDC, 2008b)
NHANES is a national survey on the health and nutrition status of residents of the US. A complex multistage sampling strategy is used to select subjects representing the US population of all ages. About 5,000 participants are examined each year. Urine specimens were collected from each participant 6 years of age and older. Human chorionic gonadotropin (hCG) in urine or serum was tested to determine the pregnancy status of female participants aged 12 to 59 years, and menstruating females aged 8 to 11 years. The urine samples of three separate subsets have been analyzed for quantification of OP pesticide metabolites (119 pregnant women in 2001–02), phthalate metabolites (111 pregnant women in 2001–02), and BPA (87 pregnant women in 2003–04). The mean age of the pregnant women was 27 years (range:14–43 years).
2.2 Laboratory analysis
We measured parent compounds or metabolites in MoBa urine samples, including six common non-specific dialkyl phosphate (DAP) metabolites of OP pesticides (dimethylphosphate [DMP], dimethylthiophosphate [DMTP], dimetyldithiophosphate [DMDTP], diethylphosphte [DEP], diethylthiophosphate [DETP], and diethyldithiophosphate [DEDTP]), a specific metabolite of chlorpyrifos and chlorpyrifos-methyl (3,5,6-trichloro-2-pyridinol, TCPy), BPA, and fourteen phthalate metabolites. The chemical analysis of these samples employed gas chromatography or reversed-phase high performance liquid chromatography with tandem mass spectrometry and was identical to that used to analyze the Generation R specimens (Ye et al., 2008). The laboratory was not aware of the different sources of the specimens. The limit of detection (LOD) was 0.01 μg/L for DEDTP, 0.1 μg/L for the other five DAP metabolites, 0.15 μg/L for TCPy, 0.26 μg/L for BPA, and 0.5 –2.0 μg/L for phthalate metabolites (Ye et al., 2008). Measurements for NHANES samples were conducted by the laboratories of the Centers for Disease Control and Prevention (CDC, 2008b). Urinary creatinine (Cr) concentrations were determined and were used to adjust analyte concentrations.
2.3 Daily intake calculations
Daily intakes of BPA, chlorpyrifos/chlorpyrifos-methyl, and several phthalates were estimated from urinary data and were compared with the RfDs (USEPA, 2008) and TDIs (EFSA, 2008). Both RfD and TDI are estimates of the intake of a chemical to which it is believed a person can be exposed daily over a lifetime, without experiencing adverse health effects. RfDs or TDIs are derived from the no observable adverse effect level (NOAEL) in animal studies by the use of uncertainty factors (USEPA, 1993; Herrman and Younes, 1999). The formulas for daily intake estimations and references are as follows:
Where the analyte was BPA (Lakind and Naiman, 2008), TCPy (Koch et al., 2001), or phthalate metabolite (Marsee et al., 2006; Koch et al., 2007;
Wittassek et al., 2007), and FUE is the molar fraction of the parent compound excreted as the urinary metabolite.
Urinary volume increases by about 25% in pregnancy (Maikranz et al., 1989). A validation study in MoBa women showed that the median urinary volume was 2 L/day at 20 weeks of gestation, thus this value was used for all calculations above (Brantsaeter et al., 2009). A mean body weight of 73.5kg was used for each MoBa woman, and reported weights were used for the Generation R and the NHANES women. The DEHP metabolite concentration was the sum of three metabolites MEHP, MEHHP, and MEOHP. The FUE are 0.56 for chlorpyrifos/chlorpyrifos-methyl, 0.69 for di-ethyl phthalate, di-n-nbutyl phthalate, and di-isobutyl phthalate, 0.73 for BBzP, 0.442 for DEHP.
The FUE for BPA is 1 because it is not metabolized to compounds other than conjugates. Daily intakes of OP pesticides were not calculated because FUE is not available for non-specific DAP metabolites.
2.4 Data analysis
Results below the LOD were assigned a value of the LOD divided by the square root of two (Hornung and Reed, 1990). The geometric mean concentration of the ten pooled MoBa specimens (pool-based geometric mean) was estimated for each analyte (Caudill et al., 2007). For Generation R and NHANES, geometric mean concentrations (individual-based geometric means) were calculated for each analyte directly using all individual samples. Appropriate sample weights and clustering factors were used in the NHANES calculation to make our estimates of levels nationally representative, according to the NHANES analytical guidelines (CDC, 2008a). The sample weights for NHANES are based on population estimates that incorporate census counts. These weights were determined for each subject according to the sampling design and were incorporated into the relevant datasets for use. Mean analyte levels in MoBa were compared with those in Generation R and NHANES using a modified t-test (Weinberg and Umbach, 1999):
where X̄ pool is the pool-based mean of the analyte in MoBa; Ȳ individual is the (usual) mean of the analyte in Generation R or NHANES; is the variance of the analyte in the MoBa pooled specimens; and is the (usual) variance of an analyte in Generation R or NHANES; 11 and 110 are the sizes of pooled and individual samples respectively in MoBa; Nindividual is the sample size of the samples in Generation R or NHANES. The degrees of freedom were calculated as 11+Nindividual-4. This test is valid only for the wet-weight (μg/L) concentration (Weinberg and Umbach, 1999) and was thus not used for the creatinine-adjusted results.
3. Results
The MoBa pregnant women had the highest mean BPA concentration (4.50 μg/L and 5.88 μg/g Cr), as shown in Table 1. The mean total DAP metabolite concentration in the pregnant women in MoBa was lower than that in Generation R but higher than that in NHANES. Mean TCPy concentrations were low and similar in all three populations. The women in all three studies had relatively high concentrations of MEP (>300 μg/L or >400 μg/g Cr), a metabolite of diethyl phthalate. The MoBa women and the Generation R women had similar levels of all phthalate metabolites, except that the Generation R women had higher levels of mono-methyl phthalate (MMP, a metabolite of di-methyl phthalate) and mono-n-butyl phthalate (MnBP, a metabolite of di-n-butyl phthalate). Compared with women in NHANES, the MoBa women had a higher concentration of the primary di-(2-methyl-7-hydroxyoctyl) phthalate (DEHP) metabolite MEHP, but lower concentration of the secondary metabolites mono-(2-ethyl-5-hydroxyhexyl) phthalate (MEHHP) and mono-(2-ethyl-5-oxohexyl) phthalate (MEOHP). The mean concentration mono-benzyl phthalate (MBzP) in MoBa was also lower than that in Generation R and in NHANES. The mean concentrations of MnBP in MoBa and in NHANES were similar, but lower than that in Generation R. The biggest difference was found between the two European studies and NHANES for mono-isobutyl phthalate (MiBP), a metabolite of di-iso-butyl phthalate (DiBP). The unadjusted mean MiBP concentration in the two European studies was more than 10 fold higher than that in NHANES; the differences were bigger after creatinine-adjustment. Other phthalate metabolite levels were low and close to the LOD. When the geometric means (estimated, in the case of MoBa) were compared (Table 2), the pattern of differences among metabolite levels in the three studies was similar to that observed with arithmetic means. The estimated average daily intakes of all chemicals of interest were lower than RfDs (USEPA, 2008) and TDIs (EFSA, 2008) (Figure 2).
Table 1.
Comparison of mean concentrations of metabolites of OP pesticides, phthalates, and bisphenol A in urine of pregnant women from MoBaa, Generation Rb, and NHANESc
| Unadjusted (μg/L)
|
Creatinine-adjusted (μg/g) e
|
|||||
|---|---|---|---|---|---|---|
| Analytes | MoBa (Norway) | Generation R (the Netherlands) | NHANES (USA) | MoBa | Generation R (Norway) (the Netherlands) | NHANES (USA) |
| BPA (N) | 10 | 100 | 87 | 10 | 100 | 87 |
| BPA | 4.50 | 2.52 d | 3.93 | 5.88 | 2.91 | 2.75 |
| OP metabolites (N) | 10 | 100 | 119 | 10 | 100 | 119 |
| DMP | 10.39 | 14.87 | 3.22 d | 12.97 | 19.78 | 2.33 |
| DMTP | 9.91 | 15.14 d | 7.09 | 13.21 | 19.42 | 6.47 |
| DMDTP | 0.75 | 0.65 | 1.50 d | 0.98 | 0.85 | 1.22 |
| DEP | 1.94 | 3.83 d | 2.38 | 2.54 | 5.02 | 2.36 |
| DETP | 1.19 | 2.49 | 1.59 | 1.51 | 2.98 | 1.22 |
| DEDTP | 0.18 | 0.10 | 0.17 | 0.02 | 0.12 | 0.18 |
| Total DAP | 24.20 | 37.08 d | 15.96 d | 31.23 | 48.18 | 13.78 |
| TCPy | 2.33 | 3.61 | 2.77 | 2.95 | 4.38 | 2.59 |
| Phthalates (N) | 10 | 100 | 111 | 10 | 100 | 111 |
| MMP | 1.96 | 4.57 d | 2.86 | 2.58 | 7.70 | 2.09 |
| MEP | 309.66 | 358.42 | 968.45 d | 405.87 | 465.81 | 464.31 |
| MOP | <0.50 | 0.68 | 0.71 | 0.34 | 0.85 | 0.72 |
| MCPP | 0.92 | 1.32 | 4.68 d | 1.16 | 1.82 | 3.52 |
| MnBP | 41.12 | 66.76 d | 39.72 | 53.42 | 86.03 | 22.69 |
| MiBP | 56.91 | 70.63 | 5.30 d | 74.25 | 96.40 | 3.30 |
| MBzP | 12.78 | 21.07 | 34.94 d | 16.11 | 25.15 | 21.75 |
| MEHP | 22.32 | 20.69 | 14.32 d | 29.59 | 23.83 | 10.41 |
| MEHHP | 21.88 | 30.26 | 33.56 | 29.01 | 33.44 | 22.80 |
| MEOHP | 21.55 | 30.75 | 26.69 d | 28.49 | 34.62 | 17.82 |
| MECPP | 32.43 | 36.06 | NA | 42.62 | 42.21 | NA |
| MCMHP | 14.12 | 10.11 | NA | 18.29 | 12.77 | NA |
| 7oxo-MMeOP | 4.01 | 7.35 | NA | 5.10 | 9.35 | NA |
| 7OH-MMeOP | 5.92 | 7.45 | NA | 7.48 | 9.94 | NA |
10 pooled samples (11 individual samples in each pool);
100 individual samples;
NHANES 2001–02 for OP metabolites and phthalates and NHANES 2003–04 for BPA;
P<0.05, compared with MoBa;
statistical method is unavailable for comparison of means with concentrations on a creatinine basis.
Abbreviations: DMP, dimethylphosphate; DMTP, dimethylthiophosphate; DMDTP, dimethyldithiophosphate; DEP, diethylphosphate; DETP, diethylthiophosphate; DEDTP, diethyldithiophosphate; TCPy, 3,5,6-trichloro-2-pyridinol; MMP, mono-methyl phthalate; MEP, mono-ethyl phthalate; MOP, mono-n-octyl phthalate; MCPP, mono-(3-carboxypropyl) phthalate; MnBP, mono-n-butyl phthalate; MiBP, mono-isobutyl phthalate; MBzP, mono-benzyl phthalate; MEHP, mono-(2-ethylhexyl) phthalate; MEHHP, mono-(2-ethyl-5-hydroxyhexyl) phthalate; MEOHP, mono-(2-ethyl-5-oxohexyl) phthalate; MECPP, mono-(2-ethyl-5-carboxypentyl) phthalate; MCMHP, mono-(2- carboxymethylhexyl) phthalate; 7oxo-MMeOP, tono-(4-methyl-7-oxooctyl) phthalate; 7OH-MMeOP, mono-(4-methyl-7-hydroxyoctyl) phthalate.
DAP: dialkyl phosphate
N: sample size.
NA: data not available.
Table 2.
Comparison of estimated geometric means for MoBa with observed geometric means for the NHANES and the Generation R Studya
| Unadjusted (μg/L)
|
Creatinine-adjusted (μg/g)
|
|||||
|---|---|---|---|---|---|---|
| Analytes | MoBa (Norway) | Generation R (the Netherlands) | NHANES (USA) | MoBa (Norway) | Generation R (the Netherlands) | NHANES (USA) |
| BPA (N) | 10 | 100 | 87 | 10 | 100 | 87 |
| BPA | 2.81 | 1.08 | 2.52 | 4.11 | 1.67 | 2.04 |
| OP metabolites (N) | 10 | 100 | 119 | 10 | 100 | 119 |
| DMP | 4.10 | 10.10 | 0.94 | 6.22 | 15.70 | 1.03 |
| DMTP | 6.27 | 8.70 | 1.25 | 8.49 | 13.50 | 1.36 |
| DMDTP | 0.35 | 0.37 | 0.18 | 0.50 | 0.58 | 0.19 |
| DEP | 0.99 | 1.99 | 0.71 | 1.42 | 3.09 | 0.77 |
| DETP | 0.30 | 0.79 | 0.47 | 0.42 | 1.23 | 0.51 |
| DEDTP | 0.01 | 0.02 | 0.09 | 0.01 | 0.03 | 0.10 |
| Total DAP | 13.20 | 25.20 | 5.55 | 20.10 | 39.10 | 6.04 |
| TCPy | 0.99 | 1.19 | 1.47 | 1.47 | 1.85 | 1.60 |
| Phthalates (N) | 10 | 100 | 111 | 10 | 100 | 111 |
| MMP | 0.56 | 1.18 | 1.32 | 0.76 | 1.83 | 1.04 |
| MEP | 133.00 | 112.00 | 200.00 | 197.00 | 174.00 | 158.00 |
| MOP | 0.25 | 0.27 | 0.71 | 0.29 | 0.42 | 0.56 |
| MCPP | 0.33 | 0.85 | 2.66 | 0.46 | 1.32 | 2.11 |
| MnBP | 21.70 | 43.20 | 19.80 | 28.90 | 67.10 | 15.70 |
| MiBP | 22.80 | 41.30 | 2.47 | 28.90 | 64.10 | 1.96 |
| MBzP | 5.53 | 8.97 | 17.40 | 8.35 | 13.90 | 13.80 |
| MEHP | 14.12 | 7.06 | 7.31 | 18.40 | 10.90 | 5.80 |
| MEHHP | 15.52 | 14.30 | 19.20 | 21.20 | 22.20 | 15.20 |
| MEOHP | 14.50 | 15.00 | 15.60 | 20.00 | 23.30 | 12.40 |
| MECPP | 21.20 | 19.40 | NA | 30.50 | 30.10 | NA |
| MCMHP | 7.42 | 6.22 | NA | 11.10 | 9.65 | NA |
| 7oxo-MMeOP | 1.43 | 2.52 | NA | 2.02 | 3.91 | NA |
| 7OH-MMeOP | 2.08 | 2.99 | NA | 3.09 | 4.64 | NA |
Geometric means of 10 pooled samples from MoBa (pool-based geometric means) were estimated according to (Caudill, et al., 2007). Geometric means of individual samples (individual-based geometric means) were calculated for Generation R and for NHANES (2001–02 for OP metabolites and phthalates, 2003–04 for BPA). See Table 1 for the results of statistical tests.
Figure 2.

Average daily intakes (μg/kg/day on log scale) estimated from urinary concentrations, compared with the USEPA RfD and EFSA TDI
Abbreviations: USEPA, The United Sates Environmental Protection Agency; RfD, reference dose; EFSA, European Food Safety Authority; TDI, tolerable daily intake; BPA, bisphenol A; DEHP, di-(2-ethylhexyl) phthalate; BBzP, Butyl-benzyl phthalate; DnBP, di-n-butyl phthalate; DiBP, di-isobutyl phthalate.
*The estimates of chlorpyrifos intake may be too high because the metabolite measured also reflects exposure to chlorpyrifos-methyl.
** No EFSA TDI for these.
The estimated average daily intakes of BPA were about 3 orders of magnitude lower than the RfD and TDI (50 μg/kg/day). One of 100 women in Generation R had daily intake of chlorpyrifos/chlorpyrifos-methyl above USEPA RfD (3 μg/kg/day). Three of 100 women (3%) in Generation R and four of 111 women (3.6%) in NHANES had daily intakes of DEHP above EPA RfD (20 μg/kg/day); a daily intake of DEHP above the EFSA TDI (50 μg/kg/day) was found only in 1 woman from Generation R.
4. Discussion
Pooling of biospecimens has been proposed as a way to reduce the cost of studies involving expensive assays while still yielding useful results (Weinberg and Umbach, 1999; Faraggi et al., 2003). Means of pools are equal to means based on individual level data (Weinberg and Umbach, 1999), as has been shown empirically by Skates et al. (2007). We verified this empirically using data in the present study from Generation R and NHANES (data not shown). Pools were simulated by selecting groups of 11 individuals at random and the mean concentrations of the simulated pools were similar to those of means based on individual specimens (0.6±0.5% [mean±standard deviation] difference in means for Generation R; 4.1±3.8% difference in means for NHANES, with a difference of less than 15% for all analytes). For example, the means of BPA were 2.52 μg/L for individual samples and 2.49 μg/L for simulated pooled in NHANES; and were 3.93 μg/L for both individual samples and simulated pools in Generation R. Thus the two types of means were comparable, and pooled specimens can be used to evaluate the average levels of environmental pollutants and their metabolites. However, when the underlying distribution of the analyte has a log normal distribution, as was the case here, geometric means have advantages, but cannot be directly calculated based on pooled data. Caudill et al. (2007) have proposed a method for the estimation of geometric means using observations on pooled samples. Using this method, pool-based geometric means were estimated for MoBa and were compared with individual-based geometric means for Generation R and NHANES. A similar pattern of difference in metabolite levels between MoBa and the other two studies was found based on the geometric means.
BPA is primarily used in the production of polycarbonate plastic and epoxy resins. Polycarbonate plastic is widely used in products that come in contact with food such as infant feeding bottles, tableware, and storage containers. Epoxy resins are used as an internal lining in cans containing food. Diet is the primary source of exposure to BPA for most people (Chapin et al., 2008). Recent studies have shown that canned foods contributed at least 60% to the total daily intake of BPA among adults in Japan (Miyamoto and Kotake, 2006) and the EU (European Commission, 2008). Fish (including shellfish), meat (including meat products), and vegetables (including mushrooms and seaweed) are three of the most important sources of BPA in canned foods (Miyamoto and Kotake, 2006). Compared with people in the US and the Netherlands, Norwegian people consume similar amounts of canned meat and canned vegetables, but greater amounts of canned fish and seafood (3–8 fold higher on kilogram per capita basis) (Euromonitor International, 2008). Canned fish and seafood accounted for about 30% of total canned food consumption in Norway. BPA concentrations in canned fish vary across continents but comparable data for the three countries considered here are not available (Chapin et al., 2008). A recent survey in New Zealand reported that canned tuna had higher levels of BPA than all other types of canned foods except for corned beef and coconut cream (Thomson and Grounds, 2005). In addition to metal cans, in Norway many foods like caviar, mayonnaise, and soft cheeses are sold in metal tubes that are lined with epoxyphenolic resins. The mechanical stress applied to these tubes to extrude the contents can significantly increase migration of BPA (Haverkamp et al., 2008). Whether the higher urinary BPA concentration in pregnant women in MoBa were due to consumption of canned fish or seafood, however, cannot be determined from these data.
Exposure from non-canned food and various environmental media such as water and sediments may also need to be taken into account. Compared to the US and other European countries, Norway had the highest maximum concentration of BPA in fresh water, and the highest median concentration of BPA in freshwater and marine sediment (European Commission, 2008). BPA has also been detected in freshwater fish in Norway (European Commission, 2008). Nonetheless, the estimated daily intakes of BPA in all three studies were far below the EPA RfD and EFSA TDI (50 μg/kg/day).
OP pesticides are widely used in agricultural settings. Humans are exposed to OP pesticides mainly through food (fruits, vegetables, cereals, etc). Upon intake, most OP pesticides are metabolized to 1 to 3 dimethyl phosphates or 1 to 3 DAPs. DAP metabolites are regarded as good indicators of OP exposure although their levels may also reflect exposure to OP breakdown products in the environment and in the food supply and the contribution of some industrial chemicals and drugs (Barr and Needham, 2002). The pregnant women in MoBa and Generation R had higher urinary total DAP levels than pregnant women in the US, suggesting higher level OP pesticide exposure in the two European studies. The European pesticide residue monitoring program showed that the percentage of food samples with detectable pesticide residues increased from 37% in 1996 to 43% in 2005 (European Commission, 2007). Similarly, the proportion of samples with pesticide residues above European Union (EU) maximum risk limits (MRLs) increased from 3% in 1996 to 5.0% in 2004–05. The number of exceedances of EU-MRLs was higher in foods imported from developing countries (6.5% in 2005) than in foods produced in the EU (2.4% in 2005). About half of all foods and more than 90% of fruits and berries sold in Norway are imported (The Federation of International Trade Associations, 2008). The most frequently detected OP pesticides in fruits, vegetables, and cereals were chlorpyrifos, chlorpyrifos-methyl, malathion, and dichlorvos (European Commission, 2007). In the US, the proportions of food items with detectable pesticides were lower (35% for domestic products and 22% for imported products) in 2003, though the difference could be due to analytical methods (FDA, 2005). Similar to the EU, 2.4% of domestic products and 6.1% of imported products had pesticide residues above MRLs in the US. About 15% of food items in the US are imported (Jerardo, 2008). The MRLs in the US for most food items are higher than those in the EU, suggesting that the proportions of US samples above MRLs would be higher if EU-MRLs were used. The four most-often-detected OP pesticides (chlorpyrifos, chlorpyrifos-methyl, malathion, and dichlorvos) in the EU were also the most frequently detected pesticides in the US (FDA, 2005). We speculate that the reason for the higher OP metabolite levels in Norway and Rotterdam could be due to: a) greater use of OP pesticides but at levels that infrequently exceed the MRLs, b) because foods are less frequently washed before consumption, or c) because the types of foods consumed tend to have higher pesticide residue levels.
Chlorpyrifos has been widely used to control crop pests and to reduce pests at home. Chlorpyrifos on food products, however, is the main source of exposure for the general population (ATSDR, 1997). Residential use of chlorpyrifos was restricted by USEPA in 2001 and is being phased out in the EU (Eaton et al., 2008). Chlorpyrifos, a diethyl organophosphate, is metabolized to TCPy, DEP, and DETP (Needham, 2005), and may be the main source of diethyl alkyl metabolites in the populations studied. We note, however, that TCPy is also found in food (ATSDR, 1997), and that chlorpyrifos-methyl is also metabolized to TCPy (ATSDR, 1997; Morgan et al., 2005). Thus, the daily intake of chlorpyrifos may be lower than what we estimated.
Phthalates are industrial chemicals used as plasticizers in many consumer products such as building materials, household furnishings, clothing, food packaging, cleaning materials, personal care products (soap, shampoo, nail polish, etc), and medical devices. Humans are exposed to phthalates through ingestion, inhalation and dermal contact (Latini, 2005). After entering the body, phthalates are rapidly metabolized to their respective monoesters (some of them can be further metabolized to oxidative metabolites) and excreted in the urine and feces (Hauser and Calafat, 2005). The diethyl phthalate metabolite MEP was the predominant metabolite in all populations examined in the present study. The relatively high levels across populations were most likely associated with daily contact with consumer products containing diethyl phthalate. Diethyl phthalate was reported as an ingredient in cosmetic formulations at concentrations ranging from ≤0.1% to 25–50% (ATSDR, 1995). About 70% of cosmetic products in the EU market contained diethyl phthalate in 2002 (DiGangi and Norin, 2002). However, in the three populations considered, the average daily intake of diethyl phthalate was about only one percent of RfD. The relatively high levels of MnBP and MiBP (and relatively high daily intakes of parent phthalates as shown in Figure 2) in MoBa and Generation R women were also likely related to use of personal care and household products. In a 2002 survey, more than half of cosmetic products in the EU market contained more than one type of phthalate and about 40% of the products contained either DEHP or DBP (DiGangi and Norin, 2002). The EU banned the use of DEHP and DBP in personal care and cosmetic products in November 2002. Di-iso-butyl phthalate (DiBP) has similar properties to DBP and has now replaced DBP in many applications including cosmetics. Although higher than those in NHANES, the average daily intakes of DnBP and DiBP in MoBa and Generation R women were only about one percent of the RfDs. For other phthalates analyzed in the present study, data on urinary concentrations or daily intakes showed low levels of exposure among these three populations.
The specimens in MoBa and Generation R were simultaneously analyzed by the same laboratory. This laboratory and the Centers for Disease Control and Prevention laboratories regularly take part in an external quality assessment scheme for the determination of phthalates and organophosphates. Thus, the values for phthalates and DAP metabolites are comparable across laboratories (e.g. similar LODs and recoveries) and the differences in DAP and phthalate metabolites can not be explained by interlaboratory variability. However, the extent to which interlaboratory variability may contribute to the differences in BPA between NHANES, and MoBa/Generation R is uncertain; but the greater level in MoBa compared with Generation R is clear.
The pooling approach has the limitation of not revealing the underlying distributions of biomarker levels, though it seems likely that in the MoBa subjects these would be similar to those in other populations. On the other hand, assuming that the mean exposure level is of interest, for a given number of laboratory assays, estimating the mean with the pooled approach is more efficient than with a random sample when the mean is greater than the LOD (Schisterman and Vexler, 2008), as was the case for all analytes in the MoBa subjects.
Unlike the NHANES women, the pregnant women in MoBa and Generation R were not selected to represent the whole study population nor all pregnant women in the two countries. Thus, the data presented in this paper do not necessarily reflect the national exposure levels in Norway or the Netherlands.
In summary, the pregnant women in MoBa had a higher mean concentration of BPA than the Generation R and the NHANES women. The MoBa and Generation R pregnant women had higher concentrations of total DAP metabolites, and several phthalate metabolites (MnBP, MiBP, and MEHP) than the pregnant women in the NHANES study. The average daily intakes of BPA, chlorpyrifos/chlorpyrifos-methyl, and phthalates were, however, below recommended limits. The higher levels of metabolites in the MoBa participants may have been from intake via pesticide residues in food (organophosphates), consumption of canned food, especially seafood (BPA), and use of personal care products (selected phthalates).
Acknowledgments
This study was supported by the Intramural Research Program of the National Institute of Environmental Health Sciences (NIEHS), the National Institutes of Health (NIH). The Norwegian Mother and Child Cohort Study is supported by the Norwegian Ministry of Health, NIH/NIEHS (grant no N01-ES-85433), NIH/NINDS (grant no.1 UO1 NS 047537–01), and the Norwegian Research Council/FUGE (grant no. 151918/S10). The Generation R study is conducted by the Erasmus MC, University Medical Center, Rotterdam, the Netherlands in close collaboration with the School of Law and Faculty of Social Sciences of the Erasmus University Rotterdam, the Municipal Health Service Rotterdam area, the Rotterdam Homecare Foundation and the Stichting Trombosedienst & Artsenlaboratorium Rijnmond (STAR), Rotterdam. The first phase of the Generation R study is made possible by financial support from the Erasmus MC, Rotterdam, the Erasmus University Rotterdam and the Netherlands Organization for Health Research and Development (ZonMw). We gratefully acknowledge the contribution of general practitioners, hospitals, midwives and pharmacies in Rotterdam, the Netherlands, and in Norway. We are grateful for Clare Weinberg’s help with the modified t-test.
References
- ATSDR. Toxicological profile for diethyl phthalate. Agency for Toxic Substances and Disease Registry (ATSDR), U.S. Department of Health and Human Services (DHHS); Atalanta, GA: 1995. [PubMed] [Google Scholar]
- ATSDR. Toxicological Profile for Chlorpyrifos. Agency for Toxic Substances and Disease Registry (ATSDR), U.S. Department of Health and Human Services (DHHS); Atlanta, GA: 1997. [PubMed] [Google Scholar]
- Barr DB, Allen R, Olsson AO, Bravo R, Caltabiano LM, Montesano A, Nguyen J, Udunka S, Walden D, Walker RD, Weerasekera G, Whitehead RD, Jr, Schober SE, Needham LL. Concentrations of selective metabolites of organophosphorus pesticides in the United States population. Environ Res. 2005;99:314–326. doi: 10.1016/j.envres.2005.03.012. [DOI] [PubMed] [Google Scholar]
- Barr DB, Needham LL. Analytical methods for biological monitoring of exposure to pesticides: a review. J Chromatogr B Analyt Technol Biomed Life Sci. 2002;778:5–29. doi: 10.1016/s1570-0232(02)00035-1. [DOI] [PubMed] [Google Scholar]
- Brantsaeter AL, Haugen M, Julshamn K, Alexander J, Meltzer HM. Evaluation of urinary iodine excretion as a biomarker for intake of milk and dairy products in pregnant women in the Norwegian Mother and Child Cohort Study (MoBa) Eur J Clin Nutr. 2009;63:347–354. doi: 10.1038/sj.ejcn.1602952. [DOI] [PubMed] [Google Scholar]
- Calafat AM, Kuklenyik Z, Reidy JA, Caudill SP, Ekong J, Needham LL. Urinary concentrations of bisphenol A and 4-nonylphenol in a human reference population. Environ Health Perspect. 2005;113:391–395. doi: 10.1289/ehp.7534. [DOI] [PMC free article] [PubMed] [Google Scholar]
- Caudill SP, Turner WE, Patterson DG. Geometric mean estimation from pooled samples. Chemosphere. 2007;69:371–380. doi: 10.1016/j.chemosphere.2007.05.061. [DOI] [PubMed] [Google Scholar]
- CDC. The National Health and Nutrition Examination Survey (NHANES) Analytic and Reporting Guidelines. Hyattsville, MD: U.S. Department of Health and Human Services, Centers for Disease Control and Prevention; 2008a. [accessed on October 1 2008]. Available from [ http://www.cdc.gov/nchs/data/nhanes/nhanes_03_04/nhanes_analytic_guidelines_dec_2005pdf] [Google Scholar]
- CDC. National Health and Nutrition Examination Survey Data. Hyattsville, MD: U.S. Department of Health and Human Services, Centers for Disease Control and Prevention; 2008b. [accessed on October 1 2008]. Available from [ http://www.cdc.gov/nchs/about/major/nhanes/datalink.htm] [Google Scholar]
- Chapin RE, Adams J, Boekelheide K, Gray LE, Jr, Hayward SW, Lees PS, McIntyre BS, Portier KM, Schnorr TM, Selevan SG, Vandenbergh JG, Woskie SR. NTP-CERHR expert panel report on the reproductive and developmental toxicity of bisphenol A. Birth Defects Res B Dev Reprod Toxicol. 2008;83:157–395. doi: 10.1002/bdrb.20147. [DOI] [PubMed] [Google Scholar]
- DiGangi J, Norin H. Pretty Nasty– Phthalates in European Cosmetic Products. Health Care Without Harm; Sweden: 2002. [Google Scholar]
- Eaton DL, Daroff RB, Autrup H, Bridges J, Buffler P, Costa LG, Coyle J, McKhann G, Mobley WC, Nadel L, Neubert D, Schulte-Hermann R, Spencer PS. Review of the toxicology of chlorpyrifos with an emphasis on human exposure and neurodevelopment. Crit Rev Toxicol. 2008;38(Suppl 2):1–125. doi: 10.1080/10408440802272158. [DOI] [PubMed] [Google Scholar]
- EFSA. EFSA re-evaluates safety of bisphenol A and sets Tolerable Daily Intake. [accessed on Oct 1 2008];2008 Available from [ http://www.efsa.europa.eu/EFSA/efsa_locale-1178620753812_1178620835386.htm]
- Engel SM, Berkowitz GS, Barr DB, Teitelbaum SL, Siskind J, Meisel SJ, Wetmur JG, Wolff MS. Prenatal Organophosphate Metabolite and Organochlorine Levels and Performance on the Brazelton Neonatal Behavioral Assessment Scale in a Multiethnic Pregnancy Cohort. Am J Epidemiol. 2007;165:1397–1404. doi: 10.1093/aje/kwm029. [DOI] [PubMed] [Google Scholar]
- Eskenazi B, Marks AR, Bradman A, Harley K, Barr DB, Johnson C, Morga N, Jewell NP. Organophosphate Pesticide Exposure and Neurodevelopment in Young Mexican-American Children. Environ Health Perspect. 2007;115:792–798. doi: 10.1289/ehp.9828. [DOI] [PMC free article] [PubMed] [Google Scholar]
- Euromonitor International. Consumption of canned food in the United States. Norway and the Netherlands; Chicago, IL. USA: 2008. [Google Scholar]
- European Commission. Annual EU-wide Pesticide Residues Monitoring Report - 2005. Brussels, Belgium: 2007. [Google Scholar]
- European Commission. Updated European Risk Assessment Report: 4,4′-isopropylidenediphenol (Bisphenol-A) Ispra, Italy: 2008. [Google Scholar]
- Faraggi D, Reiser B, Schisterman EF. ROC curve analysis for biomarkers based on pooled assessments. Statistics in Medicine. 2003;22:2515–2527. doi: 10.1002/sim.1418. [DOI] [PubMed] [Google Scholar]
- FDA. Pesticide residue monitoring program-2003. Food and Drug Administration (FDA); Atlanta, GA: 2005. [Google Scholar]
- Hauser R, Calafat AM. Phthalates and human health. Occup Environ Med. 2005;62:806–818. doi: 10.1136/oem.2004.017590. [DOI] [PMC free article] [PubMed] [Google Scholar]
- Haverkamp JB, Lipke U, Zapf T, Galensa R, Lipperheide C. Contamination of semi-solid dosage forms by leachables from aluminium tubes. Eur J Pharm Biopharm. 2008 doi: 10.1016/j.ejpb.2008.06.012. [DOI] [PubMed] [Google Scholar]
- Herrman JL, Younes M. Background to the ADI/TDI/PTWI. Regul Toxicol Pharmacol. 1999;30:S109–113. doi: 10.1006/rtph.1999.1335. [DOI] [PubMed] [Google Scholar]
- Hornung RW, Reed LD. Estimation of average concentration in the presence of non-detectable values. Appl Occup Environ Hyg. 1990;5:46–51. [Google Scholar]
- Jaddoe VW, Mackenbach JP, Moll HA, Steegers EA, Tiemeier H, Verhulst FC, Witteman JC, Hofman A. The Generation R Study: Design and cohort profile. Eur J Epidemiol. 2006;21:475–484. doi: 10.1007/s10654-006-9022-0. [DOI] [PubMed] [Google Scholar]
- Jerardo A. [accessed on October 1 2008];What share of US consumed food is imported? 2008 Available from [ http://www.ers.usda.gov/AmberWaves/February08/DataFeature/]
- Kavlock R, Boekelheide K, Chapin R, Cunningham M, Faustman E, Foster P, Golub M, Henderson R, Hinberg I, Little R, Seed J, Shea K, Tabacova S, Tyl R, Williams P, Zacharewski T. NTP Center for the Evaluation of Risks to Human Reproduction: phthalates expert panel report on the reproductive and developmental toxicity of di-n-octyl phthalate. Reprod Toxicol. 2002;16:721–734. doi: 10.1016/s0890-6238(02)00031-x. [DOI] [PubMed] [Google Scholar]
- Koch HM, Becker K, Wittassek M, Seiwert M, Angerer J, Kolossa-Gehring M. Di-n-butylphthalate and butylbenzylphthalate - urinary metabolite levels and estimated daily intakes: pilot study for the German Environmental Survey on children. J Expo Sci Environ Epidemiol. 2007;17:378–387. doi: 10.1038/sj.jes.7500526. [DOI] [PubMed] [Google Scholar]
- Koch HM, Hardt J, Angerer J. Biological monitoring of exposure of the general population to the organophosphorus pesticides chlorpyrifos and chlorpyrifos-methyl by determination of their specific metabolite 3,5,6-trichloro-2-pyridinol. Int J Hyg Environ Health. 2001;204:175–180. doi: 10.1078/1438-4639-00082. [DOI] [PubMed] [Google Scholar]
- Koch HM, Rossbach B, Drexler H, Angerer J. Internal exposure of the general population to DEHP and other phthalates--determination of secondary and primary phthalate monoester metabolites in urine. Environ Res. 2003;93:177–185. doi: 10.1016/s0013-9351(03)00083-5. [DOI] [PubMed] [Google Scholar]
- Lakind JS, Naiman DQ. Bisphenol A (BPA) daily intakes in the United States: Estimates from the 2003–2004 NHANES urinary BPA data. J Expo Sci Environ Epidemiol. 2008 doi: 10.1038/jes.2008.20. [DOI] [PubMed] [Google Scholar]
- Landrigan PJ, Claudio L, Markowitz SB, Berkowitz GS, Brenner BL, Romero H, Wetmur JG, Matte TD, Gore AC, Godbold JH, Wolff MS. Pesticides and inner-city children: exposures, risks, and prevention. Environ Health Perspect. 1999;107(Suppl 3):431–437. doi: 10.1289/ehp.99107s3431. [DOI] [PMC free article] [PubMed] [Google Scholar]
- Lang IA, Galloway TS, Scarlett A, Henley WE, Depledge M, Wallace RB, Melzer D. Association of urinary bisphenol A concentration with medical disorders and laboratory abnormalities in adults. Jama. 2008;300:1303–1310. doi: 10.1001/jama.300.11.1303. [DOI] [PubMed] [Google Scholar]
- Latini G. Monitoring phthalate exposure in humans. Clin Chim Acta. 2005;361:20–29. doi: 10.1016/j.cccn.2005.05.003. [DOI] [PubMed] [Google Scholar]
- Magnus P, Irgens LM, Haug K, Nystad W, Skjaerven R, Stoltenberg C. Cohort profile: the Norwegian Mother and Child Cohort Study (MoBa) Int J Epidemiol. 2006;35:1146–1150. doi: 10.1093/ije/dyl170. [DOI] [PubMed] [Google Scholar]
- Maikranz P, Holley JL, Parks JH, Lindheimer MD, Nakagawa Y, Coe FL. Gestational hypercalciuria causes pathological urine calcium oxalate supersaturations. Kidney Int. 1989;36:108–113. doi: 10.1038/ki.1989.168. [DOI] [PubMed] [Google Scholar]
- Marsee K, Woodruff TJ, Axelrad DA, Calafat AM, Swan SH. Estimated daily phthalate exposures in a population of mothers of male infants exhibiting reduced anogenital distance. Environ Health Perspect. 2006;114:805–809. doi: 10.1289/ehp.8663. [DOI] [PMC free article] [PubMed] [Google Scholar]
- Matsumoto A, Kunugita N, Kitagawa K, Isse T, Oyama T, Foureman GL, Morita M, Kawamoto T. Bisphenol A levels in human urine. Environ Health Perspect. 2003;111:101–104. doi: 10.1289/ehp.5512. [DOI] [PMC free article] [PubMed] [Google Scholar]
- Miyamoto K, Kotake M. Estimation of daily bisphenol a intake of Japanese individuals with emphasis on uncertainty and variability. Environ Sci. 2006;13:15–29. [PubMed] [Google Scholar]
- Morgan MK, Sheldon LS, Croghan CW, Jones PA, Robertson GL, Chuang JC, Wilson NK, Lyu CW. Exposures of preschool children to chlorpyrifos and its degradation product 3,5,6-trichloro-2-pyridinol in their everyday environments. J Expo Anal Environ Epidemiol. 2005;15:297–309. doi: 10.1038/sj.jea.7500406. [DOI] [PubMed] [Google Scholar]
- National Toxicology Program. National Toxicology Program. U.S. Department of Health and Human Services (DHHS); Research Triangle Park, NC: 2008. NTP-CERHR monograph on potential reproductive and developmental effects of bisphenol A. [Google Scholar]
- Needham LL. Assessing exposure to organophosphorus pesticides by biomonitoring in epidemiologic studies of birth outcomes. Environ Health Perspect. 2005;113:494–498. doi: 10.1289/ehp.7490. [DOI] [PMC free article] [PubMed] [Google Scholar]
- Ronningen KS, Paltiel L, Meltzer HM, Nordhagen R, Lie KK, Hovengen R, Haugen M, Nystad W, Magnus P, Hoppin JA. The biobank of the Norwegian Mother and Child Cohort Study: a resource for the next 100 years. Eur J Epidemiol. 2006;21:619–625. doi: 10.1007/s10654-006-9041-x. [DOI] [PMC free article] [PubMed] [Google Scholar]
- Schisterman EF, Vexler A. To pool or not to pool, from whether to when: applications of pooling to biospecimens subject to a limit of detection. Paediatr Perinat Epidemiol. 2008;22:486–496. doi: 10.1111/j.1365-3016.2008.00956.x. [DOI] [PMC free article] [PubMed] [Google Scholar]
- Selevan SG, Kimmel CA, Mendola P. Identifying critical windows of exposure for children’s health. Environ Health Perspect. 2000;108(Suppl 3):451–455. doi: 10.1289/ehp.00108s3451. [DOI] [PMC free article] [PubMed] [Google Scholar]
- Silva MJ, Barr DB, Reidy JA, Malek NA, Hodge CC, Caudill SP, Brock JW, Needham LL, Calafat AM. Urinary levels of seven phthalate metabolites in the U.S. population from the National Health and Nutrition Examination Survey (NHANES) 1999–2000. Environ Health Perspect. 2004;112:331–338. doi: 10.1289/ehp.6723. [DOI] [PMC free article] [PubMed] [Google Scholar]
- Skates SJ, Horick NK, Moy JM, Minihan AM, Seiden MV, Marks JR, Sluss P, Cramer DW. Pooling of case specimens to create standard serum sets for screening cancer biomarkers. Cancer Epidemiol Biomarkers Prev. 2007;16:334–341. doi: 10.1158/1055-9965.EPI-06-0681. [DOI] [PubMed] [Google Scholar]
- Swan SH, Main KM, Liu F, Stewart SL, Kruse RL, Calafat AM, Mao CS, Redmon JB, Ternand CL, Sullivan S, Teague JL. Decrease in anogenital distance among male infants with prenatal phthalate exposure. Environ Health Perspect. 2005;113:1056–1061. doi: 10.1289/ehp.8100. [DOI] [PMC free article] [PubMed] [Google Scholar]
- The Federation of International Trade Associations. [accessed on Oct 1 2008];Country profiles and resources: Norway. 2008 Available from [ http://www.fita.org/countries/norway.html]
- Thomson BM, Grounds PR. Bisphenol A in canned foods in New Zealand: an exposure assessment. Food Addit Contam. 2005;22:65–72. doi: 10.1080/02652030400027920. [DOI] [PubMed] [Google Scholar]
- USEPA. Reference Dose (RfD): Description and Use in Health Risk Assessments. National Center of Environmental Assessment, US Environmental Protection Agency; 1993. [accessed on February 1, 2009]. Available from [ http://www.epa.gov/NCEA/iris/rfd.htm] [Google Scholar]
- USEPA. Intergrated Risk Information System. National Center of Environmental Assessment, US Environmental Protection Agency; 2008. [accessed on December 2 2008]. Available from [ http://cfpub.epa.gov/ncea/iris/index.cfm] [Google Scholar]
- Weinberg CR, Umbach DM. Using pooled exposure assessment to improve efficiency in case-control studies. Biometrics. 1999;55:718–726. doi: 10.1111/j.0006-341x.1999.00718.x. [DOI] [PubMed] [Google Scholar]
- Wittassek M, Heger W, Koch HM, Becker K, Angerer J, Kolossa-Gehring M. Daily intake of di(2-ethylhexyl)phthalate (DEHP) by German children -- A comparison of two estimation models based on urinary DEHP metabolite levels. Int J Hyg Environ Health. 2007;210:35–42. doi: 10.1016/j.ijheh.2006.11.009. [DOI] [PubMed] [Google Scholar]
- Ye XB, Pierik FH, Hauser R, Duty S, Angerer J, Park MM, Burdorf A, Hofman A, Jaddoe VWV, Mackenbach JP, Steegers EAP, Tiemeier H, Longnecker MP. Urinary metabolite concentrations of organophosphorous pesticides, bisphenol A, and phthalates among pregnant women in Rotterdam, the Netherlands: The Generation R Study. Environ Res. 2008;108:260–267. doi: 10.1016/j.envres.2008.07.014. [DOI] [PMC free article] [PubMed] [Google Scholar]