

Abstract
Background & Aims
Recruitment and proliferation of Thy-1+oval cells is a hallmark of liver regeneration after 2-acetylaminofluorene (2-AAF)/partial hepatectomy (PHx) in rats. To understand the molecular mechanism underlying this process, we investigated the role of connective tissue growth factor (CTGF), one of the candidate genes differentially expressed in Thy-1+oval cells, in this liver injury model.
Methods
Northern and Western analyses were performed to examine the induction of CTGF in total liver homogenate. Quantitative real-time polymerase chain reaction (PCR), immunofluorescent staining, and in situ hybridization were performed to confirm the expression and localization of CTGF in Thy-1+oval cells. Finally, a known inhibitor of CTGF synthesis, Iloprost, was administered to 2-AAF/PHx treated rats to investigate the effect of Iloprost on oval cell response.
Results
CTGF was found to be up-regulated at both the RNA and protein levels and occurred concurrently with an up-regulation of transforming growth factor β1 (TGF-β1). Sorted Thy-1+oval cells expressed a high level of CTGF gene in a quantitative PCR assay. Colocalization of Thy-1 antigen and ctgf signals by in situ hybridization further confirmed that Thy-1+oval cells were a source of CTGF. Iloprost administration blocked CTGF induction in treated animals but did not affect TGF-β1 expression. The inhibition of CTGF induction by Iloprost was associated with a significant decrease in oval cell proliferation and a lower level of α-fetoprotein expression as compared with control animals.
Conclusions
These results show that CTGF induction is important for robust oval cell response after 2-AAF/PHx treatment in rats.
Liver regeneration involves waves of liver cell proliferation, migration, and differentiation mediated by a complex mixture of cytokines and chemokines to restore liver mass and function.1 When hepatocyte proliferation is suppressed by chemical agents, a distinct progenitor cell, called the oval cell, is recruited to aid in liver regeneration.2,3 This phenomenon is well shown by the modified Solt-Farber liver injury model, in which, 2-acetylaminofluorene (2-AAF) administration combined with partial hepatectomy (PHx) triggers oval cell activation and proliferation in the periportal region of the liver lobule.3 2-AAF–induced oval cells originate from the biliary ductular epithelia and are characterized by expression of phenotypic markers such as α-fetoprotein (AFP), CK19, and Thy-1 surface antigen.4,5
Connective tissue growth factor (CTGF) is a 38-kDa, secretory protein that is a member of the ctgf/ cyr61/nov (CCN) protein family.6,7 It can act on many cell types regulating proliferation, apoptosis, differentiation, angiogenesis, migration, adhesion, and extra-cellular matrix (ECM) production.7 CTGF expression can be transcriptionally activated by transforming growth factor β1 (TGF-β1) through a response element located in the promoter region of the CTGF gene.8,9 CTGF acts as a downstream effector of TGF-β1 to stimulate fibrotic processes, promoting fibroblast proliferation, migration, and ECM production.10 Recently, it has been found that the prostacyclin derivative, Iloprost, can effectively suppress TGF-β1–mediated induction of CTGF synthesis and decrease fibrosis in animal models and human studies.11,12 As a potent agonist to Gs-protein– coupled IP receptor, Iloprost causes the elevation of intracellular cAMP, activation of adenylyl cyclase and protein kinase A, and suppression of ERK phosphorylation.11,12 Therefore, inhibition of CTGF transcription is believed to involve activation of protein kinase A and subsequent inhibition of the Ras/MEK/ERK pathway.11
In normal livers, CTGF is expressed at a low level in venous endothelial cells and arterial myocytes.13 However, a significant induction of CTGF transcription has been noted in several human conditions including liver fibrosis, chronic liver diseases, and nonalcoholic steatohepatitis.14,15 The up-regulation of CTGF has also been reported in experimental liver injuries.16 Immunohistochemistry and in situ hybridization experiments in these models show the expression of CTGF in several types of hepatic cells including stellate cells and proliferating epithelial cells.13,15,16 Despite these studies, the exact role of CTGF during oval cell mediated liver regeneration remains unknown.
To characterize the genes involved in oval cell activation, we have identified several genes which are up-regulated in the nonparenchymal cell population in the 2-AAF/PHx model. Herein, we report CTGF induction in oval cells from 2-AAF/PHx-treated rats. Furthermore, inhibition of CTGF up-regulation by Iloprost significantly decreases the number of oval cells after 2-AAF/PHx, indicating the importance of this growth factor to the oval cell response.
Materials and Methods
Animals and Experimental Groups
Male Fischer 344 rats (120 –150 g) were used for all experiments, and all procedures were conducted according to institutionally approved protocols. Time-released 2-AAF pellets were inserted subcutaneously 7 days before 70% PHx. All time points indicate days after PHx.
Suppression Subtractive Hybridization Library Construction
A suppression subtractive hybridization (SSH) library was generated from Thy-1+ oval cells and nonparenchymal cells as tester and driver populations, respectively. The pools of Thy-1+ oval cells were isolated from 20 livers of 9 –11 days post 2-AAF/PHx. Nonparenchymal cells were isolated from 3 normal rat livers. Thy-1+ cell isolation by flow cytometry was performed according to published methods.5 Total RNA and polyA RNA from both populations were isolated using RNEasy kit (QIAGEN, Chats-worth, CA) and Poly(A)Purist mRNA Purification Kit (Ambion, Austin, TX) according to the manufacturer’s instructions.
The SSH was performed with the Clontech PCR-Select cDNA Subtraction Kit (Clontech Laboratories Inc, Palo Alto, CA) according to the manufacturer’s instructions. The identified polymerase chain reaction (PCR) products were cloned into the pCR 4.1 plasmid vector (TA Cloning kit; Invitrogen, Carlsbad, CA). The identity of the cDNA inserts was revealed by sequence analysis of purified plasmids and compared with known DNA sequences using the BLAST algorithm.
Northern Blot Analysis
In Northern analysis, groups consisted of 3 animals each and were tested at time points 0, 3, 5, 7, 9, 11, and 13 day post PHx. Total RNA was prepared from snap-frozen liver tissues using RNAstat Reagent (Tel-Test Inc, Friends-wood, TX). Total pooled RNA (approximately 20 μg) was used for Northern analysis. The rat CTGF clone obtained from cDNA library was used as a probe. Probes for TGF-β1 and pro-collagen type I were generated by PCR using published primers sequences.17 Fibronectin and AFP probes were from a plasmid containing corresponding complementary DNA sequences (Genebank/EMBL accession number NM_019143.1, NM_012493.1). Hybridization was performed with [32P]-dCTP–labeled probes (Amersham Life Science, Piscataway, NJ) at 42°C in 50% formamide; 5× sodium chloride, sodium phosphate, and EDTA; 5× Denhart, 2% sodium dodecyl sulfate (SDS), and 10% dextran sulfate.
Western Analysis
The full-length CTGF cDNA was amplified by reverse-transcription PCR with a primer set 5′ GCTAGCCCTCCTGCCGCGCCCCGACCATGCTCGCC3′ and 5′ GGATCCCGCCATGTCTCCATACATCTTCCTGT3′ and cloned into flag-pGEM- vector, which contained the flag epitope sequence (a generous gift from Dr WY Song). The resulting clone was confirmed by sequencing. The CTGF complementary DNA and flag sequences were released by SpeI digestion and further cloned into pFastBac vector (Invitrogen). CTGF-flag protein was expressed in Sf9 insect cells according to manufacturer’s instruction.
Total proteins were extracted from liver homogenates in RIPA buffer (50 mTris-HCl, pH 7.4; 1% NP-40; 0.25% Na-deoxycholate; 150 mmol/L NaCl; 1 mmol/L EDTA; 1 mmol/L phenylmethylsulfonyl fluoride (PMSF); 1 μg/mL aprotinin, leupeptin, and pepstatin; 1 mmol/L Na3VO4; 1 mmol/L NaF), separated in 10% SDS-polyacrylamide gel electrophoresis gel and electrotransferred to polyvinylidene difluoride (PVDF) membrane. Membrane was blocked in Tris-buffered saline (TBS) containing 4% body surface area and 0.1% Tween 20. A rabbit antimouse CTGF antibody (Abcam, Cambridge, MA) was used as a primary antibody at 1:2000 dilution in TBS containing 5% milk and 0.1% Tween 20. A calf antirabbit IgG (Santa Cruz Biotechnologies, Santa Cruz, CA) was used as a secondary antibody at a 1:5000 dilution. Detection was performed using the ECL plus kit (Amersham Life Science, Piscataway, NJ).
Tissue Staining and In Situ Hybridization
Immunofluorescent staining and in situ hybridization were performed on the same liver sections. Livers were perfused with 4% paraformaldehyde and 0.05% glutaraldehyde according to a previously published method.18 Cryosections, 6 μm thick, were cut at −20°C and dried overnight at 40°C before analysis.
Immunostaining was performed before in situ hybridization. Sections were washed in TBS containing 1 mmol/L CaCl2, permeablized in methanol at −20°C and blocked with protein blocking agent (Thermo Shandon, Pittsburgh, PA). Slides were stained with mouse antirat Thy-1 antibody (PharMingen, San Diego, CA) at a dilution of 1:50. Alexa Fluor 594-labeled goat antimouse (Molecular Probes, Eugene, OR) was used as the secondary antibody at a dilution of 1:500.
In situ hybridization was performed immediately after immunostaining. The hybridization was performed according to published protocols in the nonradioactive In Situ Hybridization Application Manual (Roche, Basel, Switzer-land). A 430-bp region of rat CTGF cDNA (Genebank/ EMBL accession number NM_022266) was amplified13 and cloned into PCR4 TOPO vector. The linearized clones from both directions served as sense and antisense templates for digoxigenin (DIG)-riboprobe synthesis using T7 RNA polymerase. Sections were hybridized in buffer containing 40% deionized formamide, 10% dextran sulfate, 1× Denhardt’s solution, 4× standard saline citrate (SSC), 10 mmol/L DTT, 1 mg/mL denatured and sheared salmon sperm DNA with 5 ng/μL DIG-labeled RNA antisense or sense probes at 58°C for 40 hours. After hybridization, slides were washed in 2× SSC followed by 1× SSC. Next, samples were digested in 10 μg/mL RNAase and washed in 0.1× SSC to remove nonhybridized RNA. The DIG signal was detected with sheep; anti–DIG-alkaline phosphatase (Roche, Basel, Switzerland) and nitro blue tetrazolium chloride (NBT)/5-bromo-4-chloro-3-indolyl phosphate (BCIP) substrates were used for color detection.
Quantitative Real-Time PCR
A 2-step quantitative real-time PCR reaction was performed with the ABI PRISM 5700 Sequence Detection System (Perkin-Elmer Applied Biosystems, Foster City, CA). CTGF primers were based on published sequences14 with the following modifications. Total RNA was extracted using the Qiagen RNA kit, and any DNA contamination was removed by DNase I treatment (Ambion, Austin, TX). Total RNA was reverse transcribed with random hexamers using first-strand cDNA synthesis kit (Invitrogen; Carlsbad, CA) following manufacturer’s instructions. Amplification reactions were performed using a SYBR Green PCR Core reagent kit (Applied Biosystems, Foster City, CA). Amplification conditions were as follows: 2 minutes at 50°C, 10 minutes at 95°C followed by 40 cycles of 15 seconds at 95°C and 1 minute at 60°C in the presence of 500 nmol/L forward and reverse primers, 5 mmol/L MgCl2, 50 mmol/L KCl, 10 mmol/L Tris buffer (pH 8.3), 200 μmol/L dATP, dCTP, dGTP, 400 μmol/L dUTP, 0.25 unit AmpErase UNG (Applied Biosystems; Foster City, CA), and 1 unit AmpliTaq.
For AFP RNA quantification, AFP probe and primers were purchased (Applied Biosystems, One-step real-time PCR was conducted on DNase I–treated RNA samples using the following amplification conditions: 30 minutes at 48°C and 10-minute step at 95°C followed by 40 cycles of 15 seconds at 95°C and 1 minute at 60°C; 0.5 μmol/L primers for 18s ribosome RNA and 2.0-μmol/L probe (Applied Biosystems) were used in both 1-step and 2-step real-time PCRs. The comparative-CT (threshold cycle) method against the expression level of 18s ribosomal RNA was used for quantitation.
Iloprost Treatment and In Vivo BrdU Labeling
Ten rats underwent 2-AAF/PHx as described previously. Half were injected with Iloprost through tail vein and the other half were injected with phosphate-buffered saline (PBS) solution as controls. For Iloprost treatment, Iloprost stock solutions in ethanol (Cayman Chemical, Ann Arbor, MI) were diluted to 5 μg/mL in PBS immediately before use. Approximately 33 μg/kg Iloprost was administered via the tail vein daily beginning at day 1 after PHx until the day before end points (days 5, 7, and 9 after PHx). Two rats per group were killed at time points day 7 and day 9. To perform in vivo BrdU labeling, 50 mg/kg BrdU in 1× PBS was injected 2 hours before sacrifice. BrdU staining and H&E staining were performed on liver sections with standard protocols.
Statistical Analysis
Values are expressed as the mean ± standard deviation (SD). SD and statistical significance were determined by Student t test with the statistical software included in Microsoft Excel (Microsoft, Redmond, WA). P values of <.05 were considered to be statistically significant.
Results
CTGF Is Up-regulated at Both RNA and Protein Levels in Rat Livers After 2-AAF/PHx
Thy-1 surface antigen has been found mainly in the hematopoietic system. Consistent with previous findings,5 very few Thy-1+ cells were observed in normal liver (Figure 1A). At day 0 post-PHx, no increase in Thy-1+ cells was seen (data not shown), indicating that 2-AAF alone had no effect on Thy-1 antigen expression. By day 3 after PHx, an increase in Thy-1+ cells was noted in the periportal region. By day 7 to 9 after PHx, a very robust Thy-1+ cell response had developed (Figure 1B). Using fluorescent activated cell sorting (FACS) analysis, we were able to enrich the Thy-1+ cell population to a purity of 95%–97%.5 This enriched cell population was used in suppression subtractive hybridization studies to identify genes that are differentially expressed in Thy-1+ oval cells as compared with normal nonparenchymal cells. Out of 45 SSH clones, representing 9 unique genes, we identified one containing a 177-bp fragment identical to the 3′ untranslated region of the rat CTGF gene (Genebank/EMBL accession number NM_022266).
Figure 1.
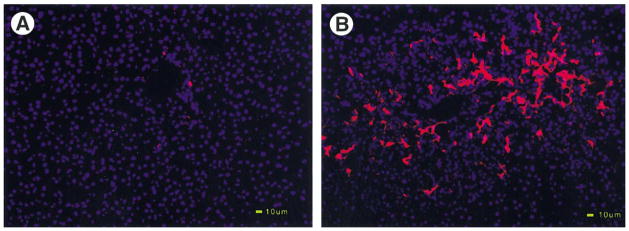
Massive proliferation of Thy-1+ oval cells in portal region during liver regeneration after 2-AAF/PHx. Frozen liver sections were examined by immunohistochemistry for Thy-1 antigen. Blue color indicates DAPI stained DNA, whereas red indicates Texas red signal for Thy-1 antigen. (A) Normal. (B) 2-AAF/PHx treated liver (day 9). Both images were taken at 200×. Scale bar: 10 μm.
To confirm the induction of the CTGF gene during oval cell–aided liver regeneration, Northern blot analysis was performed using the SSH clone carrying CTGF sequence as a probe. Time points of 0, 3, 5, 7, 9, 11, 13, and 15 days after PHx were chosen to bracket the entire oval cell activation and proliferation period.2,20 Periods between days 11 to 15 post-PHx include the early stage of oval cell differentiation as the transition of oval cell into basophilic hepatocytes begins around day 11.2,14 Expression of the CTGF gene began at day 5 after 2-AAF/PHx with maximal expression seen at day 7 and day 9 (Figure 2A). By day 13, the level of CTGF had begun to decline and was back to a basal level by day 15. The time course of this induction indicates that CTGF is associated with oval cell proliferation but not oval cell differentiation.
Figure 2.

Induction of CTGF expression in the 2-AAF/PHx model. (A) Northern blot analysis of whole liver homogenate shows induction of CTGF message beginning at day 5 and reaching a shoulder peak around day 7 to 9 post PHx. N represents normal liver. (B) Western blot analysis of whole liver homogenate shows accumulation of CTGF protein. Actin was used as a loading control.
CTGF protein levels were measured during oval cell activation by Western blot analysis. Because of the multiple bands detected in total liver extracts, we engineered a construct containing a flag epitope sequence before the stop codon of the full-length CTGF cDNA. The flag epitope consists of 8 amino acids and adds 1.2 kDa to the molecular weight of the protein. Purified flag tagged CTGF proteins were isolated from Sf9 insect cells and served as a positional marker for native CTGF from total liver protein extracts. A 38-kDa protein, consistent with the predicted size of CTGF, was observed in 2-AAF/PHx treated livers (Figure 2B). The significant induction of CTGF protein was observed over day 5 to day 9 after PHx and decreasing thereafter. The sudden increase of CTGF protein at day 5 may indicate release of bound CTGF, perhaps from degraded ECM. After all, the whole pattern of CTGF protein induction is consistent with our observations regarding CTGF message expression during the oval cell response to 2-AAF/PHx.
Thy-1+Oval Cells Appear to be a Major Source of CTGF in Oval Cell–aided Liver Regeneration
The possibility that oval cells are, themselves, a source of CTGF was investigated by 2 approaches. At first, CTGF gene expression in sorted Thy-1+ oval cells was measured by quantitative real-time PCR. In comparison to normal liver, a statistically significant 3.5-fold increase (P < .05) in CTGF was detected in Thy-1+ cells sorted from animals sacrificed at day 9 after 2-AAF/PHx. In contrast, the unsorted and total liver extract from animals sacrificed at the same time point showed only a 2.2-fold increase in CTGF (Figure 3A). The higher expression of CTGF in the enriched Thy-1+ oval cell population indicates that Thy-1+ oval cells are a source of CTGF.
Figure 3.

Thy-1+ oval cells express CTGF transcript. (A) Real-time PCR shows induction of CTGF in both whole rat liver and Thy-1 sorted oval cells after 2-AAF/PHx compared with those of normal livers. N indicates normal livers. Values in normal livers are arbitrarily assigned to 1 unit. Data represent the mean value ± SD (n ≥ 3). *P < .05. (B) In situ hybridization negative control probed with sense CTGF (200×). Thy-1+ oval cells obtained at day 9 after 2-AAF/PHx treatment shown in (C) and (E) were stained in red. In situ hybridization of the same section with CTGF antisense probe in (D) and (F) shows dark brown signals for CTGF transcripts. Blue arrows indicate the colocalization of CTGF transcripts in Thy-1+ oval cells. Images of B, C, and D were taken at 200×. E and F were taken at 400×. E and F were the large magnifications of C and D, respectively.
Immunofluorescent staining for Thy-1 and in situ hybridization for CTGF message was used to localize CTGF message. The anti–Thy-1 antibody clearly labeled the periportal oval cell population (Figure 3C and E). Despite the fact that not all cells expressing CTGF transcripts are Thy-1+, there were many Thy-1+ oval cells that express CTGF (Figure 3D and F). As a control, sense CTGF riboprobe did not hybridize with any cells in the portal tract (Figure 3B). The colabeling by immunostaining and in situ hybridization support the real-time PCR results indicating Thy-1+ oval cells express CTGF.
Coordinated Expression of TGF-β1, Pro-collagen Type I, and Fibronectin During Oval Cell–aided Liver Regeneration
It has been established that CTGF is a downstream mediator of the fibrogenic properties of TGF-β1, stimulating the expression of ECM genes in many biological processes. Here, we performed a Northern blot analysis to compare the CTGF induction pattern with those of TGF-β1 and 2 other ECM genes: pro-collagen type I and fibronectin. TGF-β1 was induced at day 3 (Figure 4), just before CTGF induction. The level of TGF-β1 was maximal at day 9 and decreased thereafter. This pattern is consistent with the notion that TGF-β1 stimulates the transcription of CTGF after 2-AAF/PHx.
Figure 4.

Coordinated expression of TGF-β1, pro-collagen type I, and fibronectin in oval cell–aided liver regeneration. Northern blot analysis shows TGF-β1 and ECM proteins are induced simultaneously with CTGF after 2-AAF/PHx treatment in rats. GADPH was used as a loading control.
CTGF can induce ECM genes. Pro-collagen type I and fibronectin were found to be up-regulated after 2-AAF/ PHx, reaching maximal expression at day 7 and 9 (Figure 4). This coincides with the induction of CTGF. These results support the hypothesis that CTGF is induced through the TGF-β1–mediated signaling pathway, which ultimately leads to the synthesis of ECM during liver regeneration.
Iloprost Suppresses Induction of CTGF Without Affecting TGF-β1 Induction in the 2-AAF/PHx Model
The synthetic prostacyclin derivative, Iloprost, has been shown to block TGF-β1–induced CTGF synthesis in both sclerotic diseases and in mouse wound healing models. 2-AAF/PHx treated rats were administered Iloprost (33 μg/kg per day intraperitoneally) in an attempt to suppress CTGF induction. Three time points, day 5, 7, and 9 after PHx, representing the initial and peak points of CTGF expression in the 2-AAF/PHx model, were selected for Northern analysis. CTGF message levels were barely detectable at all 3 points in animals treated with Iloprost (Figure 5). An expected, strong CTGF induction was seen in control animals that received PBS alone in tail vein injection. Interestingly, TGF-β1 induction seemed not to be affected by Iloprost as evidenced by a similar elevation of TGF-β1 in both Iloprost-treated and untreated animals at all three time points. These results indicate that Iloprost effectively blocks CTGF induction without affecting TGF-β1 up-regulation in the 2-AAF/PHx model.
Figure 5.

Iloprost blocks up-regulation of CTGF but does not affect TGF-β1 induction after 2-AAF/PHx treatment. Northern blot analysis showed that CTGF up-regulation is blocked, whereas TGF-β1 expression remains unaffected by Iloprost in 2-AAF/PHx-treated rats. GADPH was used as a loading control.
Iloprost Attenuates the Oval Cell Response to 2-AAF/PHx
Iloprost effectively blocks CTGF induction in the 2-AAF/PHx model. H&E staining of paraffin sections was used to determine whether Iloprost causes any change in the oval cell response. Histological analysis showed a robust oval cell response in the periportal region of liver lobules at day 7 and 9 after after PHx (Figure 6A and C). In contrast, there was a markedly reduced oval cell response in Iloprost-treated animals (Figure 6B and D).
Figure 6.

Decrease in the number of histologically evident oval cells in Iloprost-treated rat liver after 2-AAF/PHx. (A) Portal regions of H&E-stained liver sections from 2-AAF/PHx-treated rats contain an abundance of cells with high nuclear to cytoplasm ratio (40×). (B) Far fewer of these cells are seen in sections from rats that received Iloprost (40×). (C) Magnification of the area outlined in A (400×). (D) Magnification of the area outlined in B (400×).
Next, oval cell proliferation was monitored by in vivo BrdU labeling. S-phase cells labeled by BrdU in Iloprost-treated animals were compared with those of control animals. In control animals, more than 32.45 ± 1.4 cells/ periportal region were in S-phase at day 7 post PHx. By day 9 post PHx, around 42.39 ± 9.41 cells/periportal region were found to be in S-phase (Figure 7A, C, and E). In contrast, an approximate 3.26-fold decrease of S-phase cells at day 7 and a 2.42-fold decrease of S-phase cells at day 9 post PHx in Iloprost-treated animals were observed as compared with those of control animals (Figure 7B, D, and E). These BrdU-positive cells were more evenly distributed across the liver lobule in Iloprost-treated animals. Because stellate cells also proliferate after oval cell activation and proliferation after the treatment of 2-AAF/PHx, the decreased number of BrdU staining cells in Iloprost-treated animals may also represent reduced stellate cell activation. These observations indicate that Iloprost diminishes proliferation of periductular cells in 2-AAF/PHx–treated animals.
Figure 7.

Decrease in the number of proliferating cells in Iloprost-treated rat livers after 2-AAF/PHx. (A) Portal regions of BrdU-stained liver sections from day 7; 2-AAF/PHx-treated rats contain a high number of proliferating cells (40×). (B) A dramatic decrease in proliferation is seen in sections from rats that received Iloprost (40×). (C) Magnification of the area outlined in A (400×). (D) Magnification of the area outlined in B (400×). (E) Quantitation of BrdU-positive cells in periportal regions at day 5, 7, and 9 after 2-AAF/PHx in Iloprost-treated (black bars) as compared with control (open bars) rats. The number of BrdU-positive cells was counted in >10 periportal areas selected randomly in each specimen stained with hematoxylin. Each value represents the mean ± SD.
It is known that AFP is expressed by oval cells participating in oval cell–aided liver regeneration. AFP expression decreases as oval cells begin to differentiate into hepatocytes, disappearing entirely on completion of liver regeneration.19 AFP expression in Iloprost-treated animals was determined by quantitative real-time PCR. The AFP message level was decreased 3.4-fold at day 7 after PHx in Iloprost-treated animals. By day 9, AFP message is decreased 4.76-fold as compared with the control group (Figure 8A). The decrease of AFP expression in Iloprost-treated animals was further verified by Northern analysis shown in Figure 8B. These results suggest that Iloprost treatment can effectively suppress the oval cell response brought on by 2-AAF/PHx treatment.
Figure 8.

AFP message is decreased in Iloprost-treated rat liver after 2-AAF/PHx. (A) Quantitative, real-time PCR shows a substantial reduction in liver AFP message after 2-AAF/PHx treatment in rats that received Iloprost (second set of bars) as compared with control rats (first set of bars). Data are normalized to the Iloprost-treated sample at day 5 after 2-AAF/PHx. Data represent the mean value ± SD (n ≥3). (B) AFP expressions at day 5, 7, and 9 in Iloprost-treated animals were significantly reduced compared with those of control animals in a Northern analysis.
Discussion
Oval cell–mediated liver regeneration involves the secretion of a complex mixture of cytokines and growth factors to regulate the proliferation and expansion of oval cells.19 However, the molecular mechanism underlying this process is not fully understood. The present study used SSH technique to identify CTGF as a candidate gene from a cDNA library enriched for genes expressed in Thy-1+ oval cells. Consistent with previous findings that CTGF is involved in tissue regeneration and remodeling,14,15,20 this article shows a significant up-regulation of CTGF messenger RNA and protein in rat liver after 2-AAF/PHx treatment (Figure 2). The induction of CTGF occurs from day 5 to day 15 post PHx with a peak at day 9. Compared with CTGF expression during liver regeneration in rats after PHx alone or D-galactosamine (GalN) exposure,16 the expression of CTGF in our liver injury model is prolonged. The sustained expression of CTGF may represent a critical component in the activation of oval cells, most likely through the TGF-β1 pathway.
CTGF is expressed by Thy-1+ oval cells. Thy-1+ oval cells are scarce in normal liver, whereas a large population of Thy-1+ immunoreactive cells has been observed in the 2-AAF/PHx model.5 By quantitative real-time PCR, immunohistochemistry and in situ hybridization, we have shown that Thy-1+ oval cells express CTGF. Based on the fact that CTGF promotes the migration and proliferation of stellate cells in tissue culture condition21 and that activated stellate cells are seen within the oval cell compartment,22 it is likely that the CTGF protein expressed by Thy-1+ oval cells may be acting in a paracrine manner to promote the migration and proliferation of the stellate cells in the 2-AAF/PHx model. If so, CTGF may be assisting the oval cells indirectly by stimulating stellate cells to expand and remodel the ECM. Alternatively, CTGF may act on Thy-1+ oval cells themselves. It is known that CTGF can stimulate cells via integrin and heparin-sulfate proteoglycan.23 One of the candidate genes differentially expressed in Thy-1+ oval cells encodes chondroitin sulfate proteoglycan peptide core protein (Genebank/EMBL accession number NM_020074.1). Northern results show that this gene is expressed specifically and, to a great extent, in the Thy-1+ oval cell population (data not shown). It is likely that Thy-1+ oval cells possess integrin and heparin-sulfate proteoglycan and are responsive to CTGF signaling. Future studies to test the biological activities of CTGF in Thy-1+ oval cells in vitro would be needed to verify this possibility.
There are other types of cells that are Thy-1− but express CTGF as detected by immunofluorescent staining and in situ hybridization (Figure 3C, D, E, and F). These CTGF expressing cells are most likely stellate cells because it has been shown that stellate cells are coactivated with oval cells in the 2-AAF/PHx model and also express CTGF in several liver remodeling processes including hepatic fibrosis and liver regeneration after PHx or GalN exposure.10,16 The temporal relationship between CTGF activation in the Thy-1+ and Thy-1− cell populations is unclear. It is possible that production of CTGF by one of these cell types may function in a paracrine manner to activate the other.
It is known that TGF-β1 is one of the most potent inducers of CTGF and promotes CTGF expression in fibroblasts through a complex network of transcriptional interactions requiring Smads, protein kinase C and ras/ MEK/ERK, and a consensus transcriptional enhancer factor– binding element in the CTGF promoter.8,9,24 Consistent with previous findings,25 the level of TGF-β1 messenger RNA is increased after 2-AAF/PHx (Figure 4). Both TGF-β1 and CTGF show a similar expression pattern with the exception of an earlier induction in TGF-β1 expression. The earlier induction of TGF-β1 supports the hypothesis that TGF-β1 stimulates CTGF after 2-AAF/PHx treatment. In contrast, 2 ECM proteins, fibronectin and pro-collagen type I, are constitutively expressed during the course of oval cell–aided liver regeneration. Interestingly, a significant elevation of these 2 genes is associated with the increase of CTGF gene expression (Figure 4). This result is consistent with the notion that CTGF stimulates the expression of ECM proteins, at least in stellate cells.
Recently, a study has shown that Iloprost suppresses TGF-β1 induction of collagen and CTGF in fibroblasts in the skin of scleroderma patients.12 The inhibition of CTGF by Iloprost also reduces the collagen levels during TGF-β1–induced fibrosis in the mouse wound chamber model.11 In this study, we show that Iloprost effectively blocks CTGF induction during oval cell activation and proliferation in the 2-AAF/PHx model. CTGF expression was significantly decreased in Iloprost-treated animals at all time points tested. Although treatment with Iloprost abolishes CTGF expression, it has little effect on TGF-β1 induction. These results are in agreement with the proposed mechanism of Iloprost activity, which blocks CTGF synthesis downstream of TGF-β1 induction. Iloprost treatment was found to be associated with a decreased number of histologically evident oval cells, as well as a significantly decreased number of S-phase cells. Furthermore, we show that the oval cell compartment in Iloprost treated animals expresses lower levels of AFP, an oval cell marker. The concurrent decrease in AFP expression is clear evidence for impaired oval cell response. Given that the regulation of CTGF expression by TGF-β is through a complex network of transcriptional interaction and the action of Iloprost on CTGF involves at least the ras/MEK/ERK signal pathway, it is difficult to determine whether the impaired oval cell response truly results from the lack of CTGF induction rather than from silencing of another signaling pathway. It is, however, apparent that Iloprost does not generally inhibit proliferation because hepatocytes divide normally in Iloprost-treated animals that were given PHx alone (data not shown). Therefore, based on the facts that CTGF stimulates the proliferation and migration of stellate cells and promotes ECM production by stellate cells23 and that stellate cells have an intimate relationship with oval cells in the 2-AAF/PHx model,22 it is easy to postulate that inhibition of CTGF synthesis by Iloprost may affect stellate cell activation, which will, in turn, result in an impaired oval cell response. These effects of Iloprost will likely lead to prolonged liver regeneration after 2-AAF/ PHx.
In summary, we have identified CTGF as a gene that is differentially expressed in Thy-1+ oval cells during liver regeneration. Thy-1+ oval cells are 1 source of CTGF in this model. Iloprost can inhibit CTGF up-regulation during oval cell activation and proliferation in the 2-AAF/PHx model. Also, this inhibition was associated with a severely impaired oval cell response to 2-AAF/PHx. Taken together, these data indicate that CTGF plays an important role in oval cell proliferation during the liver regeneration phase of the 2-AAF/PHx model. However, much more work is needed to clearly elucidate how CTGF fits into the signaling pathway of oval cell activation and proliferation.
Acknowledgments
Supported by grants NIH DK58614 and NIH DK60015.
The authors thank Marda Jorgensen and Heather M. Hatch for technical advice pertaining to immunohistochemistry and Dr Naohiro Terada and Rafal Witek for manuscript preparation.
Abbreviations used in this paper
- 2-AAF
2-acetylaminofluorene
- AFP
α-fetoprotein
- CTGF
connective tissue growth factor
- DIG
digoxigenin
- ECM
extracellular matrix
- PBS
phosphate-buffered saline
- PHx
partial hepatectomy
- SSC
standard saline citrate
- SSH
suppression subtractive hybridization
- TGF-β1
transforming growth factor β1
Footnotes
BEP is an inventor of a patent(s) related to this technology and may benefit from royalties paid to the University of Florida related to its commercialization.
Publisher's Disclaimer: This is a PDF file of an unedited manuscript that has been accepted for publication. As a service to our customers we are providing this early version of the manuscript. The manuscript will undergo copyediting, typesetting, and review of the resulting proof before it is published in its final citable form. Please note that during the production process errors may be discovered which could affect the content, and all legal disclaimers that apply to the journal pertain.
References
- 1.Michalopoulos GK, DeFrances MC. Liver regeneration. Science. 1997;276:60– 66. doi: 10.1126/science.276.5309.60. [DOI] [PubMed] [Google Scholar]
- 2.Golding M, Sarraf CE, Lalani EN, Anilkumar TV, Edwards RJ, Nagy P, Thorgeirsson SS, Alison MR. Oval cell differentiation into hepatocytes in the acetylaminofluorene-treated regenerating rat liver. Hepatology. 1995;22:1243–1253. doi: 10.1016/0270-9139(95)90635-5. [DOI] [PubMed] [Google Scholar]
- 3.Evarts RP, Nagy P, Nakatsukasa H, Marsden E, Thorgeirsson SS. In vivo differentiation of rat liver oval cells into hepatocytes. Cancer Res. 1989;49:1541–1547. [PubMed] [Google Scholar]
- 4.Shiojiri N, Lemire JM, Fausto N. Cell lineages and oval cell progenitors in rat liver development. Cancer Res. 1991;51:2611–2620. [PubMed] [Google Scholar]
- 5.Petersen BE, Goff JP, Greenberger JS, Michalopoulos GK. Hepatic oval cells express the hematopoietic stem cell marker Thy-1 in the rat. Hepatology. 1998;27:433– 445. doi: 10.1002/hep.510270218. [DOI] [PubMed] [Google Scholar]
- 6.Bork P. The modular architecture of a new family of growth regulators related to connective tissue growth factor. FEBS Lett. 1993;327:125–130. doi: 10.1016/0014-5793(93)80155-n. [DOI] [PubMed] [Google Scholar]
- 7.Moussad EEDA, Brigstock DR. Connective tissue growth factor: What’s in a name? Mol Genet Metab. 2000;71:276–292. doi: 10.1006/mgme.2000.3059. [DOI] [PubMed] [Google Scholar]
- 8.Grotendorst GR, Okochi H, Hayashi N. A novel transforming growth factor beta response element controls the expression of the connective tissue growth factor gene. Cell Growth Differ. 1996;7:469– 480. [PubMed] [Google Scholar]
- 9.Holmes A, Abraham DJ, Sa S, Shiwen X, Black CM, Leask A. CTGF and SMADs, maintenance of scleroderma phenotype is independent of SMAD signaling. J Biol Chem. 2001;276:10594–10601. doi: 10.1074/jbc.M010149200. [DOI] [PubMed] [Google Scholar]
- 10.Rachfal AW, Brigstock DR. Connective tissue growth factor (CTGF/CCN2) in hepatic fibrosis. Hepatol Res. 2003;26:1–9. doi: 10.1016/s1386-6346(03)00115-3. [DOI] [PubMed] [Google Scholar]
- 11.Stratton R, Rajkumar V, Ponticos M, Nichols B, Shiwen X, Black CM, Abraham DJ, Leask A. Prostacyclin derivatives prevent the fibrotic response to TGF-beta by inhibiting the Ras/MEK/ERK pathway. FASEB J. 2002;16:1949–1951. doi: 10.1096/fj.02-0204fje. [DOI] [PubMed] [Google Scholar]
- 12.Stratton R, Shiwen X, Martini G, Holmes A, Leask A, Haberberger T, Martin GR, Black CM, Abraham D. Iloprost suppresses connective tissue growth factor production in fibroblasts and in the skin of scleroderma patients. J Clin Invest. 2001;108:241–250. doi: 10.1172/JCI12020. [DOI] [PMC free article] [PubMed] [Google Scholar]
- 13.Sedlaczek N, Jia JD, Bauer M, Herbst H, Ruehl M, Hahn EG, Schuppan D. Proliferating bile duct epithelial cells are a major source of connective tissue growth factor in rat biliary fibrosis. Am J Pathol. 2001;158:1239–1244. doi: 10.1016/S0002-9440(10)64074-6. [DOI] [PMC free article] [PubMed] [Google Scholar]
- 14.Paradis V, Perlemuter G, Bonvoust F, Dargere D, Parfait B, Vidaud M, Conti M, Huet S, Ba N, Buffet C, Bedossa P. High glucose and hyperinsulinemia stimulate connective tissue growth factor expression: a potential mechanism involved in progression to fibrosis in nonalcoholic steatohepatitis. Hepatology. 2001;34:738–744. doi: 10.1053/jhep.2001.28055. [DOI] [PubMed] [Google Scholar]
- 15.Paradis V, Dargere D, Vidaud M, De Gouville AC, Huet S, Martinez V, Gauthier JM, Ba N, Sobesky R, Ratziu V, Bedossa P. Expression of connective tissue growth factor in experimental rat and human liver fibrosis. Hepatology. 1999;30:968–976. doi: 10.1002/hep.510300425. [DOI] [PubMed] [Google Scholar]
- 16.Ujike K, Shinji T, Hirasaki S, Shiraha H, Nakamura M, Tsuji T, Koide N. Kinetics of expression of connective tissue growth factor gene during liver regeneration after partial hepatectomy and D-galactosamine-induced liver injury in rats. Biochem Biophys Res Commun. 2000;277:448– 454. doi: 10.1006/bbrc.2000.3693. [DOI] [PubMed] [Google Scholar]
- 17.Chen C, Michelini-Norris B, Stevens S, Rowsey J, Ren X, Goldstein M, Schultz G. Measurement of mRNAs for TGFs and extracellular matrix proteins in corneas of rats after PRK. Invest Ophthalmol Vis Sci. 2000;41:4108– 4116. [PubMed] [Google Scholar]
- 18.Fahimi HD. Perfusion and immersion fixation of rat liver with glutaraldehyde. Lab Invest. 1967;16:736–750. [PubMed] [Google Scholar]
- 19.Thorgeirsson SS. Hepatic stem cells in liver regeneration. FASEB J. 1996;10:1249–1256. [PubMed] [Google Scholar]
- 20.Igarashi A, Nashiro K, Kikuchi K, Sato S, Ihn H, Fujimoto M, Grotendorst GR, Takehara K. Connective tissue growth factor gene expression in tissue sections from localized scleroderma, keloid, and other fibrotic skin disorders. J Invest Dermatol. 1996;106:729–733. doi: 10.1111/1523-1747.ep12345771. [DOI] [PubMed] [Google Scholar]
- 21.Paradis V, Dargere D, Bonvoust F, Vidaud M, Segarini P, Bedossa P. Effects and regulation of connective tissue growth factor on hepatic stellate cells. Lab Invest. 2002;82:767–774. doi: 10.1097/01.lab.0000017365.18894.d3. [DOI] [PubMed] [Google Scholar]
- 22.Paku S, Schnur J, Nagy P, Thorgeirsson SS. Origin and structural evolution of the early proliferating oval cells in rat liver. Am J Pathol. 2001;158:1313–1323. doi: 10.1016/S0002-9440(10)64082-5. [DOI] [PMC free article] [PubMed] [Google Scholar]
- 23.Gao R, Brigstock DR. Connective tissue growth factor (CCN2) induces adhesion of rat activated hepatic stellate cells by binding of its C-terminal domain to integrin alpha(v)beta(3) and heparan sulfate proteoglycan. J Biol Chem. 2004;279:8848– 8855. doi: 10.1074/jbc.M313204200. [DOI] [PubMed] [Google Scholar]
- 24.Leask A, Abraham DJ. The role of connective tissue growth factor, a multifunctional matricellular protein, in fibroblast biology. Biochem Cell Biol. 2003;81:355–363. doi: 10.1139/o03-069. [DOI] [PubMed] [Google Scholar]
- 25.Grisham JW, Thorgeirsson SS. Liver stem cells. In: Potten CS, editor. Stem cells. London, England: Academic Press, Harcourt Brace & Company; 1997. pp. 233–282. [Google Scholar]