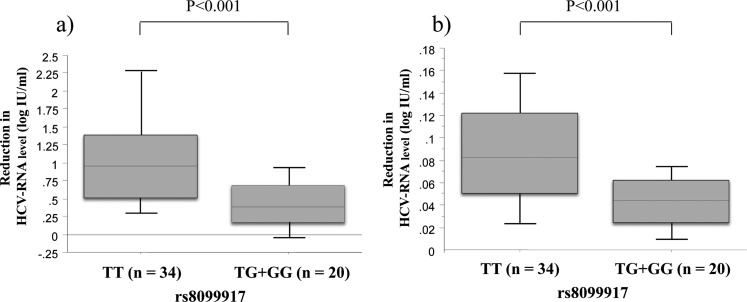
Figure 3.
(A) The first-phase viral decline slope per day (Ph1/day) and (B) second-phase viral decline slope per week (Ph2/week) in hepatitis C virus (HCV) genotype 1-infected patients treated with pegylated interferon α plus ribavirin. The lines across the boxes indicate the median values. The hash marks above and below the boxes indicate the 90th and 10th percentiles for each group, respectively.

