

Abstract
B-cell receptor signaling in response to membrane-bound antigen increases with antigen affinity, a process known as affinity discrimination. We use computational modeling to show that B-cell affinity discrimination requires that kinetic proofreading predominate over serial engagement. We find that if B-cell receptors become signaling-capable immediately upon antigen binding, which results in decreasing serial engagement as affinity increases, then increasing affinity can lead to weaker signaling. Rather, antigen must stay bound to B-cell receptors for a threshold time of several seconds before becoming signaling-capable, a process similar to kinetic proofreading. This process overcomes the loss in serial engagement due to increasing antigen affinity, and replicates the monotonic increase in B-cell signaling with increasing affinity that has been observed in B-cell activation experiments. This finding matches well with the experimentally observed time (∼20 s) required for the B-cell receptor signaling domains to undergo antigen and lipid raft-mediated conformational changes that lead to Src-family kinase recruitment. We hypothesize that the physical basis for a threshold time of antigen binding might lie in the formation timescale of B-cell receptor dimers. The time required for dimer formation decreases with increasing antigen affinity, thereby resulting in shorter threshold antigen binding times as affinity increases. Such an affinity-dependent kinetic proofreading requirement results in affinity discrimination very similar to that observed in biological experiments. B-cell affinity discrimination is critical to the process of affinity maturation and the production of high-affinity antibodies, and thus our results have important implications in applications such as vaccine design.
Keywords: computational modeling, Monte Carlo, lymphocyte signaling, Lyn, Syk
Introduction
The strength of B-cell receptor (BCR) signaling in response to stimulation by antigen (Ag) is known to increase monotonically with the affinity of the BCR for Ag, a phenomenon known as affinity discrimination.1, 2, 3, 4, 5, 6, 7, 8, 9 B-cell affinity discrimination is critical to the process of affinity maturation that results in the production of high-affinity antibodies,9 and thus has important implications in applications such as vaccine design.9 B-cell affinity discrimination has been observed starting from early membrane-proximal tyrosine phosphorylation events to late events such as lymphokine gene transcription.3 The precise mechanisms by which BCRs sense Ag affinity are still the subject of current investigations.10 The first studies of B-cell affinity discrimination focused on Ag encountered in soluble form, but recent research shows that Ag presented on the surface of Ag-presenting cells (APCs) are potent stimulators of B cells.4, 10, 11, 12, 13, 14, 15, 16, 17, 18, 19, 20, 21
Further studies show that during the initial stages of contact between B cells and APCs, microclusters of 10–100 BCR–Ag complexes have been observed to form on the B-cell surface.8, 9, 13, 22, 23 These microclusters are thought to be signaling-active,8, 9, 13, 22, 23 as they trigger affinity-dependent spreading of the B-cell surface over the APC surface, increasing the cell–cell contact area.8 This spreading response leads to further microcluster formation at the leading edges,8, 22 culminating in the formation of the immunological synapse.7, 8, 10, 12 It has also been shown that early signaling events (∼100 s) such as Ca2+ flux, as well as Ag accumulation in the immunological synapse, all increase with Ag affinity.8, 9 Affinity discrimination has thus been observed at the earliest stages of contact between BCRs and Ag.8, 9
However, very little is known about how B cells discriminate between membrane Ags of varying affinities at the level of BCR–Ag microclusters. In this work, we use an in silico computational model of BCR signaling to show that kinetic proofreading is the predominant mechanism by which BCRs discriminate membrane–Ag affinity. Originally proposed as a mechanism for how T cells discriminate between high- and low-affinity ligands,24 the idea behind kinetic proofreading is that a receptor needs to undergo a series of modifications induced by ligand binding in order to become signaling-capable.24, 25 However, the receptor quickly reverts to its unmodified state if the ligand detaches before the fully modified state is reached. This has the net effect of setting a threshold time that the ligand needs to be bound to a receptor before the receptor can become signaling-active.24, 25
Although it bears similarities to the T-cell receptor (TCR) signaling system, the BCR system also differs from it in significant ways. Thus, what holds true for the TCR system may not be assumed to hold true for the BCR system. First, the affinity range over which B cells recognize Ag (KA=106–1010 M−1),2, 7, 8 is much wider than that of T cells (KA=106–108 M−1).26 Some T-cell studies indicate that TCR signaling is a non-monotonic function of Ag affinity, starting from KA=106 M−1, reaching a peak at KA=107 M−1, and decreasing thereafter (typically reaching up to a maximum of KA=108 M−1).27, 28 Such non-monotonic behavior arises as a result of a competition between kinetic proofreading, which favors high-affinity Ags, and serial engagement of TCRs by MHC peptides, which is more prominent at low affinity (due to higher off-rate). Because bond lifetime generally increases with affinity, the frequency with which Ag (typically the limiting reagent) serially engages multiple receptors is reduced as affinity increases.27, 28, 29 Thus, if it were possible to extend such studies to affinity values above KA=108 M−1, the signaling response would continue to decrease with affinity. In contrast, the B-cell signaling response increases monotonically from KA=106 M−1 to KA=1010 M−1.2, 8 For very high-affinity Ags (KA>108 M−1), a typically7 very low dissociation rate (koff) makes it difficult for a single Ag fragment to serially engage multiple BCRs. Thus, it is far from obvious how B cells can generate a monotonically increasing signaling response up to affinity values of KA=1010 M−1 with typically limited Ag. Furthermore, BCR is a bivalent molecule, whereas TCR is monovalent, and BCR is expressed at much higher concentrations than TCR. This results in the BCR system having a much higher avidity than the TCR system. The question of how a B cell can discriminate between high-affinity Ags (e.g., 108 and 109 M−1) is thus non-trivial and cannot be explained by extrapolating what is known from TCR studies.
In this study, we investigated B-cell affinity discrimination by means of a computational model of BCR–Ag interactions and membrane-proximal signaling. Model parameters can be varied individually in a controlled manner in successive in silico experiments to identify their effect on the process of affinity discrimination. Such an approach can allow for the rapid, efficient testing of hypotheses of the mechanism of B-cell affinity discrimination, and can generate insight that complements that obtained from biological experiments.
We know that kinetic proofreading and serial engagement are generic contributing factors to receptor–ligand dynamics, but their relative contributions will depend on the details of the system. Here, we describe three findings. First, the kinetic proofreading requirement needs to be strong enough to overcome the competing effect of reduced serial engagement if B cells are to discriminate between Ag affinities as high as KA=108 M−1 and KA=109 M−1. Second, the kinetic proofreading requirement emerges from the timescale of BCR oligomer formation and is sufficient for B-cell affinity discrimination. Third, the timescale of the kinetic proofreading requirement estimated by our model matches with the experimentally observed timescale for BCR association with signaling molecules such as Lyn and Syk.9, 22, 23
Materials and methods
We use a Monte Carlo simulation method developed in our previous work,30, 31, 32 which we extended here from two to three dimensions so as to include membrane-proximal signaling events in addition to BCR–Ag binding. We modeled the B-cell signaling pathway as far the Src-family kinase Syk. The molecular species included in our model are BCR (and its Ig-α and Ig-β signaling subunits), Ag, and the kinases Lyn and Syk. Individual molecules are explicitly simulated as discrete agents diffusing on virtual cell surfaces and reacting with each other subject to probabilistic parameters that can be mapped to kinetic rate constants. Such an approach avoids making assumptions of continuity, particularly as the concentration of Ag (10–100 molecules/µm2)7 and/or BCR can be low. Moreover, an agent-based simulation method can capture crucially important effects such as competition among BCR moieties for limited Ag, as well as competition between Lyn and Syk for Ιg-α and Ig-β signaling subunits. Lastly, our method allows us to obtain the full probability distribution of the B-cell signaling response in the form of histograms, which may generate insight (such as the overlap between histograms) not readily available from mean-field models.
Simulation set-up
Because we are interested in the early stages of Ag recognition, we model a single protrusion on a B-cell surface, its cytoplasmic interior and its vertical projection onto a planar bilayer containing Ag. The bilayer and B-cell surface are modeled as lattices of 150×150 nodes, whereas the interior of the B-cell protrusion is modeled to a depth of 40 nodes. We assume that the protrusion surface facing the bilayer has a spherical curvature, such that the vertical separation distance (z) between the two surfaces is a minimum at the center and increases away from it.30, 31 Because we do not allow more than one molecule per node, the spacing between nodes is set to 10 nm,30, 31 which is roughly the exclusion radius of a protein molecule. BCR molecules are assumed to be somewhat larger than Ag, Lyn or Syk molecules; thus, a single BCR molecule occupies several nodes. We assume a zero net flux condition at the domain boundaries, which, in our simulations, is implemented by reflective boundary conditions. Zero net flux boundary conditions are based on the assumption that the 150×150 simulation domain (corresponding to a 1.5×1.5 µm area) is large enough to include the entire area where the vertical separation distance between the B-cell surface and the bilayer is small enough to allow receptor–ligand binding (for a spherical curvature). As we show in the Supplementary Information, the choice of boundary conditions does not materially affect affinity discrimination. BCR is located on the B-cell protrusion surface, Ag is located on the bilayer surface, Lyn is anchored below the B-cell protrusion surface and Syk is distributed in the B-cell protrusion's cytoplasm. At the start of a simulation run, all of these species are distributed uniformly at random over their respective domains. At each time step, individual molecules in the population are randomly sampled to undergo either diffusion or reaction, determined by means of an unbiased coin toss.
Reaction
Ag, Lyn and Syk are monovalent, whereas BCR molecules possess four binding sites: two extracellular Fab domains for Ag binding and one Ig-α and one Ig-β cytoplasmic domain, both of which serve as binding sites for Lyn and Syk. If an Ag molecule is selected for reaction, the node on the B-cell surface directly opposite the Ag's node is checked for a Fab domain, and if that is the case, a BCR–Ag complex may form with probability pon(BA). If the target BCR molecule happens to also have an Ag bound on the other Fab domain, a BCR/Ag2 complex will form. If a BCR molecule is selected to undergo reaction, an unbiased coin toss is performed to choose between the extracellular or cytoplasmic domains, and an additional unbiased coin toss is performed to choose one of the Fab domains (left or right), or either the Ig-α or Ig-β domain, depending on the result of the preceding coin toss. If a free Fab domain is selected, the node on the bilayer surface directly opposite is checked for an Ag, which may bind with probability pon(BA). If the selected Fab domain already has an Ag bound to it, the BCR/Ag bond may dissociate with probability poff(BA). Similarly, if either the Ig-α or Ig-β domain is selected for reaction, the node in the cytoplasm immediately below is checked for occupancy by Lyn or Syk, which may bind with probability pon(Lyn) or pon(Syk), respectively. If the selected cytoplasmic domain already has Lyn or Syk bound to it, the bond may dissociate with probability poff(Lyn) or poff(Syk), respectively. If Lyn or Syk is selected to undergo a reaction, the node immediately above is checked for occupancy by an Ig-α or Ig-β domain, and if that is the case, the Lyn or Syk may bind to the Ig-α or Ig-β with probability pon(Lyn) or pon(Syk).
There are a total of 30 possible reactions (all reversible) and 21 possible species: free BCR, free Ag, free Lyn, free Syk, BCR/Ag, BCR/Ag2, BCR/Lyn, BCR/Syk, BCR/Lyn/Lyn, BCR/Lyn/Syk, BCR/Syk/Syk, BCR/Ag/Lyn, BCR/Ag/Syk, BCR/Ag/Lyn/Lyn, BCR/Ag/Lyn/Syk, BCR/Ag/Syk/Syk, BCR/Ag2/Lyn, BCR/Ag2/Syk, BCR/Ag2/Lyn/Lyn, BCR/Ag2/Lyn/Syk and BCR/Ag2/Syk/Syk. For BCR–Ag binding, pon and poff vary with the local vertical separation between the B-cell surface and the bilayer, z, in accordance with the linear spring model,33, 34 as used in our previous work.30, 31, 32 The probability of binding pon is given by:
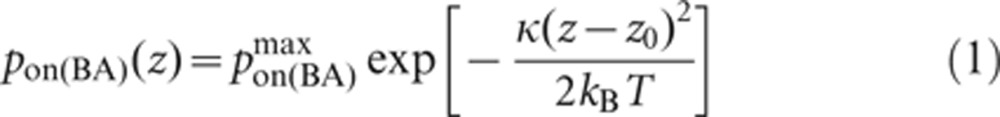 |
The bond is modeled as a mechanical spring with stiffness κ and equilibrium length z0 (set to 40 µN/m and 40 nm from previous work,30 respectively), and kB denotes the Boltzmann constant (1.34×10⁻²³ J/K) and T is the temperature (300 K). Similarly, the dissociation probability of a receptor–ligand complex, poff(i), is given by:
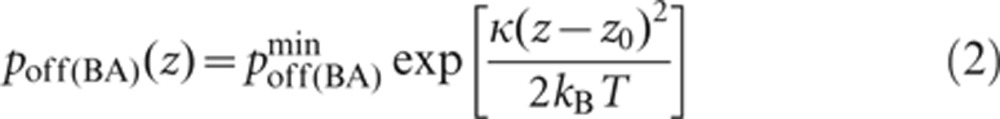 |
Since pon and poff are analogous to kon and koff, we can obtain the probabilistic analog to the association constant KA, denoted as PA, by dividing equation (2) by equation (3):
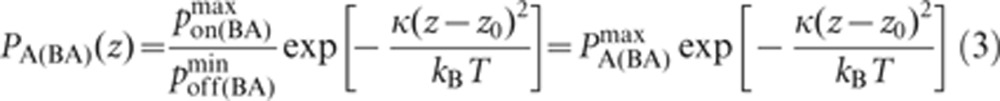 |
Thus, pon and PA are maxima at the center of the domain (where z=z0) and decrease as one moves away from the center, whereas poff is a minimum at the center and increases as one moves away from it. By contrast, the binding and unbinding probabilities for Lyn and Syk binding to Ig-α or Ig-β are spatially uniform.
We introduce a threshold Ag binding time, µ, such that Lyn can bind only to the Ig-α or Ig-β subunits of a BCR molecule that has bound the same Ag molecule for a length of time µ. If the Ag molecule detaches before time µ is reached, the BCR molecule reverts to its basal state. Once a BCR has bound Ag for time µ, however, the BCR remains signaling-capable for the duration of the simulation, even if the Ag subsequently detaches. Because at this stage we model only the first 1–2 min of B-cell activation, such an assumption does not conflict with subsequent internalization of the BCR.35 The length of the threshold time µ is varied in our simulations. We perform simulations where µ is a constant with respect to BCR–Ag affinity values, and simulations where the value of µ is a function of affinity KA.
Lyn that is attached to either Ig-α or Ig-β may phosphorylate the Ig-α and Ig-β with probability pphos(Igα) and pphos(Igβ), respectively. Two random-number trials—one with probability pphos(Igα) and the other with probability pphos(Igβ)—are conducted every time an Ig-α or Ig-β subunit with Lyn attached to it is selected to undergo a reaction (i.e., prior to a dissociation trial). Syk can bind only to Ig-α or Ig-β that have been phosphorylated, but is not subject to the threshold time requirement. A Syk molecule that is attached to phosphorylated Ig-α or Ig-β may in turn become phosphorylated with probability pphos(Syk). The phosphorylation trial is carried out every time an Ig-α or Ig-β with an attached Syk molecule is selected for dissociation. A schematic of our simplified model of membrane-proximal B-cell signaling is shown in Figure 1.
Figure 1.
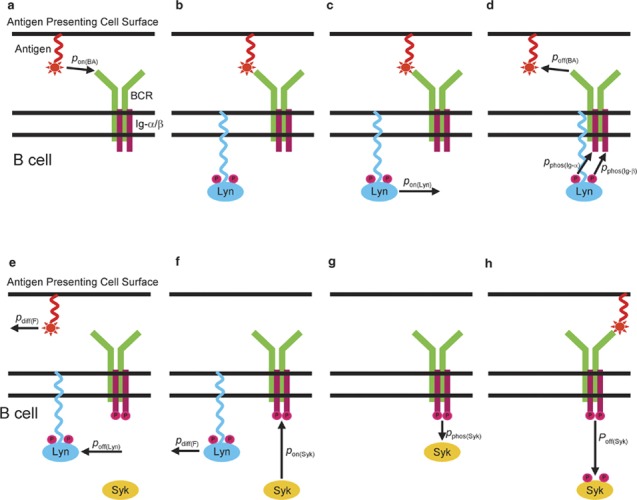
Schematic of the simplified B-cell receptor (BCR) signaling pathway simulated in our Monte Carlo method. Antigen may bind to BCR with probability pon(BA) (a). If the same antigen molecule has stayed bound to the BCR for a threshold length of time µ (b), Lyn may bind to either the Ig-α or Ig-β subunit with probability pon(Lyn) (c) and phosphorylate both with probability pphos(Ig-α) and pphos(Ig-β), respectively (d). Once the Ig-α or Ig-β subunits are phosphorylated (e), Syk may bind to them with probability pon(Syk) (f) and become phosphorylated with probability pphos(Syk) (g). Syk may detach with probability poff(Syk) (h) regardless of the outcome of the phosphorylation trial. Subsequent antigen binding may occur, but without any consequences as far as the phosphorylation of the Ig-α or Ig-β subunits is concerned (h).
Diffusion
If a molecule has been selected to undergo diffusion, a random-number trial with probability pdiff(i) is used to determine whether the diffusion move will occur. The diffusion probability pdiff is directly analogous to the diffusion coefficient D. The probability of diffusion of free molecules is denoted by pdiff(F), and that of BCR–Ag complexes and signalosomes by pdiff(C). If the trial with probability pdiff(i) is successful, a neighboring node is selected at random (four possibilities for BCR, Ag and Lyn, six possibilities for Syk) and the target node is checked for occupancy. The move will occur only if the target node is vacant, as no two molecules are allowed to occupy the same node. BCR molecules, BCR–Ag complexes and BCR signalosomes are generally assumed to be much larger than Ag, Lyn and Syk molecules and occupy several nodes; thus, in these instances, there will be several target nodes that need to be vacant for the move to occur. BCR–Ag complexes and BCR signalosomes are generally assumed to diffuse slower than free molecules;22 hence, pdiff(C) is an order of magnitude lower than pdiff(F). Since free receptor and ligand molecules are the fastest diffusing species, we set pdiff(F)=1 and pdiff(C)=0.1.
Sampling and time step size
In our algorithm, the entire molecular population is randomly sampled M times for diffusion or reaction during every time step. Whether a diffusion or reaction trial will occur is determined by means of an unbiased coin toss, so that the overall sampling probability for diffusion is 0.5pdiff, and that for reaction 0.5pon (or 0.5poff). The number of trials M is set equal to the total number of molecules (free plus complex) present in the system at the beginning of each time step, and the simulation is run for a number of time steps T.
A distinguishing feature of our method is a mapping between the probabilistic parameters of the Monte Carlo simulation and their physical counterparts. We do this by setting pdiff of the fastest diffusing species, in this case, free molecules (pdiff(F)), equal to 1 and matching that quantity to the species' measured diffusion coefficient D. The diffusion coefficient of free molecules on a cell membrane has been experimentally measured to be of the order of 0.1 µm2/s.36 In one time step, a molecule with pdiff=1 will on average (since each molecule is on average sampled once per time step) have covered a distance of one nodal spacing, or 10 nm, giving a mean square displacement <r2> of 10−4 µm2. Using <r2>=Dt, this results in a time step size of 10−3 s. Once the time step size is known, it is possible to map pon, poff, and their ratio PA to their respective physical counterparts, kon, koff and KA. A detailed description of the mapping process can be found in our previous work.30 This type of mapping makes it possible to compare our model's results to those of physical experiments to within an order of magnitude, without a priori setting of the simulation timescale.
Model parameters
The key parameters used in our model are listed in Table 1. Parameter values found in the literature are given on the left side of Table 1, and the appropriately mapped forms used in our model are listed on the right side of Table 1. Parameters whose values vary during experiments (such as BCR–Ag affinity and Ag concentration) are also varied in our simulations. We vary BCR–Ag affinity by an order of magnitude across the physiological range for B cells (KA=105–1010 M−1). BCR–Ag affinity is varied as in B-cell activation experiments, by keeping kon constant and varying koff.7, 8 For example, in Carrasco et al.,7 affinity for the HEL series of Ag is varied by varying koff across five orders of magnitude, whereas kon is fixed at 2×10⁶ M−1 s−1. The literature value of 105 receptors/cell33 maps to 400 molecules for the 1.5×1.5 µm domain used in our simulations, and the Ag concentration of 10–100 molecules/µm2 used in experiments7 approximately maps to 20–200 Ags. In the results shown here, we used 200 Ag molecules, and results with 20 and 2000 Ag molecules are included in the Supplementary Information.
Table 1. Experimentally measured parameter values found in the literature and the mapped probabilistic counterparts used in our simulations.
| Experimental parameter | Measured or estimated value | Simulation parameter | Mapped value |
|---|---|---|---|
| KA BCR–antigen | 106–1010 M−1b 7, 8 | PA(BA) | 102–106 |
| kon BCR–antigen | 106 M−1 s−1 7, 8 | pon(BA) | 0.1 |
| koff BCR–antigen | 1–10−4 s−1b7, 8 | poff(BA) | 10−3–10−7 |
| BCR molecules/cell | ∼105 33 | B0 | 400 molecules |
| Antigen concentration | 10–100 molecules/µm2b7 | A0 | 20–200 moleculesc |
| KA Ig-α/β–Lyn | 106 M−1a,b | PA(Lyn) | 102 |
| kon Ig-α/β–Lyn | ∼107 M−1 s−1a,b | pon(Lyn) | 1.0 |
| koff Ig-α/β–Lyn | ∼10 s−1a,b | poff(Lyn) | 0.01 |
| KA Ig-α/β–Syk | 106 M−1 39 | PA(Syk) | 102 |
| kon Ig-α/β–Syk | ∼107 M−1 s−1a,b | pon(Syk) | 1.0 |
| koff Ig-α/β–Syk | ∼10 s−1a,b | poff(Syk) | 0.01 |
| Lyn molecules/cell | 2×10⁴a,b | L0 | 100 |
| Syk molecules/cell | 4×10⁵a,b | S0 | 400 |
| kphos(Igα) | ∼100 s−1a,b | pphos(Igα) | 0.1 |
| kphos(Igβ) | ∼100 s−1a,b | pphos(Igβ) | 0.1 |
| kphos(Syk) | ∼100 s−1a,b | pphos(Syk) | 0.1 |
| Dfree molecules | 0.1 µm2/s 36 | pdiff(F) | 1.0 |
| Dcomplexes | ∼0.01 µm2/s 22 | pdiff(C) | 0.1 |
Abbreviation: BCR, B-cell receptor.
Represents a ballpark value calculated from Refs. 37 and 38.
Parametric study performed.
A0=200 molecules is used in all simulations reported in the main text.
We also vary the values of parameters for which we were not able to find measured values in the literature, such as the number of Lyn and Syk molecules (L0 and S0), and the on and off probabilities of cytoplasmic reactions such as pon(Lyn), poff(Lyn), pon(Syk), poff(Syk), pphos(Igα), pphos(Igβ) and pphos(Syk). For the purposes of obtaining ballpark values for these parameters, we have adapted the values used in modeling studies of FcεRI-mediated signaling, which bears many similarities to BCR-mediated signaling.37, 38 We have been able to find values for the KA of Syk binding to Ig-α or Ig-β,39 and hence, the ratio pon(Syk)/poff(Syk) is kept fixed in our simulations. Parametric studies conducted to gauge the effect of parameters, whose measured values we were not able to find in the literature, are included as Supplementary Information.
Results
Histogram plots of the number of bound Ags show affinity discrimination as koff decreases
We investigate affinity discrimination by tabulating the number of bound Ag molecules, the number of signaling-active BCRs (i.e., with one or more phosphorylated immunoreceptor tyrosine-based activation motifs (ITAMs), denoted as pBCR), and the number of activated (phosphorylated) Syk molecules (denoted as aSyk) at the end of a simulation run of 100 physical seconds (i.e., 105 time steps). BCR–Ag affinity is varied by orders of magnitude across the physiological range, from KA=105 M−1 to KA=1010 M−1, as is done in B-cell affinity discrimination experiments.7, 8 Because our simulation is stochastic in nature, the number of bound Ag, pBCR and aSyk molecules will vary from one simulation run to another. Each run of our simulation can be thought of as a single in silico virtual experiment involving a single B-cell protrusion. Thus, we performed 1000 independent trials for each affinity value and plotted the results in histograms. In Figure 2, we plot the number of bound Ag molecules as BCR–Ag affinity increases. In line with experimental results,8 the number of bound Ag molecules increases with BCR–Ag affinity.
Figure 2.
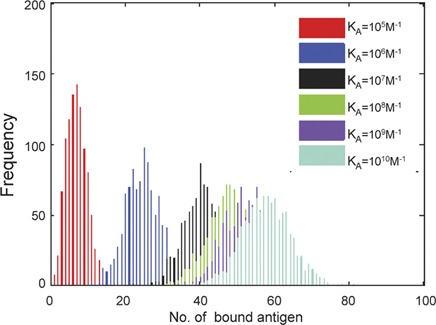
Histogram of the number of bound antigen molecules. B-cell receptor (BCR)–antigen binding affinity is varied by orders of magnitude across the physiological range in B cells, from KA=105 M−1 to KA=1010 M−1. Because of the probabilistic nature of our simulation, 1000 trials were performed for each affinity value. The parameter values used are those listed in the right-hand side column of Table 1, and simulation time is 105 time steps (corresponding to T=100 physical seconds). The number of bound antigens generally increases with affinity, as expected.
Histogram plots show affinity discrimination requires a threshold time of Ag binding
In Figure 3, we plot histograms of the number of pBCR (Figure 3a–c) and aSyk (Figure 3d–f) molecules for threshold time values of µ=0, 1, and 10 s. In the case of pBCR, we found that a threshold time of µ=0 (Figure 3a), i.e., when BCR becomes signaling-capable immediately upon binding Ag, yields histogram plots that move in the decreasing direction as affinity increases, indicating weaker signaling with increasing affinity. This is exactly the opposite of what B-cell affinity discrimination experiments show,8 suggesting the necessity of an additional mechanism for affinity discrimination. With a threshold time of µ=1 s (Figure 3b), the pBCR histograms are fully overlapping, with the exception of the histogram for the lowest BCR–Ag affinity value, KA=105 M−1, which is apart from the others. Thus, it is only possible to distinguish between this affinity value and the rest. This result shows that a threshold time of µ=1 s is insufficient to produce the experimentally observed affinity discrimination pattern of B cells, except between the two lowest affinity values, KA=105 M−1 and KA=106 M−1.
Figure 3.
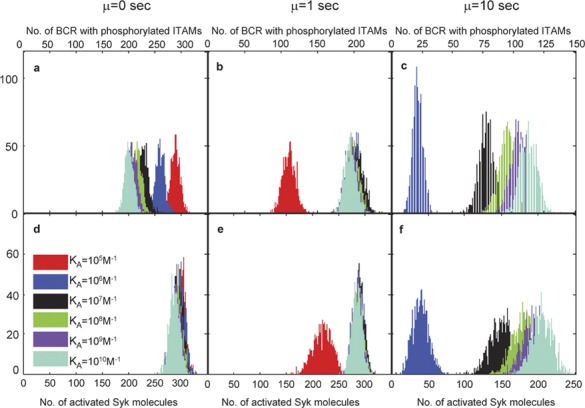
Histogram plots for the number of B-cell receptors (BCRs) with phosphorylated immunoreceptor tyrosine-based activation motifs (ITAMs) (a–c) and activated Syk molecules (d–f). BCRs with phosphorylated ITAMs (denoted as pBCR) are shown in a–c, and activated Syk molecules (denoted as aSyk) are shown in d–f. Results for threshold time µ=0 s are shown in a and d, for threshold time µ=1 s in b and e, and for threshold time µ=10 s in c and f. One thousand independent trials are performed for each affinity value. These results are taken after T=105 time steps (equal to 100 physical seconds), with the parameter values listed in the right-hand side column of Table 1. It is only possible to clearly distinguish between affinity values with threshold time µ=10 s.
By contrast, when the threshold time is set to µ=10 s (Figure 3c), the histograms are well separated and show a monotonic increase with affinity. In this instance, it is possible to easily distinguish between all but the two highest affinity values, KA=109 M−1 and KA=1010 M−1, whereas the number of pBCR is zero for every trial for BCR–Ag affinity KA=105 M−1. Increasing the threshold time to µ=20 s shifts the histograms one order of magnitude to the left, i.e., the number of pBCR and aSyk is zero for KA=106 M−1, and the histogram for KA=107 M−1 is centered where the histogram for KA=106 M−1 was centered for µ=10 s. This makes it no longer possible to distinguish between affinity values at the low end of the spectrum (KA=105 M−1 and KA=106 M−1) and sets the threshold of B-cell activation to KA=107 M−1, in contradiction to the B-cell activation threshold of KA=106 M−1 seen in B-cell activation experiments.2, 4, 7, 8 Thus, at the level of phosphorylated BCR, only a threshold time of ∼10 s reproduces the affinity discrimination pattern seen in B-cell experiments. This finding correlates well (within the same order of magnitude) with recent FRET experiments that show that the Ig-α/-β signaling subdomains undergo conformational changes that allow interaction with Syk approximately 20 s after the initiation of Ag binding.9, 22, 23, 40
Regarding activated Syk molecules, the histograms overlap and it is impossible to distinguish affinity values when the threshold time is µ=0 (Figure 3d). When the threshold time is set to µ=1 s (Figure 3e), it is only possible to distinguish between KA=105 M−1 and higher affinity values. However, a threshold time of µ=10 s (Figure 3f) results in a simulation where the number of aSyk molecules increases with affinity and it is possible to easily distinguish between all but the two highest affinity values. As with pBCR, a threshold time of µ=20 s contradicts the experimentally determined B-cell activation threshold affinity of KA=106 M−1. Thus, our model predicts that only a threshold time of µ=10 s can reproduce the experimentally observed affinity discrimination at the level of activated Syk molecules as well.
Of note is that for µ=10 s, the number of pBCR and aSyk molecules is zero for the lowest affinity value, KA=105 M−1. This replicates the threshold of B-cell activation of KA=106 M−1 seen in experiments.2, 4, 7, 8 Also of note is the difficulty in differentiating between the two highest affinity values, KA=109 M−1 and KA=1010 M−1. Indeed, this has also been observed in B-cell activation experiments,8 and indicates the existence of a ceiling in B-cell affinity maturation around KA=1010 M−1.2, 4, 7 The results for µ=10 s are thus broadly in agreement with experimental investigations of B-cell activation. Moreover, in contrast to the results for bound Ag (Figure 2), the standard deviation of the histograms shown in Figure 3 is less dependent on BCR–Ag affinity, as the kinetics of Lyn and Syk and the phosphorylation rates are not functions of BCR–Ag affinity. In the Supplementary Information section, we show that the above results hold even if the receptor modification due to Ag binding is not irreversible (i.e., the receptor loses its capacity to bind Lyn if the Ag detaches, even if it has previously fulfilled the threshold time requirement).
Trial-averaged quantities also show that affinity discrimination requires a threshold time of Ag binding
In addition to histograms of the number of bound Ag, pBCR and aSyk molecules, we also plot the trial-averaged value (mean) of these quantities in Figure 4. Trial-averaged quantities are important as they can be thought of as analogous to the signaling response integrated from multiple protrusions on a single cell. As shown in Figure 4a, the trial-averaged number of bound Ag increases monotonically with affinity and does not vary with the threshold time µ, as the threshold time affects only events downstream of Ag binding.
Figure 4.
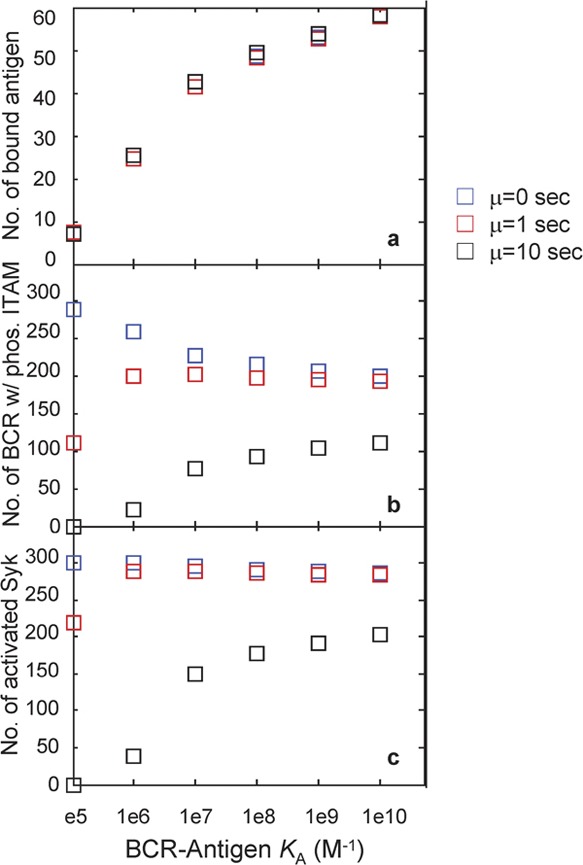
Plot of the mean number of bound antigens (a), pBCR (b) and aSyk molecules (c) for the histograms of Figures 2 and 3. Results for threshold time µ=0 are shown as blue squares, for µ=1 s as red squares and for µ=10 s as black squares. Where histograms are plotted in Figure 3, the mean value of each of these histograms is shown here. The number of bound antigens shows no variation with threshold time, in contrast to the number of pBCR and aSyk. A monotonic increase in signaling strength with affinity is observed only with threshold time µ=10 s. BCR, B-cell receptor; ITAM, immunoreceptor tyrosine-based activation motifs.
The number of pBCR, by contrast, is highly dependent on threshold time. In Figure 4b, we observe that with a threshold time of µ=0, the trial-averaged number of pBCR decreases monotonically with increasing affinity. This is because in our simulations, as in experiments,7affinity is increased by decreasing the dissociation probability poff (analogous to the dissociation rate koff). Thus, higher affinity means lower poff and a longer bond lifetime. Long-lived bonds result in fewer encounters between BCR and Ag molecules, as a greater fraction of high-affinity Ags stay bound to the same BCR molecule for a longer time. Because Ag is the limiting reagent, many BCR molecules never encounter Ag when affinity is high. However, short-lived bonds result in a rapid succession of binding and unbinding events between the BCR and Ag, ensuring that most BCR molecules encounter Ag at some point during the simulation. This effect, dubbed ‘serial engagement' or ‘serial triggering',28, 41, 42 is entirely dominant in the absence of kinetic proofreading (µ=0), and the decrease in serial engagement is the reason for the observed decrease in the number of signaling-capable BCRs with increasing affinity in Figure 4b.
By contrast, when the threshold time is set to µ=10 s (Figure 4b), the number of pBCR increases monotonically with affinity. This demonstrates that kinetic proofreading is dominant over serial engagement at this threshold time value. As Lyn can phosphorylate only BCR molecules that have bound the same Ag molecule for 10 s or longer, few short-lived, low-affinity bonds satisfy this criterion. By contrast, many more long-lived, high-affinity bonds do remain bound for 10 s or longer. This leads to an increase in the number of phosphorylation events as affinity increases, and hence, in the number of pBCR and aSyk molecules. When the threshold time is set to µ=1 s, the number of pBCR varies non-monotonically with increasing affinity, indicating competition between serial engagement and kinetic proofreading. Kinetic proofreading appears dominant at the lower end of the affinity range, with serial engagement dominant at the higher end, and signaling strength reaching its peak at mid-range affinity values. Such a balance between kinetic proofreading and serial triggering leads to the non-monotonic signaling activation seen in T cells,27, 28, 29 but is not observed in B-cell activation experiments.
The pattern in the number of Syk molecules (Figure 4c) follows that of pBCR for all threshold time values, which is expected because Syk activation occurs downstream of BCR ITAM phosphorylation. Taken together, results from this model indicate that B-cell affinity discrimination requires a kinetic proofreading-type mechanism involving a threshold time on the order of 10 s. This appears to be the optimal value for which kinetic proofreading can overcome the decrease in serial engagement with increasing affinity to produce monotonically increasing signaling with increasing affinity, while satisfying the experimentally observed B-cell activation threshold of KA=106 M−1.
It is important to note that the results of Figures 3 and 4 are robust with respect to those parameter values that either vary in biological experiments (such as Ag concentration), or those for which we were not able to find precise values in the literature (such as Lyn and Syk kinetics and phosphorylation rates). This is shown in detail in the Supplementary Information.
Time course of signaling activation
In Figure 5, we plot the number of pBCR and aSyk as functions of time for each order of magnitude in affinity between KA=105 M−1 and KA=1010 M−1. The threshold time µ=0 is shown in the top row (Figure 5a and d), µ=1 s in the middle row (Figure 6b and e) and µ=10 s in the bottom row (Figure 5c and f). The strength of signaling increases with time for all three threshold time values. However, only when the threshold time is set to µ=10 s does the strength of signal increase faster for high affinity, as is the case in biological experiments.8, 9 For threshold time µ=0, the decrease in pBCR and aSyk with increasing affinity seen in Figure 3a and d is readily observable for all times. For threshold time µ=1 s, it is only possible to distinguish KA=105 M−1 from any of the other affinities tested at all times. For threshold time µ=10 s, the increase in pBCR with increasing affinity is observable at all times, and it is possible to distinguish among affinity values, as in Figure 3c and f. The number of pBCR is zero at all times for KA=105 M−1 when the threshold time is set to µ=10 s.
Figure 5.
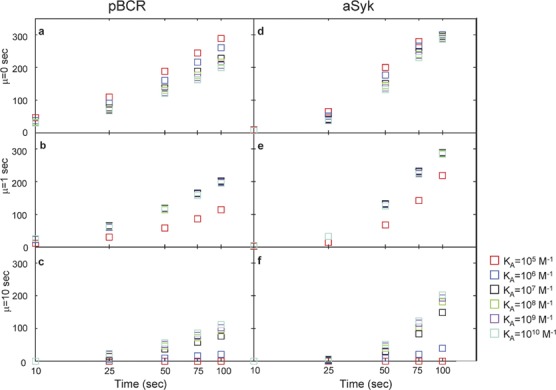
Plot of the mean number of pBCR (a–c) and aSyk (d–f) as a function of time. These results are for threshold time values µ=0 s (a and d), µ=1 s (b and e) and µ=10 s (c and f). The data points for T=100 s correspond to the data points in Figure 4. BCR, B-cell receptor.
Figure 6.
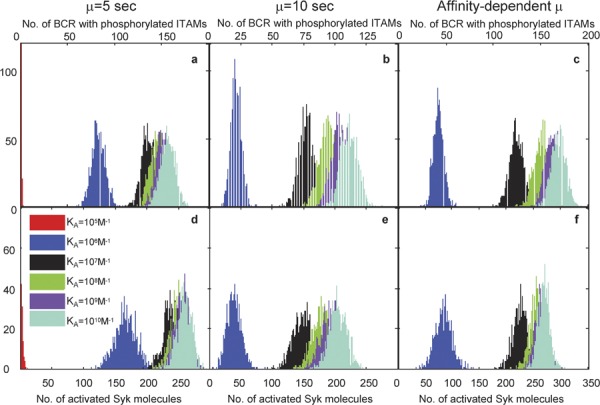
Comparison in affinity discrimination between constant threshold time and variable threshold time. BCRs with phosphorylated ITAMs (pBCR) are shown in a–c, and activated Syk molecules (aSyk) are shown in d–f. Results for constant threshold time µ=5 s are shown in a and d, for constant threshold time µ=10 s in b and e, and results for the threshold times given in Table 2 are shown in c and f. One thousand independent trials are performed for each affinity value. These results are taken after T=105 time steps (equal to 100 physical seconds), with the remaining parameters values listed in the right-hand side column of Table 1. BCR, B-cell receptor; ITAM, immunoreceptor tyrosine-based activation motif.
Affinity-dependent threshold time
Recent experimental studies indicate that BCR molecules become signaling-capable through a conformational change in their cµ-4 domain mediated by BCR binding to membrane Ag, followed by the subsequent formation of BCR oligomers.9, 43, 44 Following Ag ligation, the cµ-4 domain is believed to change to an ‘open' conformation, which enables the formation of BCR oligomers. It is reasonable to assume that the generation of BCR oligomers is part of BCR–lipid raft microcluster formation that occurs early in the process of Ag recognition, and that the formation of BCR–lipid clusters leads to the recruitment of the Src family kinase Lyn that can phosphorylate BCR molecules in the microclusters.22, 44 Such a sequential process of BCR phosphorylation can be studied using a simplified model where BCR molecules stay bound to Ag for a finite threshold time before they become phosphorylated by Lyn. This effective kinetic proofreading time, needed for BCRs to stay bound to Ags for signaling capability, can be estimated from the timescale of BCR oligomer formation (i.e., a sufficient number of oligomers for Lyn recruitment). Such an oligomerization-dependent threshold time will, in general, depend on affinity and we estimate threshold time to thosefrom a separate set of Monte Carlo simulations. Thus, we do not alter the original BCR/Syk phosphorylation simulation scheme, which allows us to compare our results for the affinity dependent threshold time from previous simulations with constant threshold time.
We use our Monte Carlo simulation method to estimate the timescale of BCR dimer formation (as a simplified model of oligomer formation) for each affinity value, and then use the timescale obtained in this fashion as the threshold time for BCR to become capable of binding Lyn. We use the same parameter values that are used for our simulations of BCR/Syk phosphorylation (Table 1). In the dimerization simulation, when two BCR–Ag complexes occupy neighboring nodes, they form a dimer. We calculate the threshold time as the time (averaged over 100 trials) by which the average number of dimers reaches 0.5. The reason for choosing such a low dimerization cutoff is twofold: (i) dimerization is a relatively slow process in our simulations as we do not have lipid-mediated effects in our simulations; and (ii) the estimated timescale is on the order ∼10 s. The dimerization timescale decreases with increasing affinity in a nonlinear manner, as shown in Table 2. This provides a physical basis for the kinetic proofreading requirement, allowing it to emerge from our model's properties instead of being an abstraction.
Table 2. Threshold times predicted by our dimerization simulation.
| BCR–Ag KA (M−1) | Threshold time µ (s) |
|---|---|
| 105 | 18.7 |
| 106 | 7.6 |
| 107 | 5.8 |
| 108 | 4.6 |
| 109 | 4.1 |
| 1010 | 3.8 |
Abbreviation: Ag, antigen; BCR, B-cell receptor.
In Figure 6, we plot histograms of the number of pBCR (Figure 6c) and aSyk molecules (Figure 6f) using the times in Table 2 as the value of the threshold time µ for each affinity value. For comparison, the results for constant threshold time µ=10 s (identical to Figure 3c and f) are shown in Figure 6b and e (pBCR and aSyk, respectively). Results for constant threshold time µ=5 s are shown in Figure 6a and d (pBCR and aSyk, respectively). Comparing Figure 6b with Figure 6c, we see that for pBCR, affinity resolution is improved for affinity-dependent threshold times (Figure 6c) compared to constant threshold time µ=10 s (Figure 6b), especially between KA=107 M−1 and KA=108 M−1 (black and green histograms, respectively). This enhanced resolution is due to the fact that for affinity-dependent threshold times, the strength of the kinetic proofreading requirement decreases as affinity increases, thereby resulting in even more BCRs that successfully fulfill the kinetic proofreading requirement. For aSyk, there is not much difference in affinity discrimination between affinity dependent and constant threshold time µ=10 s (compare Figure 6e and f). Affinity discrimination for both affinity dependent threshold times and constant threshold time µ=10 s is much better than for constant threshold time µ=5 s.
In Figure 7, we plot the mean values of each of the histograms. The plots of the mean values of the pBCR histograms are shown in Figure 7a, and the plots for the mean values of aSyk are shown in Figure 7b. The mean values for constant threshold time µ=5 s are shown in blue, those for constant threshold time µ=10 s in red and those for affinity-dependent threshold time (Table 2) in black. The overall affinity discrimination pattern is similar for affinity-dependent and constant µ=10 s threshold time: a rapid increase in the mean number of pBCR and aSyk as affinity increases at the lower range of affinity, followed by a leveling off at high-affinity values. For constant threshold time µ=5 s, the mean number of pBCR and aSyk levels off much more sharply after KA=107 M−1, making it difficult to distinguish between affinity values. For constant threshold time µ=10 s and affinity-dependent threshold time, the mean number of pBCR and a Syk for low affinity (KA=105 M−1) is zero, although not for constant threshold time µ=5 s. For affinity-dependent threshold time, this is due to the threshold time of 18.7 s for KA=105 M−1. Lack of dimerization at low affinity could be the reason why nonspecific Ags fail to generate a B-cell response.
Figure 7.
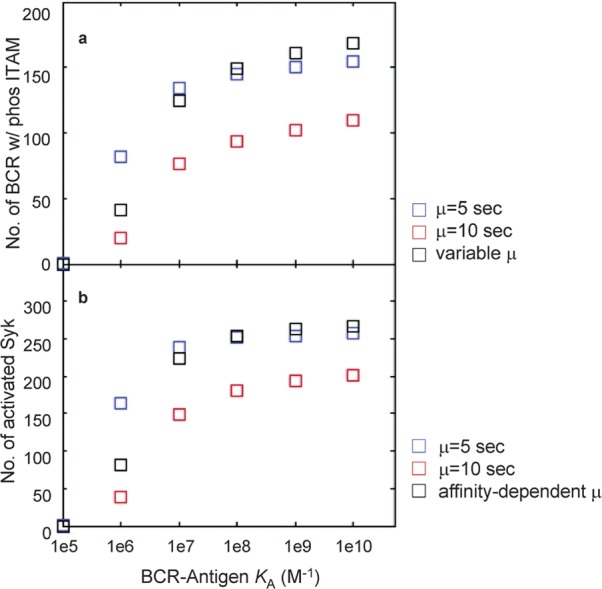
Plot of the mean number of pBCR (a) and aSyk (b) for the histograms of Figure 6. The results for constant threshold time µ=5 s are shown in blue, constant threshold time µ=10 s in red and variable threshold time with µ taken from Table 2 in black. Where histograms are plotted in Figure 6, the mean value of each of these histograms is shown here. BCR, B-cell receptor.
In Figure 8, we plot the mean number of pBCR (Figure 8a–c) and aSyk (Figure 8d–f) as functions of time for constant threshold time µ=5 s (Figure 8a and d), constant threshold time µ=10 s (Figure 8b and e) and affinity-dependent threshold time (Figure 8c and f). The increase in the mean number of pBCR and aSyk is much more rapid for the case of affinity-dependent threshold time and threshold time µ=5 s compared to threshold time µ=10 s. For high affinity, the mean value of pBCR and aSyk is comparable between affinity-dependent threshold time and threshold time µ=5 s. However, the separation between the mean values for affinity-dependent threshold time is much better than for threshold time µ=5 s.8
Figure 8.
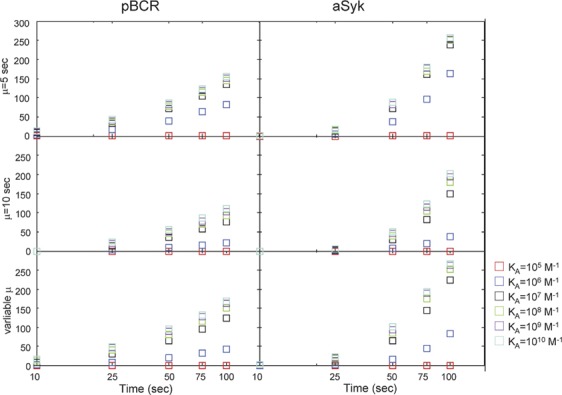
Plot of the mean number pBCR (a–c) and aSyk (d–f) as a function of time. These results are for constant threshold time µ=5 s (a and d), µ=10 s (b and e) and variable threshold time with µ taken from Table 2 (c and f). The data points for T=100 s correspond to the data points in Figure 7. BCR, B-cell receptor.
To quantify affinity discrimination obtained from the histograms, we use the quantitative metric Δ=(overlap area)/(m1–m2), where the area of overlap between the histograms for two adjacent affinity values (e.g., KA=107 M−1 and KA=108 M−1) is divided by m1 and m2, the histograms' mean values. Lower Δ values corresponds to better affinity discrimination, with the best discrimination occurring at Δ=0 (no overlap between histograms). When Δ=0, a further comparison of the difference between mean values is required (Figure 7). In Figure 9, we plot Δ for the number of pBCR from Figure 6a–c (i.e., µ=5 s, µ=10 s and affinity-dependent threshold time, shown in Figure 9a), and δ for the number of activated Syk from Figure 6d–f (i.e., µ=5 s, µ=10 s and affinity threshold time, shown in Figure 9b). In all cases, Δ increases as higher affinity values are compared. For pBCR, the best affinity discrimination generally occurs with affinity-dependent threshold time (except between the two highest values, KA=109 M−1 and KA=1010 M−1), whereas affinity discrimination is poor when the constant threshold time is set to µ=5 s. For aSyk, affinity discrimination is best with µ=10 s at the high end of the affinity range (KA≥108 M−1, as can be seen from Figure 9b), but better with affinity-dependent threshold time at the lower end of the affinity range (KA≤107 M−1, as can be seen from Figure 9b). For the comparison between KA≥107 M−1 and KA≥108 M−1, affinity discrimination is about the same between constant threshold time µ=10 s and affinity-dependent threshold time.
Figure 9.
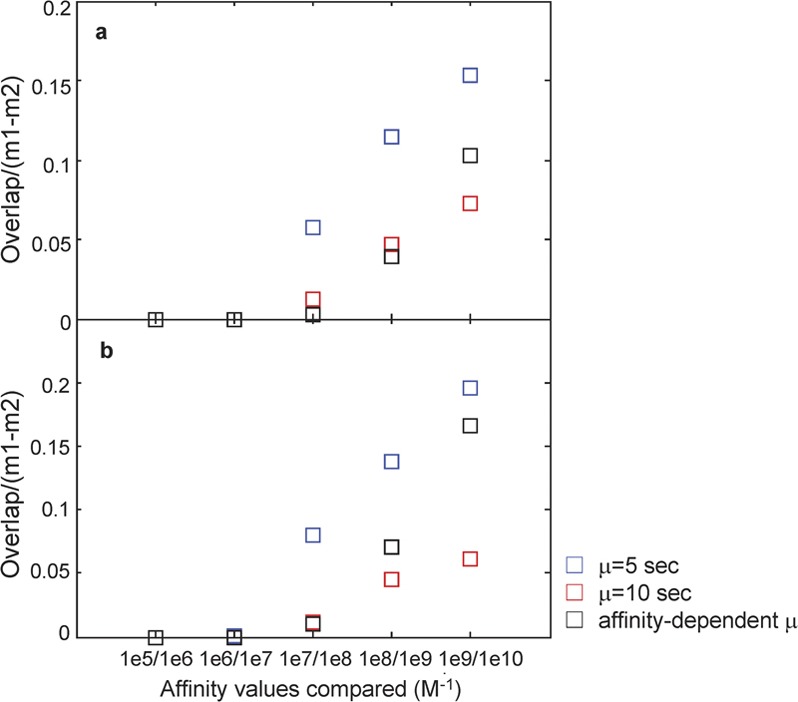
Quantitative comparison of affinity discrimination between adjacent affinity values. Plots of the quantity Δ=(overlap area)/(m1–m2), where the area of overlap between the histograms for two adjacent affinity values (e.g., KA=107 M−1 and KA=108 M−1) is divided by m1 and m2, the histograms' mean values. In a, we plot ▵ for the number of pBCR from Figure 6a–c (i.e., µ=5 s, µ=10 s and affinity-dependent threshold time), and in b, we plot ▵ for the number of aSyk from Figure 6d–f (i.e., µ=5 s, µ=10 s and affinity threshold time). Results of the constant threshold time µ=5 s are shown in blue, constant threshold time µ=10 s in red and variable threshold time with µ taken from Table 2 in black. A lower value of Δ corresponds to better affinity discrimination. For the case of Δ=0 one needs to compare the difference between mean values (Fig. 7). BCR, B-cell receptor; ITAM, immunoreceptor tyrosine-based activation motif.
Discussion
In this study, we have shown that B-cell affinity discrimination requires that kinetic proofreading predominate over serial engagement. Our results show that a monotonic increase in B-cell signaling with increasing affinity, up to an affinity value of KA=1010 M−1, requires a kinetic proofreading-type mechanism, whereby Ag must remain bound to BCR for a threshold time of several seconds before the Ig-α and Ig-β subunits of BCR become capable of binding Lyn. Such a kinetic proofreading requirement is necessary if the BCR is to overcome the decrease in serial engagement that is associated with increasing Ag affinity, and to be able discriminate between Ags with affinities as high as KA=108 M−1 and KA=109 M−1, as seen in other B cell activation experiments. The necessary threshold time of approximately 5–10 s predicted by our model matches well (within the same order of magnitude) with the experimentally observed time required for BCR signaling domains to undergo Ag and lipid raft-mediated conformational changes that lead to association with Syk.9, 22, 23, 40
Our model shows that if BCR molecules become signaling-capable immediately after binding Ag, the decrease in serial engagement as affinity (and bond lifetime) increases results in less BCR ITAM phosphorylation and hence weaker signaling, which is the opposite of what is observed in B-cell activation experiments.7, 8 A kinetic proofreading requirement of 1 s results in competition between serial engagement and kinetic proofreading and a non-monotonic affinity discrimination pattern with increasing Ag affinity. A kinetic proofreading requirement of ∼10 s appears necessary to reproduce the experimentally observed monotonic increase in signaling strength with increasing Ag affinity, as well as the B-cell activation threshold affinity of KA=106 M−1 and ceiling of KA=1010 M−1. If the threshold time is increased significantly past ∼10 s, our model's results disagree with the experimentally observed B-cell threshold activation affinity of KA=106 M−1.
The stochastic nature of our Monte Carlo simulation allows us to estimate the overlap in signaling response between Ag affinity values through probability distribution measures of signaling activation, such as histograms. Probability distributions in the form of histograms may contain information and generate insight that is not readily apparent from mean-field models. Such consideration of stochastic effects in elucidating affinity discrimination in adaptive immune cells has not been explored in earlier studies. In addition, stochastic recognition by a few very high-affinity BCRs can be key to the activation of preplasma cells. Thus, the use of an agent-based stochastic modeling procedure is all the more appropriate, as Ag (or BCR) concentrations during both in vitro and in vivo situations may be so low as to not justify assumptions of continuity. The use of a modeling technique that includes spatial effects is also important, as it incorporates effects such as competition between BCRs for Ag and between Lyn and Syk for ITAMs.
It is known that BCRs form oligomers immediately prior to the onset of signaling.22, 43, 44 We explored the idea that BCR dimerization, as a simplified model for BCR oligomerization, could be the physical basis of the threshold time that our model predicts is necessary for affinity discrimination. When we used the timescale of dimer formation as the threshold time of Ag binding, there was a slight improvement in affinity discrimination in the lower affinity range compared to a constant threshold Ag binding time of 10 s. This is due to the increase in the timescale of dimer formation as affinity decreases, with fewer and fewer BCRs satisfying the kinetic proofreading requirement as affinity increases. For the lowest affinity value, the average dimerization time was long (∼18 s), such that the kinetic proofreading requirement was never satisfied, resulting in a total absence of signaling. A very low rate of oligomer formation could thus explain why nonspecific Ags fail to activate B cells.
Experimental studies of B-cell activation show a significant change in FRET intensity between BCR cytoplasmic chains within a few seconds of BCR encountering Ag.9, 22, 23, 40 This suggests that a lipid raft-mediated conformational change (or a series of conformational changes) occurs in BCR upon encountering membrane Ag. What is intriguing is that the abovementioned FRET experiments show a sharp increase, followed by a decrease, in intracellular FRET between BCR signaling domains for a timescale on the order of about 10–100 s.22 Based on this finding, Tolar et al.22 propose a mechanism of B-cell signaling by which BCRs undergo a series of Ag and lipid raft-meditated conformational changes to a signaling capable ‘open' conformation within a finite timeframe following Ag binding. Oligomerization of BCR molecules is an early event in such a series of conformational changes and thus could serve as the physical basis of the threshold time proposed in our model.
An affinity-dependent signaling response at the level of microclusters can be integrated (from many such clusters) inside B cells into an affinity-dependent downstream response that will lead to affinity-dependent spreading of the B-cell surface.8 This will consequently lead to affinity-dependent collection of Ags in the B-cell immunological synapse as BCR–Ag affinity increases.7, 8 Thus, one of the major functions of the B-cell immunological synapse could be to collect Ags in an affinity-dependent manner for presentation to T cells. Affinity-dependent presentation of Ags to T cells can, in turn, modulate in vivo affinity-discrimination of mature T cells.
Our model has the distinguishing feature that the probabilistic, dimensionless parameters it employs can be mapped onto their physical counterparts, allowing a meaningful, quantitative comparison of our model's results with those of the empirical data. For example, a threshold time of 10,000 dimensionless simulation time steps can thus be mapped into a physical time of 10 s, and compared with the experimentally observed timescale of BCR ITAM phosphorylation9, 22, 23, 40 in a straightforward manner. The probability distributions generated by our model also readily lend themselves to comparison with similar distributions that could be obtained from single-cell biological experiments.
The intrinsic ability of BCRs to discriminate among Ags of varying affinity, as reflected in the increase in the number of bound Ags with increasing affinity, is modified by membrane-proximal early signaling events in a way that enhances affinity discrimination at the lower end of the affinity range, but attenuates it at the high end while maintaining the monotonic increase in signaling strength with affinity. An increase in the concentration of BCR–Ag complexes due to diffusional trapping, a phenomenon not captured by our current simplified model of B-cell signaling, would result in positive feedback and favor high-affinity binding (a higher number of BCR–Ag complexes form at high affinity, resulting in more diffusional trapping, and hence a greater flow of BCR and Ag molecules to the contact zone, resulting in even more BCR–Ag complexes and stronger signaling). Such an affinity-dependent mechanism could further improve affinity discrimination, especially for high-affinity values. A detailed model with explicit simulation of BCR-lipid raft formation is currently under investigation. B-cell affinity discrimination at the level of single-cell signaling and activation, as captured in the current study, is further modified in in vivo situations.5 Recent experiments show that only high-affinity B cells respond to Ag in vivo, even though the strength of their signaling was only twofold higher than that of B cells whose affinity was several orders of magnitude lower in vitro.5, 9 The formation of BCR dimers and early signaling events can determine the stop-or-go signal for B cells interacting with Ag-presenting cells, thereby providing an additional mechanism of clonal competition. Although our model represents a simplified version of the BCR signaling pathway, it captures the essential details of the early stages of B-cell activation and gives insight into this important immunological process.
Supplementary Information accompanies the paper on Cellular & Molecular Immunology's website (http://www.nature.com/cmi)
Acknowledgments
The authors thank Dr Emanual Maverakis, Dr Aaron Dinner and Dr Stephen Kaattari for proofreading the manuscript and offering valuable advice. PT and SR are supported by NIH grant AI074022.
Supplementary Information
References
- Lanzavecchia A. Antigen-specific interaction between T and B cells. Nature. 1985;314:537–539. doi: 10.1038/314537a0. [DOI] [PubMed] [Google Scholar]
- Batista FD, Neuberger M. Affinity dependence of the B-cell response to antigen: a threshold, a ceiling, and the importance of off-rate. Immunity. 1998;8:751–759. doi: 10.1016/s1074-7613(00)80580-4. [DOI] [PubMed] [Google Scholar]
- Kouskoff V, Famiglietti S, Lacaud G, Lang P, Rider JE, Kay BK, et al. Antigens varying in affinity for the B cell receptor induce differential B lymphocyte responses. J Exp Med. 1998;188:1453–1464. doi: 10.1084/jem.188.8.1453. [DOI] [PMC free article] [PubMed] [Google Scholar]
- Batista FD, Neuberger M. B cells extract and present immobilized antigen: implications for affinity discrimination. EMBO J. 2000;19:513–520. doi: 10.1093/emboj/19.4.513. [DOI] [PMC free article] [PubMed] [Google Scholar]
- Shih TA, Meffre E, Roederer M, Nussenzweig MC. Role of antigen receptor affinity in T cell-independent antibody responses in vivo. . Nat Immunol. 2002;3:399–406. doi: 10.1038/ni776. [DOI] [PubMed] [Google Scholar]
- Shih TA, Meffre E, Roederer M, Nussenzweig MC. Role of BCR affinity in T cell dependent responses in vivo. . Nat Immunol. 2002;3:570–575. doi: 10.1038/ni803. [DOI] [PubMed] [Google Scholar]
- Carrasco YR, Fleire SJ, Cameron T, Dustin ML, Batista FD. LFA-1/ICAM-1 interaction lowers the threshold of B cell activation by facilitating B cell adhesion and synapse formation. Immunity. 2004;20:589–599. doi: 10.1016/s1074-7613(04)00105-0. [DOI] [PubMed] [Google Scholar]
- Fleire SJ, Goldman JP, Carrasco YR, Weber M, Bray D, Batista FD. B cell ligand discrimination through a spreading and contracting response. Science. 2006;312:738–741. doi: 10.1126/science.1123940. [DOI] [PubMed] [Google Scholar]
- Liu W, Meckel T, Tolar P, Sohn HW, Pierce SK. Antigen affinity discrimination is an intrinsic function of the B cell receptor. J Exp Med. 2010;207:1095–1111. doi: 10.1084/jem.20092123. [DOI] [PMC free article] [PubMed] [Google Scholar]
- Carrasco YR, Batista FD. B cell recognition of membrane-bound antigen: an exquisite way of sensing ligands. Curr Opin Immunol. 2006;18:286–291. doi: 10.1016/j.coi.2006.03.013. [DOI] [PubMed] [Google Scholar]
- Batista FD, Iber D, Neuberger MS. B cells acquire antigen from target cells after synapse formation. Nature. 2001;411:489–494. doi: 10.1038/35078099. [DOI] [PubMed] [Google Scholar]
- Carrasco YR, Batista FD. B cells acquire particulate antigen in a macrophage-rich area at the boundary between the follicle and the subcapsular sinus of the lymph node. Immunity. 2007;27:160–171. doi: 10.1016/j.immuni.2007.06.007. [DOI] [PubMed] [Google Scholar]
- Depoil D, Fleire S, Treanor BL, Weber M, Harwood NE. CD19 is essential to B cell activation by promoting B cell receptor–antigen micro-cluster formation in response to membrane-bound ligand. Nat Immunol. 2008;9:63–72. doi: 10.1038/ni1547. [DOI] [PubMed] [Google Scholar]
- Batista FD, Harwood NE. The who, how, and where of antigen presentation to B cells. Nat Rev Immunol. 2009;9:15–27. doi: 10.1038/nri2454. [DOI] [PubMed] [Google Scholar]
- Carrasco YR, Batista FD. B-cell activation by membrane-bound antigens is facilitated by the interaction of VLA-4 with VCAM-1. EMBO J. 2006;25:889–899. doi: 10.1038/sj.emboj.7600944. [DOI] [PMC free article] [PubMed] [Google Scholar]
- Bergtold A, Desai DD, Gavhane A, Clynes R. Cell surface recycling of internalized antigen permits dendritic cell priming of B cells. Immunity. 2005;23:503–514. doi: 10.1016/j.immuni.2005.09.013. [DOI] [PubMed] [Google Scholar]
- Junt T, Moseman EA, Iannacone M, Massberg S, Lang PA, Boes M. Subcapsular sinus macrophages in lymph nodes clear lymph-borne viruses and present them to antiviral B cells. Nature. 2007;450:110–114. doi: 10.1038/nature06287. [DOI] [PubMed] [Google Scholar]
- Phan TG, Grigorova I, Okada T, Cyster JG. Subcapsular encounter and complement dependent transport of immune complexes by lymph node B cells. Nat Immunol. 2007;8:992–1000. doi: 10.1038/ni1494. [DOI] [PubMed] [Google Scholar]
- Qi H, Egen JG, Huang AY, Germain RN. Extrafollicular activation of lymph node B cells by antigen-bearing dendritic cells. Science. 2006;312:1672–1676. doi: 10.1126/science.1125703. [DOI] [PubMed] [Google Scholar]
- Schwickert TA, Lindquist RL, Shakhar G, Livshits G. Skokos D. In vivo imaging of germinal centers reveals a dynamic open structure. Nature. 2007;446:83–87. doi: 10.1038/nature05573. [DOI] [PubMed] [Google Scholar]
- Balázs M, Martin F, Zhou T, Kearney J. Blood dendritic cells interact with splenic marginal zone B cells to initiate T-independent immune responses. Immunity. 2002;17:341–352. doi: 10.1016/s1074-7613(02)00389-8. [DOI] [PubMed] [Google Scholar]
- Tolar P, Sohn HW, Pierce SK. Viewing the antigen induced initiation of B cell activation in living cells. Immunol Rev. 2008;221:64–76. doi: 10.1111/j.1600-065X.2008.00583.x. [DOI] [PubMed] [Google Scholar]
- Sohn HW, Tolar P, Pierce SK. Membrane heterogeneities in the formation of B cell receptor–Lyn kinase microclusters and the immune synapse. J Cell Biol. 2008;182:367–379. doi: 10.1083/jcb.200802007. [DOI] [PMC free article] [PubMed] [Google Scholar]
- McKeithan TW. Kinetic proofreading in T-cell receptor signal-transduction. Proc Natl Acad Sci USA. 1995;92:5042–5046. doi: 10.1073/pnas.92.11.5042. [DOI] [PMC free article] [PubMed] [Google Scholar]
- Goldstein B, Faeder JR, Hlavacek WS. Mathematical and computational models of immune-receptor signaling. Nat Rev Immunol. 2004;4:445–456. doi: 10.1038/nri1374. [DOI] [PubMed] [Google Scholar]
- Grakoui A, Bromley SK, Sumen C, Davis MM, Shaw AS, Allen PM. The immunological synapse: a molecular machine controlling T cell activation. Science. 1999;285:221–227. [PubMed] [Google Scholar]
- Coombs D, Kalergis AM, Nathenson SG, Wofsy C, Goldstein B. Activated TCRs remained marked for internalization after dissociation from pMHC. Nat Immunol. 2002;3:926–931. doi: 10.1038/ni838. [DOI] [PubMed] [Google Scholar]
- Kalergis AM, Boucheron N, Doucey MA, Palmieri E, Goyarts EC, Vegh Z. Efficient cell activation requires an optimal dwell-time of interaction between the TCR and the pMHC complex. Nat Immunol. 2001;2:229–234. doi: 10.1038/85286. [DOI] [PubMed] [Google Scholar]
- Coombs D, Dembo M, Wofsy C, Goldstein B. Equilibrium thermodynamics of cell–cell adhesion mediated by multiple receptor–ligand pairs. Biophys J. 2004;86:1408–1423. doi: 10.1016/S0006-3495(04)74211-3. [DOI] [PMC free article] [PubMed] [Google Scholar]
- Tsourkas P, Baumgarth N, Simon SI, Raychaudhuri S. Mechanisms of B cell synapse formation predicted by Monte Carlo simulation. Biophys J. 2007;92:4196–4208. doi: 10.1529/biophysj.106.094995. [DOI] [PMC free article] [PubMed] [Google Scholar]
- Tsourkas P, Longo ML, Raychaudhuri S. Monte Carlo simulation of single molecule diffusion can elucidate the mechanism of B cell synapse formation. Biophys J. 2008;95:1118–1125. doi: 10.1529/biophysj.107.122564. [DOI] [PMC free article] [PubMed] [Google Scholar]
- Raychaudhuri S, Tsourkas P, Willgohs E.Computational modeling of receptor–ligand binding and cellular signaling processesIn: JueT(ed.) Handbook of Modern Biophysics, Vol. I: Fundamentals New York; Humana Press; 200941–61. [Google Scholar]
- Bell GI. Cell–cell adhesion in the immune system. Immunol Today. 1983;4:237–240. doi: 10.1016/0167-5699(83)90035-X. [DOI] [PubMed] [Google Scholar]
- Dembo M, Torney TC, Saxman K, Hammer D. The reaction-limited kinetics of membrane-to-surface adhesion and detachment. Proc R Soc Lond B. 1988;234:55–83. doi: 10.1098/rspb.1988.0038. [DOI] [PubMed] [Google Scholar]
- Hou P, Araujo E, Zhao T, Zhang M, Massenburg D, Veselits M, et al. B cell receptor signaling and internalization are mutually exclusive events. PLoS Biol. 2006;4:1147–1158. doi: 10.1371/journal.pbio.0040200. [DOI] [PMC free article] [PubMed] [Google Scholar]
- Favier B, Burroughs NJ, Weddeburn L, Valitutti S. T cell antigen receptor dynamics on the surface of living cells. Int Immunol. 2001;13:1525–1532. doi: 10.1093/intimm/13.12.1525. [DOI] [PubMed] [Google Scholar]
- Wofsy C, Torigoe C, Kent UM, Metzger H, Goldstein B. Exploiting the difference between intrinsic and extrinsic kinases: implications for regulation of signaling by immunoreceptors. J Immunol. 1997;159:5984–5992. [PubMed] [Google Scholar]
- Faeder JR, Hlavacek WS, Reischl I, Blinov ML, Metzger H, Redondo A, et al. Investigation of early events in FcεRI-mediated signaling using a detailed mathematical model. J Immunol. 2003;170:3769–3781. doi: 10.4049/jimmunol.170.7.3769. [DOI] [PubMed] [Google Scholar]
- Tsang E, Giannetti AM, Shaw D, Dinh M, Tse JK, Ghandi S, et al. Molecular mechanism of the Syk activation switch. J Biol Chem. 2008;283:32650–32659. doi: 10.1074/jbc.M806340200. [DOI] [PubMed] [Google Scholar]
- Tolar P, Sohn HW, Pierce SK. The initiation of antigen induced BCR signaling viewed in living cells by FRET. Nat Immunol. 2005;6:1168–1176. doi: 10.1038/ni1262. [DOI] [PubMed] [Google Scholar]
- Valitutti S, Muller S, Cella M, Padovan E, Lanzavecchia A. Serial triggering of many T-cell receptors by a few peptide–MHC complexes. Nature. 1995;375:148–151. doi: 10.1038/375148a0. [DOI] [PubMed] [Google Scholar]
- Valitutti S, Lanzavecchia A. Serial triggering of TCRs: a basis for the sensitivity and specificity of antigen recognition. Immunol Today. 1997;18:299–304. [PubMed] [Google Scholar]
- Tolar P, Hanna J, Krueger PD, Pierce SK. The constant region of the membrane immunoglobulin mediates B cell–receptor clustering and signaling in response to membrane antigens. Immunity. 2009;30:44–55. doi: 10.1016/j.immuni.2008.11.007. [DOI] [PMC free article] [PubMed] [Google Scholar]
- Tolar P, Sohn HW, Liu W, Pierce SK. The molecular assembly and organization of signaling active B-cell receptor oligomers. Immunol Rev. 2009;232:34–41. doi: 10.1111/j.1600-065X.2009.00833.x. [DOI] [PubMed] [Google Scholar]
Associated Data
This section collects any data citations, data availability statements, or supplementary materials included in this article.