

Abstract
Amyloid-β (Aβ) deposition in the brain vasculature results in cerebral amyloid angiopathy (CAA), which occurs in about 80% of Alzheimer’s disease (AD) patients. While Aβ42 predominates parenchymal amyloid plaques in AD brain, Aβ40 is prevalent in the cerebrovascular amyloid. Dutch mutation of Aβ40 (E22Q) promotes aggressive cerebrovascular accumulation and leads to severe CAA in the mutation carriers; knowledge of how DutchAβ40 drives this process more efficiently than Aβ40 could reveal various pathophysiological events that promote CAA. In this study we have demonstrated that DutchAβ40 show preferential accumulation in the blood-brain-barrier (BBB) endothelial cells due to its inefficient blood-to-brain transcytosis. Consequently, DutchAβ40 establishes a permeation barrier in the BBB endothelium, prevents its own clearance from the brain and promotes the formation of amyloid deposits in the cerebral microvessels. The BBB endothelial accumulation of native Aβ40 is not robust enough to exercise such a significant impact on its brain clearance. Hence, the cerebrovascular accumulation of Aβ40 is slow and may require other co-pathologies to precipitate into CAA. In conclusion, the magnitude of Aβ accumulation in the BBB endothelial cells is a critical factor that promotes CAA; hence, clearing vascular endothelium of Aβ proteins may halt or even reverse CAA.
Keywords: Amyloid beta proteins, blood-brain barrier, cerebral amyloid angiopathy, Alzheimer’s disease, transcytosis
Introduction
Progressive accumulation of amyloid beta (Aβ) proteins in the brain microvasculature leads to cerebral amyloid angiopathy (CAA) 1, which is responsible for a large proportion of cerebral hemorrhages occurring in non-hypertensive individuals 2. The CAA is closely associated with the Alzheimer’s disease (AD); about 80% of AD patients manifest CAA 3. Although causatively linked, AD and CAA differ in Aβ accumulation patterns. Histopathological examination of AD human brains suggests that the regions harboring cerebrovascular amyloid are usually devoid of plaques, whereas the brain regions rich in parenchymal amyloid plaques show very little vascular amyloid 4. Moreover, parenchymal amyloid plaques mostly contain Aβ42, whereas the cerebrovascular amyloid deposits primarily contain Aβ40 5. A high Aβ40:42 ratio triggers the formation of vascular amyloid over parenchymal plaques 6, while an increase in Aβ42 redirects Aβ deposition from the vasculature to the parenchyma 7–8.
The impact of aberrant Aβ40:42 ratios on the cerebrovascular amyloid accumulation was further resolved in patients and transgenic animals carrying such mutations as Dutch, Indiana, Italian, and London. Indiana and London mutations cause elevated Aβ42 levels that result in a lower Aβ40:42 ratio, less pronounced vascular amyloid, and significant Aβ accumulation in the brain parenchyma 9–11. Alternatively, patients and transgenic mice with Dutch or Italian mutations show a higher Aβ40:42 ratio and manifest a severe form of CAA 12–13. Individuals carrying Dutch mutation consistently develop hereditary cerebral hemorrhage with amyloidosis-Dutch type (HCHWA-D) and suffer cerebral hemorrhagic stroke often leading to death at an early age 12. On the other hand, humans and transgenic mice carrying Swedish and Flemish mutations have elevated levels of both Aβ40 and Aβ42 14 and show parenchymal as well as vascular amyloid deposition 15–17.
These observations suggest a strong causative relationship between the cerebrovascular accumulation of Aβ40 and CAA. The DutchAβ40 that differs from Aβ40 by a single point mutation at position 22 (E→Q) shows aggressive cerebrovascular accumulation and stands at the extreme end of the CAA spectrum. In this study, utilizing Aβ40, and DutchAβ40 as model proteins, we isolated the physiological processes that differentially regulate the deposition of these Aβ proteins in the cerebral vasculature.
Materials and methods
Synthesis of Aβ proteins
The human Aβ proteins with and without fluorescein label was synthesized in Mayo Proteomics Core using the procedures described previously 18 and their weights were confirmed by electrospray ionization mass spectrometry (Sciex API 165; Applied Biosystems/MDS Sciex, Foster City, CA).
Radioiodination of Aβ40 or DutchAβ40
Five hundred micrograms of Aβ40 or DutchAβ40 was labeled with carrier-free Na125I, using the chloramine-T procedure as described previously 19. Purity of the radiolabeled proteins was determined by trichloroacetic acid (TCA) precipitation. The specific activity of the proteins thus obtained was determined at 4.0 ± 0.1 μCi/μg. No significant difference was observed between the specific activities of 125I-Aβ40 and 125I-DutchAβ40.
Plasma and cerebrovascular pharmacokinetics of 125I-Aβ40 and 125I-DutchAβ40
The plasma pharmacokinetics and the cerebrovascular accumulation of 125I-Aβ40 or 125I-DutchAβ40 were determined as follows. The femoral vein and artery of each rat was catheterized under general anesthesia (isoflurane = 1.5% and oxygen = 4 l/min). A bolus injection (50 μCi) of 125I-Aβ-40 or 125I-DutchAβ40 was administered in the femoral vein and the blood (20 μl) was sampled from the femoral artery at several intervals over the ensuing time period. At the end of 15 min, an aliquot of 131I-BSA (50 μCi) was injected into the femoral vein to serve as a measure of residual plasma volume (Vp; μl/g). The intact 125I-Aβ-40, 125I-DutchAβ40, or 131I-BSA concentration in the plasma was assayed following TCA precipitation using a two-channel gamma counter (Cobra II, Packard). The measured activity was corrected for the background and crossover of 131I activity into the 125I channel. The residual brain region plasma volume (Vp, μl/g) is calculated as:
| (1) |
where qp is the 131I-BSA content (cpm) of tissue. Cv is the 131I-BSA concentration (cpm/ml) in plasma, W is the dry weight (g) of the brain region, and R is the wet weight/dry weight ratio for rats of a defined age group. From the total 125I-Aβ content (qt) (cpm) of the brain region, the amount that enters the cerebral vasculature (q) (cpm/g) is calculated as:
| (2) |
where Ca is the final 125I-Aβ concentration (cpm/ml) in plasma.
The plasma concentrations of 125I-Aβ40 or 125I-DutchAβ40 obtained at various time points were fitted to the following model using iterative reweighting (WinNonlin® Professional, version 5.2, Mountain view, CA).
| (3) |
where C(t) = plasma concentration of 125I-Aβ40 or 125I-DutchAβ40 (μCi/ml); A and B are the intercepts; and α and β are the slopes of the biexponential curve. Plasma pharmacokinetic parameters such as the maximum plasma concentration (Cmax), plasma clearance (CL), the steady state volume of distribution (Vd), and area under plasma concentration curve (AUC) were also determined.
The kinetics of 125I-Aβ40 or 125I-DutchAβ40 distribution to the cerebral vasculature was further elucidated by dynamic single photon emission tomography (SPECT). Each WT mouse was maintained under general anesthesia during the induction (4% isoflurane + 2 liters/min oxygen in the induction chamber) and injected with 1 mCi of 125I-Aβ40 or 125I-DutchAβ40. The imaging of the animals continued under general anesthesia (2% isoflurane + 2 liters/min oxygen using nose cone) every 15 sec for 20 min on the X-SPECT pre-clinical imaging system (Gamma Medica, Northridge, CA). The images thus obtained were analyzed using PMOD Biomedical Image Quantification and Kinetic Modeling Software (PMOD Technologies, Switzerland).
The extent of 125I-Aβ40 or 125I-DutchAβ40 distribution to brain vasculature at various time points was determined by:
| (4) |
In vitro BBB model
Primary bovine brain microvascular endothelial (BBME) cells were obtained frozen from the Cell Applications Inc. (San Diego, CA). The cells were cultured on the Transwell® filter membranes (Costar, Cambridge, MA) or on 6-well plates coated with 0.01 % rat tail collagen (type 1) followed by 0.01 % bovine fibronectin for 12–14 days. A well formed polarized monolayer was selected based on high transendothelial electrical resistance (TEER) values (>200 ohms) measured using Millicell-ERS fitted with ‘chopstick’ electrodes (Millipore Corp., Bedford, MA).
125I-Aβ40 or 125I-DutchAβ40 permeability across the polarized BBME cell monolayer
To determine L-A transport, a 0.5 ml aliquot of the donor solution containing 35 nCi of 125I-Aβ40 or 125I-DutchAβ40 in HBSS-HEPES (donor solution) was added to the luminal side and a 1.5 ml aliquot of fresh HBSS-HEPES (receiver solution) was added to the abluminal side. To measure the A-L transport, 1.5 ml donor solution containing 125I-Aβ protein was added to the abluminal compartment and 0.5 ml receiver solution was added to the luminal compartment. The Transwells® were then incubated at 37 °C or at 4 °C upon continuous shaking at 80 rpm. Samples (20μl) from the receiver solution were obtained at 0, 15, 30, 45, 60 and 90 min and an equal volume of fresh HBSS-HEPES solution was added. The amount of intact and degraded 125I-Aβ40 or 125I-DutchAβ40 protein in the samples was assayed in the gamma counter (Cobra II; Amersham Biosciences Inc., Piscataway, NJ) after TCA precipitation. The flux and apparent permeability of 125I-Aβ40 or 125I-DutchAβ40 across the BBME cell monolayer was calculated from the following equations:
| (5) |
| (6) |
where M is the cumulative amount of 125I-Aβ protein in the receiver solution at time t (min); A is the diffusion surface area (cm2); Papp is the apparent permeability (cm/min); Cd is the initial concentration of the 125I-Aβ in the donor solution.
To evaluate the effect of counter current L-A transcytosis on the A-L clearance across the BBB, equal concentration of 125I-Aβ40 or 125I-DutchAβ40 was added to both the luminal and abluminal sides of BBME cell monolayer. Samples were taken from the luminal and abluminal sides at predetermined time points (30, 60 and 90 min) and assayed for radioactivity.
Accumulation of F-Aβ40 and F-DutchAβ40 in BBME cell monolayer
These studies were conducted in polarized BBME cell monolayers grown on permeable Transwell® filters as well as on non-permeable collagen coated 6-well plates. After pre-incubating the monolayer with HBSS-HEPES at 37 °C for 30 min, 15 μg/ml of F-Aβ40 or F-DutchAβ40 in HBSS-HEPES was added to either luminal or abluminal side of the monolayer and incubated for 1 hour at 37 °C. The experiment was terminated by washing the monolayers with ice-cold PBS and then the cellular fluorescence was detected by flow cytometry or laser confocal microscopy.
Mathematical BBB model
Based on the knowledge gained from the above in vivo and in vitro experiments, and from the literature, a BBB model that describes the steady-state transport of Aβ proteins was constructed (Fig. 5). Endowed with experimentally measurable and predicted (those that are not experimentally accessible) kinetic parameters, the model is expected to elucidate factors responsible for differences in the transport behavior of Aβ40 and DutchAβ40.
Figure 5.
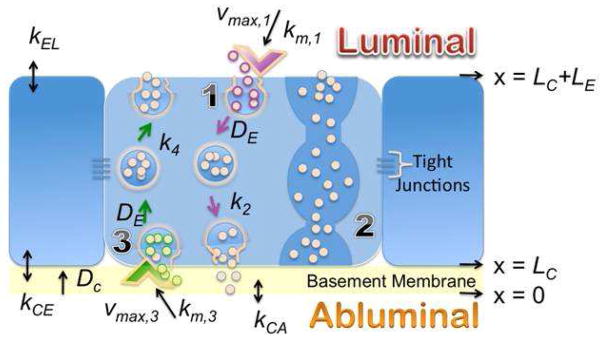
Description of the blood-brain-barrier model. (1) L-A transcytosis; (2) Transendothelial channels that allow macromolecular diffusion from the blood to tissues or in the reverse direction. However, such channels are rarely formed in cerebrovascular endothelium and hence are ignored in the model; (3) A-L transcytosis. z, position along the z-axis; z = 0, position along the z-axis at the interface of basement membrane and the abluminal surface; LC, thickness of the basement membrane; LE, thickness of the endothelial cell; kCA, Aβ partition coefficient between the abluminal compartment and the basement membrane; kCE, Aβ partition coefficient between the basement membrane and the endothelial cell membrane abutting the basement membrane; Vmax,3 and km,3, Michaelis-Menten parameters describing receptor-mediated internalization of Aβ proteins at the abluminal surface of the endothelial cell; k4, rate constant due to the fusion of Aβ-carrying vesicles with the luminal membrane; kEL, Aβ partition coefficient between blood and the luminal surface of the endothelial cell; Vmax,1 and km,1, Michaelis-Menten parameters describing receptor-mediated internalization of Aβ proteins at the luminal surface of the endothelial cell; and k2, rate constant for the fusion of Aβ-carrying vesicles with the abluminal membrane; DC, Aβ effective diffusion coefficient in the basement membrane; DE, Diffusion coefficient of Aβ carrying vesicles in the endothelial cell.
Results
Plasma Pharmacokinetics and Cerebrovascular uptake of 125I-Aβ40 and 125I-DutchAβ40
Following IV bolus administration in rats, both 125I-Aβ40 and 125I-DutchAβ40 exhibited biexponential plasma disposition (Fig. 1A). The transfer rate constant of 125I-Aβ40 from plasma to the tissue compartment (K12) was significantly greater than that of 125I-DutchAβ40 (Table 1). However, no significant difference in the tissue to plasma rate constants (K21) was observed between 125I-Aβ40 and 125I-DutchAβ40. In addition, the plasma elimination rate (K10) of 125I-Aβ40 was significantly greater than that of 125I-DutchAβ40. The volume of distribution of 125I- DutchAβ40 was three-fold higher than that of 125I-Aβ40, whereas 125I-Aβ40 demonstrated a significantly lower clearance and larger area under the curve (AUC) compared to 125I-DutchAβ40 (Table 1). The cerebrovascular accumulation of 125I-Aβ40 in various brain regions was found to be significantly greater than that of 125I-DutchAβ40 (Fig. 1B).
Figure 1.

125I-DutchAβ40 pharmacokinetics are characterized by higher plasma clearance and lower brain accumulation than 125I-Aβ40. (A) Plasma pharmacokinetics following IV bolus (50 μCi) injection of 125I-Aβ40 and 125I-DutchAβ40 in 24-week-old Sprague-Dawley rats. The lines indicate the fit of a two compartment pharmacokinetic model (Equation 3) to the plasma concentration-time data. (B) Accumulation of 125I-Aβ40 and 125I-DutchAβ40 in the cerebral vasculature fifteen minutes after the IV bolus administration. Data are mean ± S.D. (n = 5)
Table 1.
Plasma pharmacokinetic parameter estimates for 125I-Aβ40 and 125I- DutchAβ40 in 24-week-old Sprague-Dawley rats after IV bolus injection.
| Parameters | 125I-Aβ40 | 125I-DutchAβ40 | p |
|---|---|---|---|
| Cmax (μg/ml) | 1.09 ± 0.02 | 0.27 ± 0.01 | * |
| K10 (1/min) | 0.16 ± 0.02 | 0.07 ± 0.01 | * |
| K21 (1/min) | 0.24 ± 0.03 | 0.13 ± 0.32 | n.s |
| K12 (1/min) | 0.44 ± 0.03 | 0.32 ± 0.01 | * |
| AUC (min*μg/ml) | 5.33 ± 0.45 | 2.54 ± 5.01 | * |
| CL (ml/min) | 18.76 ± 1.60 | 39.44 ± 0.01 | * |
| Vd (ml) | 310. ± 5.65 | 1101 ± 9.45 | *** |
Data are mean ± S.D (n = 5).
Statistical significance indicated by
p < 0.001,
p < 0.05 (Student’s test).
n.s; nonsignificant, p > 0.05.
Kinetics of 125I-Aβ40 and 125I-DutchAβ40 distribution to cerebral vasculature
The affinity of 125I-Aβ40 and 125I-DutchAβ40 to cerebrovascular endothelium as well as their distribution to the cerebral vasculature following IV bolus administration in mice was determined by dynamic SPECT imaging. The plasma to brain partitioning within 15 sec of IV bolus injection showed that 125I-DutchAβ40 (filled square, Fig. 2) has higher affinity to cerebrovascular endothelium than 125I-Aβ40 (open square, Fig. 2). However, the cerebrovascular distribution of 125I-DutchAβ40 (filled circles, Fig. 2) at later time points was substantially lower than that of 125I-Aβ40 (open circles, Fig. 2).
Figure 2.
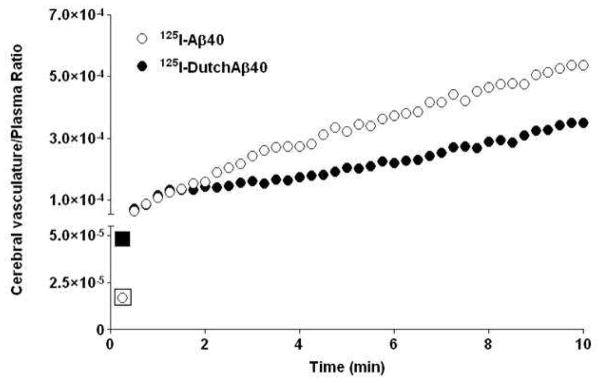
Greater affinity to the blood-brain-barrier endothelium but lower cerebrovascular permeability of 125I-DutchAβ40 compared to 125I-Aβ40 in mice. Distribution of 125I-Aβ40 and 125I-DutchAβ40 to the cerebral vasculature within 10 min of intravenous bolus (1 mCi) administration as determined from the dynamic single photon emission computerized tomography (SPECT/CT). Although partitioning of 125I-DutchAβ40 to cerebral vasculature (first data point) is greater than that of 125I-Aβ40, the permeability (slope) is actually lower.
Transcytosis of 125I-Aβ40 and 125I-DutchAβ40 across the BBB in vitro
The L-A and A-L permeabilities of 125I-Aβ40 across BBME cell monolayer at 37 °C are not significantly different from each other, whereas permeability of DutchAβ40 in L-A direction was significantly lower than that in A-L direction (Fig. 3 A).
Figure 3.
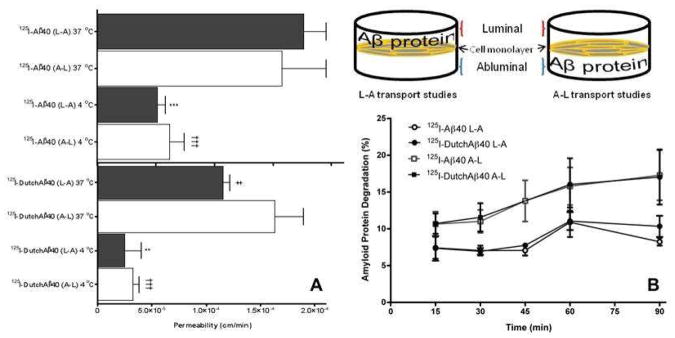
Lower luminal-to-abluminal permeability but similar abluminal-to-luminal permeability of 125I-DutchAβ40 compared to 125I-Aβ40 in vitro. (A) Apparent permeability of 125I-Aβ40 and 125I-DutchAβ40 across polarized BBME cell monolayers in luminal-to-abluminal (L-A) and abluminal-to-luminal (A-L) directions at 37 °C and 4 °C. Data are presented as mean ± SEM (n = 4). Student’s t-test was used to compare various groups. ***p < 0.001, 125I-Aβ40 (L-A) at 4 °C versus at 37 °C; **p < 0.01, 125I-DutchAβ40 (L-A) at 4 °C versus at 37 °C; †††p < 0.001, 125I-Aβ40 (A-L) at 4 °C versus at 37 °C or 125I-DutchAβ40 (A-L) at 4 °C versus at 37 °C; ‡p < 0.05, 125I-DutchAβ40 (L-A) at 37 °C versus 125I-Aβ40 at 37 °C (L-A). (B) Degradation, assayed by TCA precipitation method, of 125I-Aβ40 and 125I-DutchAβ40 proteins following the transcytosis across the BBME cell monolayer in either L-A or A-L direction at 37 °C.
At 4 °C, where most of the active transport processes are inhibited, the L-A and A-L permeabilities of both 125I-Aβ40 and 125I-DutchAβ40 decreased significantly compared to those at 37 ° (Fig. 3 A). Moreover, the difference between L-A and A-L permeabilities of 125I-DutchAβ40 observed at 37 °C diminished at 4 °C (Fig. 3 A).
The degradation of 125I-Aβ40 and 125I-DutchAβ40 in the endothelial cells following transcytosis in L-A or A-L directions was similar (Fig. 3 B). However, it is interesting to note that both proteins degraded more following the transcytosis in A-L direction than in L-A direction (Fig. 3 B).
Accumulation of F-Aβ40 and F-DutchAβ40 in BBME cell monolayer
The Z-series images of BBME cell monolayers treated with fluorescein labeled Aβ40 (F-Aβ40) and DutchAβ40 (F-DutchAβ40) on the luminal side demonstrated substantially greater accumulation of DutchAβ40 (Fig. 4 II) in the endothelial cells than F-Aβ40 (Fig. 4 I).
Figure 4.

Endothelial Accumulation of F-DutchAβ40 compared to that of F-Aβ40 is higher in the luminal-abluminal direction but similar in the abluminal-luminal direction. Confocal (Z-stack) images showing the accumulation of fluorescein labeled Aβ (F-Aβ) proteins in polarized bovine brain microvascular endothelial (BBME) cell monolayers grown on a Transwell inserts. (I) Accumulation of F-Aβ40 in X-Y (transversal), X-Z (vertical), and Y-Z (vertical) planes following 60 min incubation on the luminal side; (II) Uptake of F-DutchAβ40 in X-Y, X-Z, and Y-Z planes following 60 min incubation on the luminal side; (III) Flow cytometry histograms showing similar uptake of F-Aβ proteins in the BBME cells grown on a non-permeable barrier, (A) untreated BBME cells; (B) uptake of F-Aβ40; (C) uptake of F-DutchAβ40; (IV) Accumulation of F-Aβ40 or F-DutchAβ40 following the transcytosis (60 min) in luminal-to-abluminal (L-A) and abluminal-to-luminal (A-L) directions across the BBME cell monolayer grown on a permeable Transwell® filter support.
The uptake of F-DutchAβ40 and F-Aβ40 by the BBME cell monolayers grown on non-permeable versus permeable supports was measured using flow cytometry. No difference was observed between the uptake of F-Aβ40 and F-DutchAβ40 by the BBME cell monolayer grown on non-permeable support (Fig. 4 III). However, the BBME cells grown on permeable filters internalized F-DutchAβ40 twice as much as that of F-Aβ40 in the L-A direction, but showed no such difference in the A-L direction (Fig. 4 IV).
Predictions from the BBB mathematical model
Calculations performed using the BBB model (Fig. 5) predicted higher endothelial cell accumulation of DutchAβ40 than Aβ40. Furthermore, a decrease in the rate of vesicular fusion (k2) that facilitate exocytosis to the abluminal side was shown to be responsible for greater DutchAβ40 accumulation within the cell, particularly at the basement membrane interface (yellow arrow), and also in the basement membrane (orange arrow) (Fig. 6 A). Additionally, the model has shown that the endothelial accumulation of DutchAβ40 is very sensitive to changes in k2. A decrease in k2 value promoted enhanced accumulation in the endothelial cells (Fig. 6 B).
Figure 6.
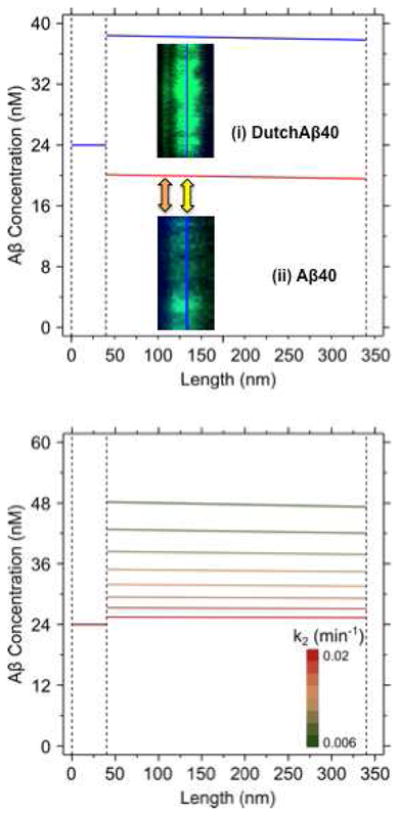
Blood-brain-barrier model predictions. (A) Differential concentration profiles of Aβ40 (red) and DutchAβ40 (blue) in the basement membrane (z: 0–40 nm) and endothelial cell (z: 40–340 nm), predicted based on the parameter estimates described in the supplemental information. Confocal images: (i) DutchAβ accumulation within the cell (yellow arrow), and particularly at the basement membrane interface (orange arrow). (ii) Aβ40 distributes more uniformly within the endothelial cell than DutchAβ40 with fewer hyper intensity regions and shows meager accumulation in the basement membrane. (B) Predicted effects of changes in abluminal (k2) exocytosis rate on the endothelial cell accumulation of DutchAβ40. When the k2 value was varied from 0.02 (red) to 0.006 (green) min−1 at 0.002 min−1 intervals, the endothelial accumulation of DutchAβ40 increased significantly.
Propensity of 125I-DutchAβ40 to accumulate in the abluminal compartment
Clearance of 125I-Aβ40 or 125I-DutchAβ40 from the abluminal side in the presence of countercurrent L-A transport was studied in vitro. Same concentration of 125I-Aβ40 (2.5 μCi/ml) or 125I-DutchAβ40 (1.9 μCi/ml) was added to both luminal and abluminal compartments of BBME cell monolayers and the changes in luminal and abluminal concentrations were determined overtime. The 125I-Aβ40 concentration decreased with time on the abluminal side (Fig. 7 A) and a similar increase in the luminal 125I-Aβ40 concentration was observed (Fig. 7 B). In case of 125I-DutchAβ40, the abluminal concentration increased (Fig. 7 A) and a corresponding decrease in the luminal concentration was noted (Fig. 7 B).
Figure 7.

Net abluminal accumulation of 125I-DutchAβ40 but luminal accumulation of 125I-Aβ40 was observed after the initiation of their bidirectional transport with the same luminal and abluminal concentrations. Net accumulation of 125I-Aβ40 or 125I-DutchAβ40 in the (A) abluminal or (B) luminal compartments separated by the bovine brain microvascular endothelial (BBME) cell monolayer. The data are mean ± SEM (n = 4).
Discussion
The current understanding of CAA, albeit sketchy, indicates that Aβ42 initiates the formation of amyloid deposits in the cerebral vasculature 20, but Aβ40 predominates Aβ42 in these deposits 12. In an attempt to explain how Aβ isoforms and mutations contribute to differences in the magnitude and patterns of cerebrovascular amyloid accumulation, researchers have weaved a web of hypotheses. Many of these hypotheses were framed to fit the downstream histopathological changes observed in AD transgenic animals and in patients. Without experimental verification, such phenomenological observations may muddle the cause and effect relationship and frustrate attempts towards identifying the fulcrum of pathological events that drive the disease process.
The pivotal role of BBB in CAA pathogenesis has been well documented. Pervading the enormous plasma and brain interface, the BBB not only regulates Aβ40:42 ratios but also maintains dynamic equilibrium between brain and plasma Aβ levels through a spectrum of kinetic interactions with Aβ proteins that may involve a battery of receptors, transporters and enzymes 21. Cerebrovascular accumulation of Aβ proteins is most likely triggered when the interactions with this physiological apparatus go awry. From this vantage point, using Aβ40 and DutchAβ40 as model proteins, we highlighted such processes that when perturbed promote abnormal amyloid accumulation in the cerebral vasculature.
It has been hypothesized that the accelerated accumulation of DutchAβ40 in the cerebral vasculature compared to native Aβ40 is due to its low systemic clearance 22–23; higher transcytosis in the blood-brain direction 24; and/or impaired efflux in the brain-blood direction 25. A thorough analysis of 125I-DutchAβ40 and 125I-Aβ40 plasma pharmacokinetics in rats (Fig. 1A) showed that the volume of distribution and plasma clearance (a product of plasma elimination rate constant and volume of distribution) of 125I-DutchAβ40 were respectively three-fold and two-fold greater than that of 125I-Aβ40 (Table 1). These pharmacokinetic parameters suggest rapid elimination of 125I-DutchAβ40 from the systemic circulation and/or extensive tissue distribution. Upon further analysis, the plasma elimination rate constant of 125I-DutchAβ40 was found to be lower than that of 125I-Aβ40 (Table 1). Hence, it follows from the data that the rapid systemic clearance of 125I-DutchAβ40 is due to its extensive tissue distribution. Surprisingly, however, the distribution of 125I-DutchAβ40 to the vasculature was significantly lower than that of 125I-Aβ40 in various brain regions (Fig. 1 B).
To resolve this paradox, we conducted dynamic SPECT imaging on mice within 20 min of injecting them with 125I-DutchAβ40 or 125I-Aβ40. These early time scans, which reveal initial interactions of 125I-labeled proteins with BBB endothelial cells, have demonstrated that 125I-DutchAβ40 (Fig. 2, closed square) partitions from plasma to cerebral vasculature more readily than 125I-Aβ40 (Fig. 2, open square). Nevertheless, the higher affinity of DutchAβ40 to the vascular endothelium did not translate into greater accumulation in the cerebral vasculature (Fig. 2, closed circles). Such an intriguing trend could be due to lower blood-to-brain permeability of DutchAβ40 at the BBB and/or higher efflux from brain-to-blood. It is very difficult to evaluate the contribution of each of these processes in vivo; hence, in-vitro studies were performed in the BBME cell monolayers to further resolve Aβ40 and DutchAβ40 transport mechanisms across the BBB.
The in vitro permeability studies indicated that the lower cerebrovascular accumulation of intravenously administered 125I-DutchAβ40 compared to that of 125I-Aβ40 is due to its lower L-A permeability (Fig. 3 A). However, these studies could not adequately explain the abnormal accumulation of DutchAβ40 in the cerebral vasculature. Hence we probed various steps involved in the transcytosis of Aβ40 and DutchAβ40 across the BBB to isolate the events that promote aggressive DutchAβ40 accumulation in the cerebral vasculature.
The L-A and A-L transcytosis of Aβ40 and DutchAβ40 across the BBB is expected to proceed in three stages: a) receptor mediated uptake on the luminal or abluminal side; b) cytoplasmic transit without degradation; and c) exocytosis on the opposite side. Owing to similar A-L permeabilities (Fig 3 A) and lack of significant differences in the degradation during transcytosis (Fig 3 B), we primarily focused on the L-A permeability differences between Aβ40 and DutchAβ40. The lower L-A permeability of DutchAβ40 could be due to modest uptake by the endothelial cells and/or inefficient transcytosis across the BBB. The manner in which these two events contribute to lower L-A permeability of DutchAβ40 was evaluated in structurally distinct BBME cell monolayers developed in our laboratory: a) the BBME cell monolayer constructed on an impermeable barrier (collagen coated 6-well plate), which restricts transcytosis, and b) the monolayers grown on a permeable barrier (Transwell® filter membrane) that allows transcytosis. Flow cytometry analysis indicated that the endothelial cells grown on 6-well plates internalized F-DutchAβ40 and F-Aβ40 to a similar extent (Fig. 4 III), but the BBME cell monolayers grown on permeable Transwell® filter supports showed significantly greater accumulation of F-DutchAβ40 than F-Aβ40 (Fig. 4 I, II and IV). These results implicate inefficient transcytotic events that transport internalized DutchAβ40 to the abluminal side as the primary reason for its accumulation in the endothelium.
In addition to the receptor-mediated uptake, the L-A transcytosis of Aβ proteins is accomplished by the vesicular diffusion across the cytosol 26–27 and exocytosis to the abluminal side via the fusion of Aβ carrying vesicles with the abluminal membrane, which in turn could be receptor-mediated or achieved through the biophysical interactions of the vesicles with the abluminal membrane. The quantitative BBB model (Fig. 5) developed in this study has predicted that the lower L-A transcytosis of DutchAβ40 (Fig. 3) may be due to inefficient exocytosis on the abluminal side, which could promote accumulation in the endothelial cells (Fig. 6).
The impact of greater endothelial cell accumulation of DutchAβ40 on its clearance from the brain was tested in vitro. Both luminal and abluminal sides of the BBME cell monolayer were maintained at the same concentrations of either 125I-DutchAβ40 or 125I-Aβ40 and the change in protein concentrations on the abluminal side was monitored. In such a system, 125I-DutchAβ40 accumulated but 125I-Aβ40 levels depleted with time on the abluminal side (Fig. 7 A).
These observations suggest that by accumulating in the cerebrovascular endothelium, DutchAβ40 could impair its own clearance from brain-to-blood and elicit HCHWA-D. Since the endothelial cell accumulation of native Aβ40 and its ability to aggregate in the basement membrane is not as robust as that of DutchAβ40, the Aβ40 may require accomplices such as apoE to chaperone its accumulation in the endothelium28, and the assistance of more amyloidogenic Aβ42 to form cerebrovascular amyloid deposits29. It can also be inferred from these studies that the accumulation of amyloid proteins in the cerebrovascular endothelium is the earliest pathological event that triggers CAA. The vascular wall damage, although easy to visualize and study, is most likely a much later event. Therefore, strategies aimed at clearing vascular endothelium of Aβ proteins may have the most chance of success in treating CAA.
Supplementary Material
Acknowledgments
We thank Dr. Dan McCormick and Jane A. Petersen for their technical expertise in synthesizing Aβ40 and DutchAβ40 and fluorescein labeled proteins. This work was supported by Alzheimer’s Association grant NIRG-09-133017 (KKK); NIH/NCRR/RCMI grant G12RR03020 (KKK); Neuroscience Cores for MR Studies of the Brain from NINDS grant number NS 057091 (JFP); the Minnesota Partnership for Biotechnology and Medical Genomics (JFP); and partially supported by funds from the National Science Foundation: grant DMR-105521 (AKP) as well as the National High Magnetic Field Laboratory (NHMFL) User Collaboration Research Grant (AKP). A portion of this work was performed at the National High Magnetic Field Laboratory (NHMFL), which is supported by National Science Foundation Cooperative Agreement No. DMR-0654118, the State of Florida, and the U.S. Department of Energy. The sponsor had no role in study design, collection, data analysis, data interpretation, and played no role in the decision to submit this paper for publication.
References
- 1.Rensink AA, de Waal RM, Kremer B, Verbeek MM. Pathogenesis of cerebral amyloid angiopathy. Brain Res Brain Res Rev. 2003;43(2):207–23. doi: 10.1016/j.brainresrev.2003.08.001. [DOI] [PubMed] [Google Scholar]
- 2.Hirohata M, Yoshita M, Ishida C, Ikeda SI, Tamaoka A, Kuzuhara S, Shoji M, Ando Y, Tokuda T, Yamada M. Clinical features of non-hypertensive lobar intracerebral hemorrhage related to cerebral amyloid angiopathy. Eur J Neurol. 2010;17(6):823–9. doi: 10.1111/j.1468-1331.2009.02940.x. [DOI] [PubMed] [Google Scholar]
- 3.Jellinger KA. Alzheimer disease and cerebrovascular pathology: an update. J Neural Transm. 2002;109(5–6):813–36. doi: 10.1007/s007020200068. [DOI] [PubMed] [Google Scholar]
- 4.Rosenblum WI, Haider A. Negative correlations between parenchymal amyloid and vascular amyloid in hippocampus. Am J Pathol. 1988;130(3):532–6. [PMC free article] [PubMed] [Google Scholar]
- 5.Alonzo NC, Hyman BT, Rebeck GW, Greenberg SM. Progression of cerebral amyloid angiopathy: accumulation of amyloid-beta40 in affected vessels. J Neuropathol Exp Neurol. 1998;57(4):353–9. doi: 10.1097/00005072-199804000-00008. [DOI] [PubMed] [Google Scholar]
- 6.Fryer JD, Simmons K, Parsadanian M, Bales KR, Paul SM, Sullivan PM, Holtzman DM. Human apolipoprotein E4 alters the amyloid-beta 40:42 ratio and promotes the formation of cerebral amyloid angiopathy in an amyloid precursor protein transgenic model. J Neurosci. 2005;25(11):2803–10. doi: 10.1523/JNEUROSCI.5170-04.2005. [DOI] [PMC free article] [PubMed] [Google Scholar]
- 7.Wilcock DM, Colton CA. Immunotherapy, vascular pathology, and microhemorrhages in transgenic mice. CNS Neurol Disord Drug Targets. 2009;8(1):50–64. doi: 10.2174/187152709787601858. [DOI] [PMC free article] [PubMed] [Google Scholar]
- 8.Herzig MC, Van Nostrand WE, Jucker M. Mechanism of cerebral beta-amyloid angiopathy: murine and cellular models. Brain Pathol. 2006;16(1):40–54. doi: 10.1111/j.1750-3639.2006.tb00560.x. [DOI] [PMC free article] [PubMed] [Google Scholar]
- 9.De Jonghe C, Esselens C, Kumar-Singh S, Craessaerts K, Serneels S, Checler F, Annaert W, Van Broeckhoven C, De Strooper B. Pathogenic APP mutations near the gamma-secretase cleavage site differentially affect Abeta secretion and APP C-terminal fragment stability. Hum Mol Genet. 2001;10(16):1665–71. doi: 10.1093/hmg/10.16.1665. [DOI] [PubMed] [Google Scholar]
- 10.Suzuki N, Cheung TT, Cai XD, Odaka A, Otvos L, Jr, Eckman C, Golde TE, Younkin SG. An increased percentage of long amyloid beta protein secreted by familial amyloid beta protein precursor (beta APP717) mutants. Science. 1994;264(5163):1336–40. doi: 10.1126/science.8191290. [DOI] [PubMed] [Google Scholar]
- 11.Murrell J, Farlow M, Ghetti B, Benson MD. A mutation in the amyloid precursor protein associated with hereditary Alzheimer’s disease. Science. 1991;254(5028):97–9. doi: 10.1126/science.1925564. [DOI] [PubMed] [Google Scholar]
- 12.Herzig MC, Winkler DT, Burgermeister P, Pfeifer M, Kohler E, Schmidt SD, Danner S, Abramowski D, Sturchler-Pierrat C, Burki K, van Duinen SG, Maat-Schieman ML, Staufenbiel M, Mathews PM, Jucker M. Abeta is targeted to the vasculature in a mouse model of hereditary cerebral hemorrhage with amyloidosis. Nat Neurosci. 2004;7(9):954–60. doi: 10.1038/nn1302. [DOI] [PubMed] [Google Scholar]
- 13.Bugiani O, Giaccone G, Rossi G, Mangieri M, Capobianco R, Morbin M, Mazzoleni G, Cupidi C, Marcon G, Giovagnoli A, Bizzi A, Di Fede G, Puoti G, Carella F, Salmaggi A, Romorini A, Patruno GM, Magoni M, Padovani A, Tagliavini F. Hereditary cerebral hemorrhage with amyloidosis associated with the E693K mutation of APP. Arch Neurol. 2010;67(8):987–95. doi: 10.1001/archneurol.2010.178. [DOI] [PubMed] [Google Scholar]
- 14.Pezzini A, Del Zotto E, Volonghi I, Giossi A, Costa P, Padovani A. Cerebral amyloid angiopathy: a common cause of cerebral hemorrhage. Curr Med Chem. 2009;16(20):2498–513. doi: 10.2174/092986709788682047. [DOI] [PubMed] [Google Scholar]
- 15.Mullan M, Crawford F, Axelman K, Houlden H, Lilius L, Winblad B, Lannfelt L. A pathogenic mutation for probable Alzheimer’s disease in the APP gene at the N-terminus of beta-amyloid. Nat Genet. 1992;1(5):345–7. doi: 10.1038/ng0892-345. [DOI] [PubMed] [Google Scholar]
- 16.Kumar-Singh S, Cras P, Wang R, Kros JM, van Swieten J, Lubke U, Ceuterick C, Serneels S, Vennekens K, Timmermans JP, Van Marck E, Martin JJ, van Duijn CM, Van Broeckhoven C. Dense-core senile plaques in the Flemish variant of Alzheimer’s disease are vasocentric. Am J Pathol. 2002;161(2):507–20. doi: 10.1016/S0002-9440(10)64207-1. [DOI] [PMC free article] [PubMed] [Google Scholar]
- 17.Bornebroek M, De Jonghe C, Haan J, Kumar-Singh S, Younkin S, Roos R, Van Broeckhoven C. Hereditary cerebral hemorrhage with amyloidosis Dutch type (AbetaPP 693): decreased plasma amyloid-beta 42 concentration. Neurobiol Dis. 2003;14(3):619–23. doi: 10.1016/j.nbd.2003.08.019. [DOI] [PubMed] [Google Scholar]
- 18.Kandimalla KK, Scott OG, Fulzele S, Davidson MW, Poduslo JF. Mechanism of neuronal versus endothelial cell uptake of Alzheimer’s disease amyloid beta protein. PLoS One. 2009;4(2):e4627. doi: 10.1371/journal.pone.0004627. [DOI] [PMC free article] [PubMed] [Google Scholar]
- 19.Kandimalla KK, Curran GL, Holasek SS, Gilles EJ, Wengenack TM, Poduslo JF. Pharmacokinetic analysis of the blood-brain barrier transport of 125I-amyloid beta protein 40 in wild-type and Alzheimer’s disease transgenic mice (APP, PS1) and its implications for amyloid plaque formation. J Pharmacol Exp Ther. 2005;313(3):1370–8. doi: 10.1124/jpet.104.081901. [DOI] [PubMed] [Google Scholar]
- 20.McGowan E, Pickford F, Kim J, Onstead L, Eriksen J, Yu C, Skipper L, Murphy MP, Beard J, Das P, Jansen K, Delucia M, Lin WL, Dolios G, Wang R, Eckman CB, Dickson DW, Hutton M, Hardy J, Golde T. Abeta42 is essential for parenchymal and vascular amyloid deposition in mice. Neuron. 2005;47(2):191–9. doi: 10.1016/j.neuron.2005.06.030. [DOI] [PMC free article] [PubMed] [Google Scholar]
- 21.Tanzi RE, Moir RD, Wagner SL. Clearance of Alzheimer’s Abeta peptide: the many roads to perdition. Neuron. 2004;43(5):605–8. doi: 10.1016/j.neuron.2004.08.024. [DOI] [PubMed] [Google Scholar]
- 22.Vogelgesang S, Warzok RW, Cascorbi I, Kunert-Keil C, Schroeder E, Kroemer HK, Siegmund W, Walker LC, Pahnke J. The role of P-glycoprotein in cerebral amyloid angiopathy; implications for the early pathogenesis of Alzheimer’s disease. Curr Alzheimer Res. 2004;1(2):121–5. doi: 10.2174/1567205043332225. [DOI] [PMC free article] [PubMed] [Google Scholar]
- 23.Bading JR, Yamada S, Mackic JB, Kirkman L, Miller C, Calero M, Ghiso J, Frangione B, Zlokovic BV. Brain clearance of Alzheimer’s amyloid-beta40 in the squirrel monkey: a SPECT study in a primate model of cerebral amyloid angiopathy. J Drug Target. 2002;10(4):359–68. doi: 10.1080/10611860290031831. [DOI] [PubMed] [Google Scholar]
- 24.Mackic JB, Weiss MH, Miao W, Kirkman E, Ghiso J, Calero M, Bading J, Frangione B, Zlokovic BV. Cerebrovascular accumulation and increased blood-brain barrier permeability to circulating Alzheimer’s amyloid beta peptide in aged squirrel monkey with cerebral amyloid angiopathy. J Neurochem. 1998;70(1):210–5. doi: 10.1046/j.1471-4159.1998.70010210.x. [DOI] [PubMed] [Google Scholar]
- 25.Davis J, Xu F, Miao J, Previti ML, Romanov G, Ziegler K, Van Nostrand WE. Deficient cerebral clearance of vasculotropic mutant Dutch/Iowa Double A beta in human A betaPP transgenic mice. Neurobiol Aging. 2006;27(7):946–54. doi: 10.1016/j.neurobiolaging.2005.05.031. [DOI] [PubMed] [Google Scholar]
- 26.Tomlin SG. Vesicular transport across endothelial cells. Biochim Biophys Acta. 1969;183(3):559–64. doi: 10.1016/0005-2736(69)90169-2. [DOI] [PubMed] [Google Scholar]
- 27.Shea SM, Karnovsky MJ, Bossert WH. Vesicular transport across endothelium: Simulation of a diffusion model. Journal of Theoretical Biology. 1969;24(1):30–42. doi: 10.1016/s0022-5193(69)80004-4. [DOI] [PubMed] [Google Scholar]
- 28.Deane R, Sagare A, Hamm K, Parisi M, Lane S, Finn MB, Holtzman DM, Zlokovic BV. apoE isoform-specific disruption of amyloid beta peptide clearance from mouse brain. J Clin Invest. 2008;118(12):4002–13. doi: 10.1172/JCI36663. [DOI] [PMC free article] [PubMed] [Google Scholar]
- 29.Attems J, Yamaguchi H, Saido TC, Thal DR. Capillary CAA and perivascular Abeta-deposition: two distinct features of Alzheimer’s disease pathology. J Neurol Sci. 2010;299(1–2):155–62. doi: 10.1016/j.jns.2010.08.030. [DOI] [PubMed] [Google Scholar]
Associated Data
This section collects any data citations, data availability statements, or supplementary materials included in this article.