

Abstract
Objective
Genetic factors account for 40%–70% of the variation in body mass index (BMI). We sought to test whether moderate intensity physical activity affected parent–offspring relationships for body mass index and regional adiposity in 26,587 female and 6428 male walkers surveyed in the United States in 2000.
Methods
Survey questionnaires provided self-reported usual walking distance, height, weight, and waist circumference, and mother’s and father’s adiposity (1=lean, 2=normal, 3=overweight, and 4=very overweight). Regression analyses were used to test whether the contribution of parental adiposities to the walkers’ body mass indexes and waist circumferences diminished with walking.
Results
In the most sedentary group (walking <1.5 km/d), average parental adiposity was a significant determinant of the walkers’ body mass indexes and waist circumferences (female: P<10−15; male: P<10−13). Greater walking distance significantly diminished the effect of average parents’ adiposity on the walkers’ body mass indexes (female: P<10−10; male P=0.003) and waist circumferences (female: P<10−6; male P=0.01). Compared to the most sedentary female walkers, the effect of parental adiposity was reduced 36% for body mass indexes and 41% for waist circumferences (corresponding reductions in men were 36% and 46%, respectively).
Conclusion
These results suggest that moderate intensity physical activity attenuates inheritance of both total and regional adiposity in a dose-dependent manner.
Introduction
Physical activity has an important role in reducing the risk for obesity and in sustaining weight loss (National Institutes of Health, 1998). Less is known about its ability to mitigate other obesity risk factors. There is a large inherited component to body weight, accounting for 40%–70% of the population variation in body mass index (BMI) (Maes et al., 1997; Stunkard et al., 1986). Several observations suggest that physical activity may mitigate the inheritance of body weight (Andreasen et al., 2008; Heitmann et al., 1997; Karnehed et al., 2006; McCaffery et al., 2009; Mustelin et al., 2009; Rampersaud et al., 2008; Scott et al., 2010; Silventoinen et al., 2009; Vimaleswaran et al., 2009; Waller et al., 2008; Williams et al., 2005), but these observations involve vigorous physical activities or composite physical activity measures that include vigorous physical activity as part of the total. Walking is a moderate intensity activity, which means that it expends between three- and six-fold the energy expenditure of sitting at rest (i.e., 3–6 metabolic equivalents or METs, where 1 MET=3.5 O2 ml·min−1·kg−1), as opposed to vigorous exercise, which expends > 6 METs (Haskell et al, 2007). Walking is also the most common physical activity performed by Americans (Eyler et al., 2003). The dose-response relationship between BMI-inheritance and moderate-intensity physical activity per se has not been previously described.
The National Walkers’ Health Study was created in 2000 expressly for the purpose of sampling a broad range of moderate-intensity physical activity (specifically walking, Williams, 2004; Williams, 2005; Williams, 2008b). Nearly half of its participants fall within the highest walking quintile of the Nurses’ Health Study (Manson et al., 1999) and the Women’s Health Initiative (Manson et al., 2002). The purpose of this paper is to test whether walking mitigates the relationship of parental adiposity to offspring’s BMI and regional adiposity. Included in these analyses are the relationships of parental adiposity to different percentiles of the walkers’ BMI distributions. This was done because increases in BMI over the last several decades have not been evenly distributed throughout the BMI distribution, but rather have been proportionately greater for the higher BMI population percentiles (Keith et al., 2006). The results are consistent with the hypothesis that walking may mitigate the inherited risk for excess body weight.
Methods and materials
A two-page mailed questionnaire, sent to subscribers of a walking magazine and to participants of walking events, solicited information on demographics (age, race, education), walking history (age when began walking at least 12 mi/wk, current average weekly mileage), weight history (greatest and current weight; weight when started walking; least weight as a walker; body circumferences of the chest, waist, and hips; bra cup size), diet (vegetarianism and the current weekly intakes of alcohol, red meat, fish, fruit, vitamin C, vitamin E, and aspirin), cigarette use, history of heart attacks and cancer, and medications for blood pressure, thyroid, cholesterol, or diabetes (Williams, 2005; Williams, 2008a; Williams, 2008b). Walking distances were reported in miles per week, body circumferences in inches, and body weights in pounds. These values were converted to kilometers per day, centimeters, and kilograms, respectively. A four point scale of parental adiposity was assessed from the question: “Would you describe your mother (father) as: 1) lean, 2) average, 3) overweight, 4) very overweight, 5) unknown?”
The walkers’ BMIs were calculated as the weight in kilograms divided by height in meters squared. Self-reported body circumferences of the waist, hip, and chest were in response to the question “Please provide, to the best of your ability, your body circumferences in inches.” without further instruction. The relationships between circumferences and walking distances are expected to be weakened by different locations of where waist, hip and chest circumferences were measured. However, unless the perceived location varied systematically in relation to walking distance, the subjectivity is unlikely to produce the relationships reported in the tables and figures. Self-reported height and weight from the questionnaire have been found previously to correlate strongly with their clinic measurements (r=0.96 for both, Williams, 2004). Self-reported waist circumferences are somewhat less precise as indicated by their correlations with self-reported circumferences on a second questionnaire (r=0.84) and with their clinic measurements (r=0.68, Williams, 2004). Self-reported chest circumferences also demonstrate strong test–retest correlations across repeated questionnaires (r=0.93) and somewhat weaker correlations relative to their clinic measurement (r=0.77, Williams, 2004). The study protocol was reviewed by the University of California Berkeley committee for the protection of human subjects, and all subjects provided a signed statement of informed consent.
Statistical analyses
Results are presented as mean (SE) or slopes (SE) except where noted. With the exception of the sample description of Table 1, all analyses were adjusted for age (age and age2), education, and alcohol intake. Multiple regression analyses were used to test whether the mothers’ and fathers’ adiposities affected the walkers’ BMIs and body circumferences. Specifically, we tested whether the coefficient for the interaction between parents’ adiposity × distance walked differed significantly from zero in a model that also included the separate effects of the parents’ adiposity and walking distance. In these analyses parental adiposity was defined as the mother’s adiposity alone, the father’s adiposity alone, and the average of the mother’s and father’s adiposities. We also divided the sample into walking increments of 0–1.5, 1.5–3, 3–4.5, and ≥4.5 km/d and calculated the regression coefficients for parental adiposity (mother, father, average) separately within each stratum. Regression analysis was also used to test for significant differences in the parent–offspring slope between walkers averaging <1.5 vs. ≥1.5 km/d, ≥3 vs. 1.5–3 km/d, and ≥4.5 vs. 3–4.5 km/d.
Table 1.
Characteristics of walkers surveyed in the United States in 2000 by average distance walked per day.
| <1.5 km/day | 1.5–3 km/day | 3–4.5 km/day | ≥4.5 km/d | Significance | |
|---|---|---|---|---|---|
| Female walkers | |||||
| Sample | 7,705 | 8,137 | 4,976 | 5,769 | |
| Age (years) | 50.99±14.28 | 50.29±12.89 | 50.43±12.59 | 49.49±12.05 | <10−10 |
| Education (years) | 15.10±2.53 | 15.31±2.49 | 15.17±2.49 | 14.99±2.48 | <10−5 |
| Alcohol (g/wk) | 30.58±65.33 | 39.02±68.82 | 40.51±70.38 | 42.36±80.94 | <10−15 |
| Appearance Mother (1,2,3,4) | 2.37±0.86 | 2.36±0.85 | 2.34±0.84 | 2.33±0.84 | 0.002 |
| Appearance Father (1,2,3,4) | 2.12±0.82 | 2.09±0.82 | 2.12±0.81 | 2.10±0.82 | 0.26 |
| BMI (kg/m2) | 27.59±6.43 | 25.56±5.05 | 24.74±4.48 | 24.24±4.50 | <10−15 |
| Waist circumference (cm) | 83.06±13.83 | 78.54±11.72 | 76.87±10.68 | 75.13±10.38 | <10−15 |
| Chest circumference (cm) | 96.76±10.28 | 94.10±8.56 | 92.93±8.00 | 92.17±7.46 | <10−15 |
| Hip circumference (cm) | 104.02±13.38 | 100.32±10.82 | 98.96±9.56 | 97.41±9.34 | <10−15 |
| Male walkers | |||||
| Sample | 1,864 | 1,861 | 1,182 | 1,521 | |
| Age (years) | 61.38±14.50 | 61.48±12.97 | 61.53±11.89 | 60.43±12.36 | 0.006 |
| Education (years) | 16.16±2.79 | 16.21±2.69 | 16.18±2.65 | 15.88±2.71 | 0.0004 |
| Alcohol (g/wk) | 64.00±106.39 | 70.86±107.70 | 74.51±112.72 | 77.17±123.50 | 0.0005 |
| Appearance Mother (1,2,3,4) | 2.27±0.82 | 2.22±0.80 | 2.23±0.80 | 2.22±0.81 | 0.55 |
| Appearance Father (1,2,3,4) | 2.10±0.78 | 2.09±0.76 | 2.10±0.76 | 2.08±0.78 | 0.77 |
| BMI (kg/m2) | 27.96±5.26 | 26.95±4.46 | 26.86±4.25 | 26.44±4.20 | <10−15 |
| Waist circumference (cm) | 96.39±12.11 | 94.65±10.27 | 93.36±9.33 | 92.40±9.85 | <10−15 |
| Chest circumference (cm) | 108.61±11.27 | 107.62±10.25 | 107.09±9.64 | 106.95±10.06 | <10−5 |
Data on waist circumference was provided by 80.6% of female and 83.3% of male walkers, on chest circumference by 79.2% of female and 73.2 of male walkers, and hip circumference by 78.9% of female walkers.
Finally, we tested whether the slope relating BMI to parental adiposity was the same throughout the BMI distribution. Our approach (Williams, 2004; Williams, 2005; Williams, 2008b) for estimating the slope for the kth BMI percentile (or other dependent variable) vs. parental adiposity (or other independent variable) involved partitioning the age-, education-, and alcohol-adjusted parental adiposity into deciles and determining the age-, education-, and alcohol-adjusted BMI percentiles of the walker within each partition. We determined the mean age-, education, and alcohol-adjusted parental adiposity within each partition, to form ten bivariate observations consisting of the kth BMI percentile of the walker and mean parental adiposity within each partition. Simple linear regression was then used to calculate the slope of the walkers’ kth BMI percentile vs. parental adiposity across the 10 bivariate observations. Robust estimates of the regression coefficients, their standard errors, and their significance levels were obtained by bootstrap resampling (Efron, 1982). The approach should yield the approximately same expected values as quantile regression (Koenker, 2005).
Results
There were 26,587 women and 6428 men with complete data on age, education, usual walking distance, BMI, and alcohol intake who did not smoke and who provided the adiposities of their two parents. Table 1 displays their characteristics by distance walked per day. The higher-mileage walkers were slightly younger, slightly less educated, and drank somewhat more. They were also significantly leaner and, if female, perceived their mothers to be slightly less overweight than lower-mileage walkers. The walkers reported that 16.4% of their mothers and 23.5% of their fathers were lean, 42.3% and 47.4% were average, respectively, 33.4% and 24.5% were overweight, respectively, and 8.0% and 4.6% were very overweight, respectively. Fig. 1 presents the quantile–quantile plot for age-, education-, and alcohol-adjusted female BMI for the 1.5–3, 3–4.5, and >4.5 km/d groups relative to the ≤1.5 km/d group. If their BMI distributions were the same, then the graphs would lie on the diagonal. The graphs lie further below the diagonal with increasing walking distance, showing that the higher mileage walkers tend to be leaner for all percentiles of their BMI distribution. For example, the 50th BMI percentile of the lowest mileage walkers (i.e., <1.5 km/d group) represents the 75th percentile of the highest mileage walkers (the ≥4.5 km/d group).
Figure 1.
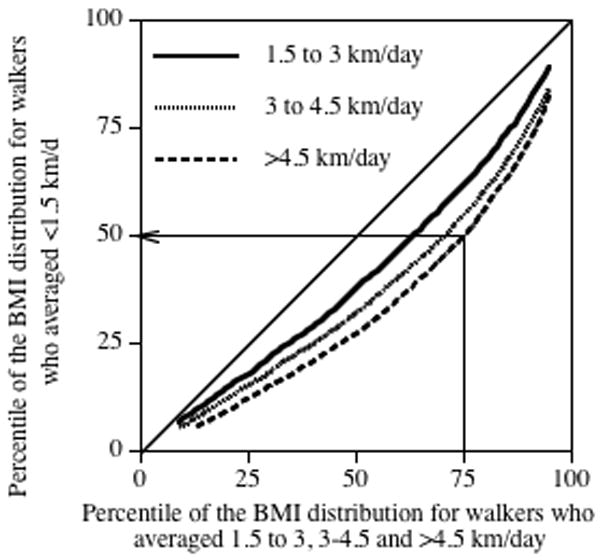
Quantile-Quantile (Q-Q) plot comparing the BMI distributions of the female walkers who averaged 1.5–3.0, 3.0–4.5, and ≥4.5 km/d with those who averaged <1.5 km/day. For example, the arrow shows that the 75th percentile of the most active female walkers corresponds to only the 50th percentile of the least active female walkers. Data adjusted for age, education, and alcohol intake.
Separate contributions of the mother and father to the walkers’ adiposities by walking distance
Table 2 presents the regression slopes for the walkers’ BMIs and body circumferences (dependent variable) vs. their mothers’ and fathers’ adiposities (independent variable) adjusted for the walker’s age, education, and reported alcohol intake. Among walkers averaging <1.5 km/d, BMIs and circumferences of the waist, hip and chest were all strongly related to their mothers’ and fathers’ adiposities. The contribution of the parents’ adiposities to the female walkers’ BMIs and waist circumferences diminished significantly with average walking distance, e.g., about one-third to one-half less for those averaging ≥4.5 km/d vis-à-vis <1.5 km/d. A similar trend existed for male walkers but achieved less significance for the decline, presumably due to their much smaller sample size.
Table 2.
Regression slopes for body mass index (BMI) and body circumferences vs. reported obesity status of the subject’s mother (kg/m2 or cm per increment) and father (kg/m2 or cm per increment) adjusted for age, education, and alcohol intake and stratified by walking distance for walkers surveyed in the United States in 2000.
| Dependent variable | ||||
|---|---|---|---|---|
| BMI (kg/m2) | Waist circumference (cm) | Chest circumference (cm) | Hip circumference (cm) | |
| Mother’s contribution | ||||
| Female walkers | ||||
| <1.5 km/d | 0.98±0.08§ | 1.82±0.21§ | 1.23±0.15§ | 2.25±0.20§ |
| 1.5–3 km/d | 0.78±0.06§ | 1.47±0.17§ | 0.99±0.12§ | 1.46±0.16§ |
| 3–4.5 km/d | 0.57±0.08§ | 0.95±0.20§ | 0.52±0.15‡ | 1.07±0.18§ |
| ≥4.5 km/d | 0.58±0.07§ | 1.04±0.18§ | 0.52±0.13§ | 1.16±0.16§ |
| Interaction | P<10−7 | P<10−5 | P<10−5 | P<10−5 |
| Male walkers | ||||
| <1.5 km/d | 0.91±0.14§ | 2.14±0.37§ | 1.96±0.37§ | |
| 1.5–3 km/d | 0.88±0.12§ | 1.80±0.32§ | 1.56±0.33§ | |
| 3–4.5 km/d | 0.60±0.15§ | 1.01±0.37† | 1.80±0.39§ | |
| ≥4.5 km/d | 0.53±0.13§ | 0.84±0.33* | 0.89±0.36† | |
| Interaction | P=0.02 | P=0.02 | P=0.09 | |
| Father’s contribution | ||||
| Female walkers | ||||
| <1.5 km/d | 1.04±0.09§ | 1.62±0.22§ | 1.25±0.16§ | 1.84±0.21§ |
| 1.5–3 km/d | 0.82±0.07§ | 1.46±0.18§ | 1.18±0.13§ | 1.59±0.16§ |
| 3–4.5 km/d | 0.72±0.08§ | 1.20±0.21§ | 0.82±0.16§ | 1.32±0.19§ |
| ≥4.5 km/d | 0.72±0.07§ | 1.00±0.19§ | 0.60±0.14§ | 1.16±0.17§ |
| Interaction | P<0.0001 | P=0.002 | P=0.0002 | P=0.0002 |
| Male walkers | ||||
| <1.5 km/d | 0.78±0.15§ | 1.88±0.39§ | 1.55±0.38§ | |
| 1.5–3 km/d | 0.63±0.13§ | 1.40±0.34§ | 1.19±0.35‡ | |
| 3–4.5 km/d | 0.31±0.16* | 1.05±0.39§ | 1.20±0.43† | |
| ≥4.5 km/d | 0.60±0.13§ | 1.47±0.34§ | 1.34±0.37‡ | |
| Interaction | P=0.07 | P=0.36 | P=0.71 | |
Adjusted for age, education, and alcohol intake. Significance levels coded:
P<0.05,
P<0.01,
P<0.001,
P<0.0001.
Joint contributions of the mother and father to the walkers’ adiposity by walking distance
Multiple regression analyses (Table 3) provided no evidence of the mother or father having a greater influence on the walkers’ BMIs (male walker: P=0.10; female walker: P=0.10 for difference) or circumferences of the waist (male walker: P=0.85; female walker: P=0.78 for difference), chest (male walker: P=0.37; female walker: P=0.17 for difference) or hip (female walker: P=0.68 for difference); therefore, the parents’ adiposities were combined as a simple average to produce the bar graphs of Figs. 2 and 3. The coefficients were normalized so that the average parental contribution to the least active walking group (i.e. <1.5 km/d) was one. The coefficients for the other walking distances describe the degree that exercise reduces the parental contribution to the walkers’ BMIs and body circumferences. Fig. 2 shows that the BMI coefficients for the other walking groups are all less than one, e.g., the parental contribution to female walkers’ BMIs was reduced by 19% by walking 1.5–3.0 km/d, 34% by walking 3.0–4.5 km/d, and 36% by walking >4.5 km/d. More detailed comparisons (not displayed) showed that the parental contributions to the walkers’ BMI were significantly reduced in those who walked ≥1.5 vs. <1.5 km/d (females: P<10−15; males: P<10−5) and for females who walked >3 vs. 1.5–3 km/d (P=0.0008).
Table 3.
Multivariate regression to determine the linear combinations of reported obesity of the mother and father that best predicts body mass index and circumferences in walkers who averaged <1.5 km/d.
| Slopes ±SE | ||
|---|---|---|
| Mother’s contribution | Father’s contribution | |
| Female runners | ||
| BMI (kg/m2) | 0.86±0.08§ | 0.37±0.06§ |
| Waist circumference (cm) | 1.65±0.21§ | 1.40±0.22§ |
| Chest circumference (cm) | 1.09±0.15§ | 1.11±0.16§ |
| Hip circumference (cm) | 2.06±0.20§ | 1.57±0.21§ |
| Male runners | ||
| BMI (kg/m2) | 0.87±0.14§ | 0.93±0.09§ |
| Waist circumference (cm) | 2.05±0.37§ | 1.77±0.39§ |
| Chest circumference (cm) | 1.87±0.37§ | 1.43±0.38‡ |
Adjusted for age, education, and alcohol intake. Significance levels coded:
P<0.05,
P<0.01,
P<0.001,
P<0.0001
Figure 2.
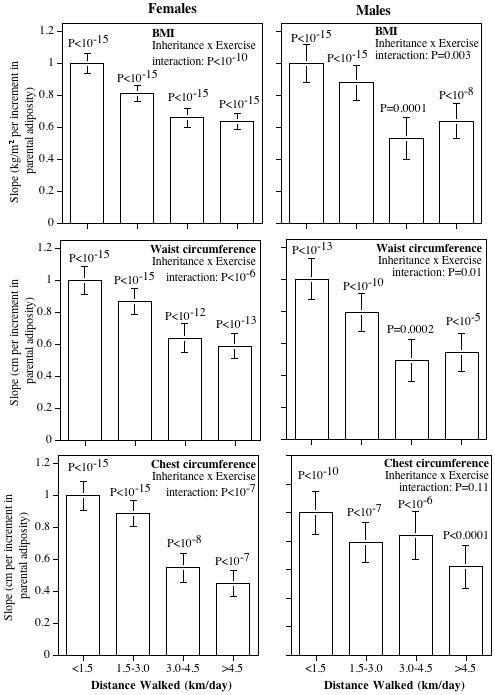
Contribution of the average parental adiposity to the BMI and waist and chest circumferences of walkers by average daily km walked. Slopes normalized so that the least active walking group had a slope of one. Probabilities above the bars are the significances of the parental contributions within each of the mileage groups, and the probability for the “inheritance by exercise” interaction is whether the parental contribution diminished significantly with increased distance.
Figure 3.
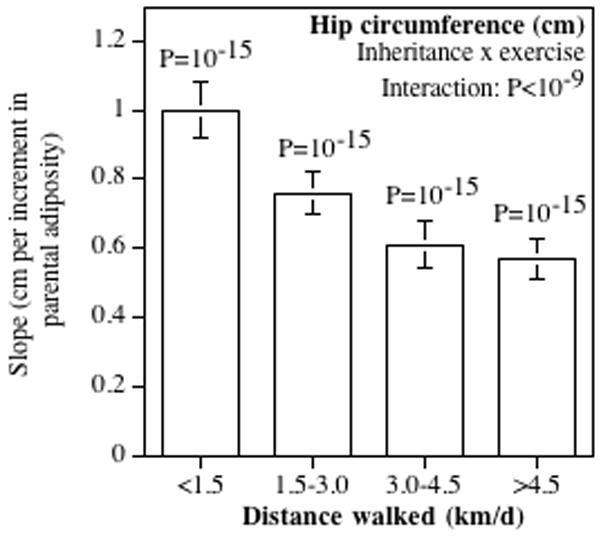
Contribution of the average parental adiposity to female hip circumferences by average km/day walked. Slopes normalized so that the least active walking group had a slope of one. Probabilities above the bars are the significances of the parental contributions within each mileage group, and the probability for the “inheritance by exercise” interaction is whether the parental contribution diminished significantly with increased distance.
Figs. 2 and 3 also suggest that exercise attenuated the parental contribution to regional adiposity in a dose-dependent manner for both male and female offspring. Specifically, walking decreased the parental contribution to the walkers’ waist circumferences in both women (P<10−6) and men (P=0.01) and to chest and hip circumferences in women (P<10−7 and <10−9 respectively). Detained comparisons (not displayed) showed there was a significantly weaker parental contribution at ≥1.5 than <1.5 km/d for waist circumference (females: P<10−15; males: P=0.003), chest circumference (females: P<10−15; males: P=0.03), and hip circumference (females: P<10−15), and a significantly weaker parental contribution at >3.0 compared to 1.5–3.0 km/d for waist circumference (females: P=0.01; males: P=0.05) and female chest circumference (P=0.003).
Ruling out self-selection
To test whether self-selection explained the weaker parental contribution to high-mileage walkers, the analyses of Fig. 2 were repeated using the participants’ recalled weights and body circumferences when they first started walking 12 or more miles per week (pre-exercise BMI). Fig. 4 shows that the parental contribution to pre- exercise BMI was strongly significant for both male and female walkers (P<10−15). In contrast to the highly significant interaction terms of Fig. 2, the parental contribution to walkers’ pre-exercise BMI was unaffected by current walking distance in both women (P=0.56) and men (P=0.82). These analyses show that the significant interactions of Fig. 2 are not simply due to those walkers having a weakly inherited BMI choosing to walk longer distances, i.e., they are not artifacts of self-selection. Current walking distance was also not significantly related to pre-exercise circumferences of the chest (females: P=0.14; males: P=0.33), hip (female: P=0.10), and waist in males (P=0.53), but did achieve marginal significance for female pre-exercise waist circumference (P=0.03).
Figure 4.
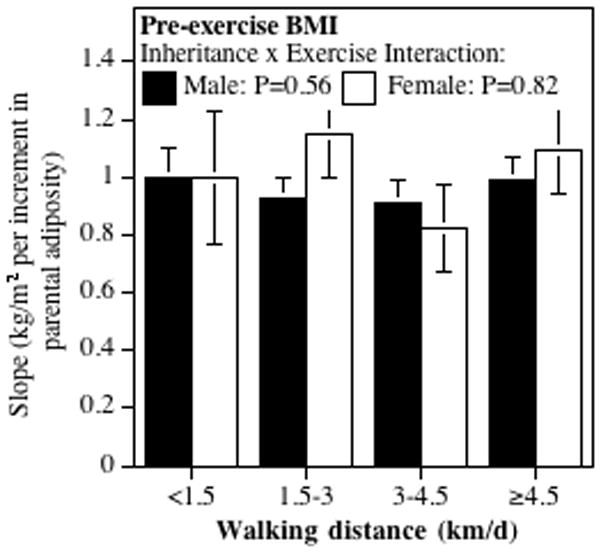
Effect of parental adiposity on walkers’ pre-exercise BMIs. Parental adiposity was strongly related to pre-exercise BMI in female walkers (P<10−15 all categories, not displayed) and male walkers who currently walked <1.5 (P=0.0001, not displayed), 1.5–3 (P<10−8), 3–4.5 (P=0.0001), and >4.5 km/d (P<10−7), but was unaffected by walking distance (males: P=0.56; females P=0.82).
Percentile regression
Percentile regression (see Methods and materials) was used to assess the relationship of parental adiposity to different percentiles of the walkers’ BMI distribution.
The results, presented in the top panel of Fig. 5, show that for the least active walkers (<1.5 km/d) a one-unit increase in average parental adiposity (e.g., from average to over weight) was associated with a (slope (SE)) 0.96 (0.10) kg/m2 increase in BMI at the 10th BMI percentile, a 1.26 (0.10) kg/m2 increase at the 25th BMI percentile, a 1.65 (0.15) kg/m2 increase at the 50th BMI percentile, a 2.18 (0.17) kg/m2 increase at the 75th BMI percentile, and a 2.58 (0.32) kg/m2 increase at the 90th percentile of the walkers’ BMI. Thus, the effect of parental adiposity is 2.5-folds greater at the 90th than the 10th percentile. The graphs also show that the other mileage groups showed similar progressively greater increases in the effect of parents’ adiposities on the higher percentiles of the walkers’ BMI distribution. The difference in slopes between the lowest and highest mileage group was slightly greater at the 90th than the 10th BMI percentile, but not significantly so. Thus, the attenuating effect of exercise on the inherited risk for greater weight was similar throughout the BMI distribution (i.e., in both leaner and heavier individuals).
Figure 5.
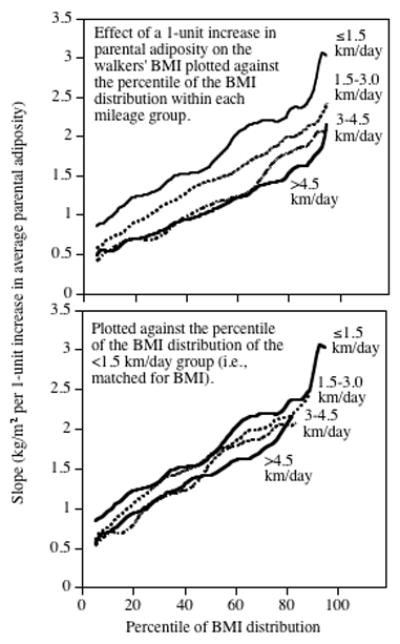
Upper panel: Graphs of the regressions slope between parental adiposity index (independent variable) and the womens’ BMI (dependent variable) at different percentiles of the BMI distribution, for women who walked <1.5, 1.5–3, 3–4.5, and >4.5 km/day. Lower panel: The same graphs re-plotted to correspond to the same BMIs using the quantile-quantile plot of Figure 1.
Table 1 shows that the higher mileage walkers had lower BMI than the lower mileage walkers. Fig. 5 shows that the effect of parental adiposity on their offspring’s BMI is substantially greater at the higher percentiles of the BMI distribution. Taken together, these two facts suggest that the diminished impact of parent adiposity on the higher mileage walkers could be a consequence of their lower BMI. Specifically, the Q–Q plot of Fig. 1 showed that the 75th percentile of the higher mileage walkers corresponds to only the 50th percentile of the lowest mileage walker group, and according to Fig. 5 the parental impact should be less because the walkers are less overweight. To adjust for greater leanness, we re-plotted the graph for the highest mileage walkers to correspond to their corresponding BMI percentile of the lowest mileage walkers using the Q–Q plot of Fig. 1 (Fig. 5, lower panel). Re-plotting the data essentially matches the two graphs to the same BMIs. On average, this eliminated 47.3% of the difference between the highest-mileage walkers and the lowest-mileage walkers, and correspondingly 52.7% of the difference in inheritance remained attributable to the difference in walking distance.
Discussion
The analyses presented in this paper showed that parental adiposity was a significant and highly reproducible risk factor for greater BMIs and circumferences of the waist, hip, and chest in the least active walkers. Despite the non-specificity of the parental adiposity question, the analyses demonstrated that parental adiposity significantly predicted the walkers’ BMIs and circumferences of the waist and chest in eight out of eight subsets, and the females’ hip circumference in four out of four subsets. Other research suggests similarities between parent’s and offsprings’ weights are primarily genetic (Maes et al. 1997, Stunkard et al. 1986) but may also involve shared environmental factors such as eating behaviors (Francis et al., 2003; Oliveria et al., 1992; Borah-Giddens and Falciglia, 1993). Perez-Pastor et al. (2009) reported that same-sex parental associations for obesity were stronger than opposite-sex parental associations. This asymmetry was not evident in our analyses, which may be due, in part, to the much older age of our sample. Nevertheless, their results illustrate the potential influence of environmental or cultural factors in the parent–offspring relationships, and the fact that cultural and environmental transmission may contribute to the associations reported here.
Table 2 and Figs. 2 and 3 suggest a strong dose–response relationship between the dose of moderately physical activity and decreased inheritance of parental adiposity. The decreased inheritance involved both total adiposity as measured by BMI and regional adiposity as measured by circumferences of the waist and chest. The analyses suggest that the dose–response relationships were similar in men and women, albeit less significant in men presumably because there were only about one-quarter as many men as women to study. The levels of physical activity associated with the attenuation of inherited weight (walking ≥1.5 km/d, corresponding to ≥8.8 MET hours per week based on their reported pace) was less than 21 MET hours per week of moderate intensity physical activity recommended by the Institute of Medicine to prevent individuals from becoming overweight or obese (Institute of Medicine, 2005). Our results are consistent with the lower body weight for women expending ≥7.5 MET hours per week vis-à-vis less active women reported by Lee et al. (2010).
Physical activity may affect body weight due to improved fat oxidation (Romijn et al., 1993) and improved coupling between energy intake and expenditure (Martins et al., 2008). Fig. 4 shows that the contribution of parental adiposity to pre-exercise BMI was unrelated to current walking, suggesting that the observed associations were unlikely to be due exclusively to walkers who fail to inherit their parents’ adiposity choosing to walk longer distances. However, self-selection based on pre-exercise BMI does contribute significantly to walking activity, particularly in women (approximately 40%, 17% in men (Williams, 2007)), and may have contributed, in part, to the results for regional adiposity.
Our analyses also suggest that our ability to manipulate genetic risk for obesity currently exceeds our understanding of the genetics themselves. Compared to <1.5 km/d, the parental contribution to walkers who exceeded 4.5 km/d was diminished by 36% for BMI and by >40% for waist circumferences in both sexes. These reductions are substantially greater than the cumulative effect of all 32 SNPs currently identified as having confirmed genome-wide significance with BMI (Speliotes et al., 2010) (accounting for 1.45% of the variance), and 14 SNPs having confirmed genome-wide significance with waist-to-hip ratio (accounting for 1.03% of the variance) (Heid et al., 2010).
We also examined the effects of walking and parental adiposity on the percentiles of the walkers’ BMI distributions. We have previously shown that the effects of walking on BMI are substantially greater at the higher than lower percentiles of the BMI distribution (Williams, 2005; Williams, 2008b). Fig. 5 shows that: 1) the effect of parental adiposity on the walkers’ BMIs was 2.5-folds greater at the higher BMI percentiles vis-à-vis the lower percentiles, and 2) the attenuating effects of walking on BMI inheritance was also greater at the higher BMI percentiles vis-à-vis the lower percentiles. The greater impact of both factors at the higher BMI percentiles is clinically significant because the health risks associated with greater BMI are not linear, but rather accelerate with increasing BMI (Williams et al., 2007; Williams and Hoffman, 2009).
Limitations
The primary limitation of these analyses is that the presumed effect of walking on the inheritance of body weight is inferred from their cross-sectional association rather than an effect of exercise training. In this regard, it should also be acknowledged that the IOM recommendations are also primarily derived from cross-sectional associations between energy metabolism and BMI (Institute of Medicine, 2005). We also acknowledge the limitation of the walkers’ subjective classifications of their parents as lean, average, overweight and very overweight. However, greater measurement error would diminish parent–offspring concordance that would not differ by walking mileage unless the misclassification was substantially greater for higher mileage than lower mileage walkers. Subjects were not excluded for pre-existing medical conditions in order to maximize inclusivity, and the findings were not noticeably altered by excluding 3.4% of the sample who were type 2 diabetics (analyses not displayed).
These analyses demonstrate an additional health benefit of moderate-intensity physical activity.
Acknowledgments
This research was supported by grant HL094717 from the National Heart, Lung, and Blood Institute and AG032004 from the Institute of Aging and was conducted at the Ernest Orlando Lawrence Berkeley National Laboratory (Department of Energy DE-AC03-76SF00098 to the University of California). The author wishes to thank Ms. Kathryn Hoffman for her help in collecting the data and reviewing the manuscript.
Footnotes
Conflict of interest Dr. Williams’ effort was supported by the aforementioned National Institutes of Health Grant. No industrial relationship or conflicts of interest to report.
References
- Andreasen CH, et al. Low physical activity accentuates the effect of the FTO rs9939609 polymorphism on body fat accumulation. Diabetes. 2008;57:95–101. doi: 10.2337/db07-0910. [DOI] [PubMed] [Google Scholar]
- Borah-Giddens J, Falciglia GA. A meta-analysis of the relationship in food preferences between parents and children. J Nutr Educ. 1993;25:102–107. [Google Scholar]
- National Institutes of Health. Clinical guidelines on the identification, evaluation, and treatment of overweight and obesity in adults: the evidence report. Obes Res Suppl. 1998;2:51S–209S. [PubMed] [Google Scholar]
- Efron B. The jackknife, the bootstrap and other resampling plans. Society for Industrial and Applied Mathematics; Philadelphia: 1982. pp. 1–92. [Google Scholar]
- Eyler AA, et al. The epidemiology of walking for physical activity in the United States. Med Sci Sports Exerc. 2003;35:1529–1536. doi: 10.1249/01.MSS.0000084622.39122.0C. [DOI] [PubMed] [Google Scholar]
- Francis LA, et al. Parental weight status and girls’ television viewing, snacking, and body mass indexes. Obes Res. 2003;11:143–151. doi: 10.1038/oby.2003.23. [DOI] [PMC free article] [PubMed] [Google Scholar]
- Haskell WL, et al. Physical activity and public health: updated recommendation for adults from the American College of Sports Medicine and the American Heart Association. Circulation. 2007;116:1081–1093. doi: 10.1161/CIRCULATIONAHA.107.185649. [DOI] [PubMed] [Google Scholar]
- Heid IM, et al. Meta-analysis identifies 13 new loci associated with waist–hip ratio and reveals sexual dimorphism in the genetic basis of fat distribution. Nat Genet. 2010;42:949–960. doi: 10.1038/ng.685. [DOI] [PMC free article] [PubMed] [Google Scholar]
- Heitmann BL, et al. Are genetic determinants of weight gain modified by leisure-time physical activity? A prospective study of Finnish twins. Am J Clin Nutr. 1997;66:672–678. doi: 10.1093/ajcn/66.3.672. [DOI] [PubMed] [Google Scholar]
- Institute of Medicine. Dietary Reference Intakes for Energy, Carbohydrate, Fiber, Fat, Fatty Acids, Cholesterol, Protein, and Amino Acids (Macronutrients) The National Academies Press; Washington DC: 2005. pp. 880–935. [Google Scholar]
- Karnehed N, et al. Physical activity, diet and gene-environment interactions in relation to body mass index and waist circumference: the Swedish young male twins study. Public Health Nutr. 2006;9:851–858. doi: 10.1017/phn2005926. [DOI] [PubMed] [Google Scholar]
- Keith SW, et al. Putative contributors to the secular increase in obesity: exploring the roads less traveled. Int J Obes Lond. 2006;30:1585–1594. doi: 10.1038/sj.ijo.0803326. [DOI] [PubMed] [Google Scholar]
- Koenker R. Quantile Regression. Cambridge University Press, Econometric Society Monographs; 2005. [Google Scholar]
- Lee IM, et al. Physical activity and weight gain prevention. JAMA. 2010;303 (24):1173–1179. doi: 10.1001/jama.2010.312. [DOI] [PMC free article] [PubMed] [Google Scholar]
- McCaffery JM, et al. Gene X environment interaction of vigorous exercise and body mass index among male Vietnam-era twins. Am J Clin Nutr. 2009;89:1011–1018. doi: 10.3945/ajcn.2008.27170. [DOI] [PMC free article] [PubMed] [Google Scholar]
- Maes HH, et al. Genetic and environmental factors in relative body weight and human adiposity. Behav Genet. 1997;27:325–351. doi: 10.1023/a:1025635913927. [DOI] [PubMed] [Google Scholar]
- Manson JE, et al. A prospective study of walking as compared with vigorous exercise in the prevention of coronary heart disease in women. N Engl J Med. 1999;341:650–658. doi: 10.1056/NEJM199908263410904. [DOI] [PubMed] [Google Scholar]
- Manson JE, et al. Walking compared with vigorous exercise for the prevention of cardiovascular events in women. N Engl J Med. 2002;347:716–725. doi: 10.1056/NEJMoa021067. [DOI] [PubMed] [Google Scholar]
- Martins C, et al. Effects of exercise and restrained eating behaviour on appetite control. Proc Nutr Soc. 2008;67:28–41. doi: 10.1017/S0029665108005995. [DOI] [PubMed] [Google Scholar]
- Mustelin L, et al. Physical activity reduces the influence of genetic effects on BMI and waist circumference: a study in young adult twins. Int J Obes. 2009;33:29–36. doi: 10.1038/ijo.2008.258. [DOI] [PubMed] [Google Scholar]
- Oliveria SA, et al. Parent–child relationships in nutrient intake: the Framing-ham children’s study. Am J Clin Nutr. 1992;56:93–98. doi: 10.1093/ajcn/56.3.593. [DOI] [PubMed] [Google Scholar]
- Perez-Pastor EM, et al. Assortative weight gain in mother-daughter and father-son pairs: an emerging source of childhood obesity. Longitudinal study of trios (EarlyBird 43) Int J Obes (Lond) 2009;33:727–35. doi: 10.1038/ijo.2009.76. [DOI] [PubMed] [Google Scholar]
- Rampersaud E, et al. Physical activity and the association of common FTO gene variants with body mass index and obesity. Arch Intern Med. 2008;168:1791–1797. doi: 10.1001/archinte.168.16.1791. [DOI] [PMC free article] [PubMed] [Google Scholar]
- Romijn JA, et al. Strenuous endurance training increases lipolysis and triglyceride-fatty acid cycling at rest. J Appl Physiol. 1993;75:108–113. doi: 10.1152/jappl.1993.75.1.108. [DOI] [PubMed] [Google Scholar]
- Scott RA, et al. FTO genotype and adiposity in children: physical activity levels influence the effect of the risk genotype in adolescent males. Eur J Hum Genet. 2010;18:1339–1343. doi: 10.1038/ejhg.2010.131. [DOI] [PMC free article] [PubMed] [Google Scholar]
- Silventoinen K, et al. Modification effects of physical activity and protein intake on heritability of body size and composition. Am J Clin Nutr. 2009;90:1096–1103. doi: 10.3945/ajcn.2009.27689. [DOI] [PMC free article] [PubMed] [Google Scholar]
- Speliotes EK, et al. Association analyses of 249,796 individuals reveal 18 new loci associated with body mass index. Nat Genet. 2010;42:937–948. doi: 10.1038/ng.686. [DOI] [PMC free article] [PubMed] [Google Scholar]
- Stunkard AJ, et al. A twin study of human obesity. JAMA. 1986;256:51–54. [PubMed] [Google Scholar]
- Vimaleswaran KS, et al. Physical activity attenuates the body mass index-increasing influence of genetic variation in the FTO gene. Am J Clin Nutr. 2009;90:425–428. doi: 10.3945/ajcn.2009.27652. [DOI] [PubMed] [Google Scholar]
- Waller K, et al. Associations between long-term physical activity, waist circumference and weight gain: a 30-year longitudinal twin study. Int J Obes Lond. 2008;32:353–356. doi: 10.1038/sj.ijo.0803692. [DOI] [PubMed] [Google Scholar]
- Williams PT. Exercise and the population distribution of body weight. Int J Obes. 2004;28:120–128. doi: 10.1038/sj.ijo.0802480. [DOI] [PubMed] [Google Scholar]
- Williams PT. Nonlinear relationships between weekly walking distance and adiposity in 27,596 women. Med Sci Sports Exerc. 2005;37:1893–1901. doi: 10.1249/01.mss.0000175860.51204.85. [DOI] [PMC free article] [PubMed] [Google Scholar]
- Williams PT. Self-selection contributes significantly to the lower adiposity of faster, longer-distanced, male and female walkers. Int J Obes Lond. 2007;31:652–662. doi: 10.1038/sj.ijo.0803457. [DOI] [PubMed] [Google Scholar]
- Williams PT. Reduced diabetic, hypertensive, and cholesterol medication use with walking. Med Sci Sports Exerc. 2008a;40:433–443. doi: 10.1249/MSS.0b013e31815f38f1. [DOI] [PMC free article] [PubMed] [Google Scholar]
- Williams PT. Association between walking distance and percentiles of body mass index in older and younger men. Br J Sports Med. 2008b;42:352–356. doi: 10.1136/bjsm.2007.041822. [DOI] [PMC free article] [PubMed] [Google Scholar]
- Williams PT, Hoffman KM. Optimal body weight for the prevention of coronary heart disease in normal-weight physically active men. Obesity. 2009;17:1428–1434. doi: 10.1038/oby.2008.680. [DOI] [PMC free article] [PubMed] [Google Scholar]
- Williams PT, et al. Behavioral versus genetic correlates of lipoproteins and adiposity in identical twins discordant for exercise. Circulation. 2005;112:350–356. doi: 10.1161/CIRCULATIONAHA.105.534578. [DOI] [PubMed] [Google Scholar]
- Williams PT, et al. Weight-related increases in hypertension, hypercholester-olemia, and diabetes risk in normal weight male and female runners. Arterioscler Thromb Vasc Biol. 2007;27:1811–1819. doi: 10.1161/ATVBAHA.107.141853. [DOI] [PubMed] [Google Scholar]