

Abstract
The distinctive planar polarity of auditory hair cells is evident in the polarized organization of the stereociliary bundle. Mutations in the core planar cell polarity gene Van Gogh-like 2 (Vangl2) result in hair cells that fail to properly orient their stereociliary bundles along the mediolateral axis of the cochlea. The severity of this phenotype is graded along the length of the cochlea, similar to the hair cell differentiation gradient, suggesting that an active refinement process corrects planar polarity phenotypes in Vangl2 knock-out (KO) mice. Because Vangl2 gene deletions are lethal, Vangl2 conditional knock-outs (CKOs) were generated to test this hypothesis. When crossed with Pax2–Cre, Vangl2 is deleted from the inner ear, yielding planar polarity phenotypes similar to Vangl2 KOs at late embryonic stages except that Vangl2 CKO mice are viable and do not have craniorachischisis like Vangl2 KOs. Quantification of planar polarity deficits through postnatal development demonstrates the activity of a Vangl2-independent refinement process that rescues the planar polarity phenotype within 10 d of birth. In contrast, the Pax2–Cre;Vangl2 CKO has profound changes in the shape and distribution of outer pillar cell and Deiters' cell phalangeal processes that are not corrected during the period of planar polarity refinement. Auditory brainstem response analyses of adult mice show a 10–15 dB shift in auditory threshold, and distortion product otoacoustic emission measurements indicate that this mild hearing deficit is of cochlear origin. Together, these data demonstrate a Vangl2-independent refinement mechanism that actively reorients auditory stereociliary bundles and reveals an unexpected role of Vangl2 during supporting cell morphogenesis.
Introduction
Auditory hair cells detect sound through the mechanical deflection of the stereociliary bundle located on their apical cell surfaces. Stereocilia are elongated microvilli arranged in bundles of two or three rows of increasing stereocilia length. Each stereocilium connects to its taller neighbor by tip links that regulate mechanotransduction channel opening. During development, the tallest stereocilia are adjacent to a single kinocilium that is displaced to one edge of the cell. Auditory hair cells are distributed between one row of inner hair cells (IHCs) and three rows of outer hair cells (OHCs) located in a sensory epithelium called the organ of Corti that spirals along the length of the cochlea. They are stimulated when the basilar membrane beneath organ of Corti vibrates in response to sound and the stereocilia are deflected by the overlying tectorial membrane. Because of the organization of tip links between stereocilia, only deflections toward taller stereocilia generate the tension required to open mechanotransduction channels (Hudspeth and Corey, 1977; Shotwell et al., 1981). As a result, there is a direct correlation between the optimal orientation of the stimulus and stereociliary bundle polarity.
The polarization of cellular structures parallel to an epithelium is called planar polarity. For hair cells, planar polarity can be described along three anatomical scales as recently reviewed for the vestibular system (Deans, 2013). In the cochlea, planar polarity is understood best at the cellular level in which it is called planar cell polarity (PCP) and entails the coordinated orientation of stereociliary bundle polarity between neighbors. Hair cell PCP is regulated by the core PCP proteins that were identified in Drosophila and includes the transmembrane protein Van Gogh, Prickle (Pk), the Frizzled (Fz) receptors, Dishevelled, and Flamingo. As best demonstrated in vertebrates for Van Gogh-like 2 (Vangl2), the coordinated orientation of stereociliary bundles is disrupted in PCP mutants, whereas stereociliary bundle polarity remains intact (Montcouquiol et al., 2003; Yin et al., 2012). Similar PCP phenotypes occur in Celsr1 (Flamingo; Curtin et al., 2003), Fz (Wang et al., 2006b), and Dishevelled mutants (Wang et al., 2006a), although the types of hair cells (IHCs vs OHCs) are not equally affected in each. This phenotypic variability may be attributable to genetic redundancy (Wang et al., 2006a,b) or reflect overlap from alternative polarity pathways as suggested for the vestibular system (Deans et al., 2007).
Planar polarity is dependent on a differentiation gradient emanating from the base of the cochlea that influences stereocilia development and the severity of PCP phenotypes. For example, in Vangl2 mutants, these phenotypes are more severe in the apical turn of the cochlea and milder in the base at late embryonic stages (Montcouquiol et al., 2003; Yin et al., 2012). One possibility is that bundle reorientation corrects the phenotype in the base and that this process could rescue the apical PCP phenotype if development continued past birth. To test this hypothesis, we generated Vangl2 conditional knock-out (CKO) mice in which Vangl2 deletion is restricted to the ear for detailed postnatal anatomical and physiological analysis.
Materials and Methods
Vangl2 gene targeting.
A gene targeting vector was assembled containing a 6 kilobase (kb) 5′ arm that was modified by inserting LoxP and BamH1 sequences into a unique Xba1 restriction endonuclease (RE) site located in the intron upstream of Vangl2 exon 2. A second LoxP sequence and a Neomyocin resistance gene (NeoR) flanked by FLP recombinase recognition target sequences (FRT) were introduced into a unique EcoR1 RE site located in the intron downstream of exon 3. The remainder of the vector consisted of a 5.1 kb 3′ homologous arm and a Diptheria toxin A-chain negative selection cassette. Mouse genomic DNA sequences used as homologous arms were amplified by PCR from DNA derived from the TC1 embryonic stem (ES) cell line using Phusion High-Fidelity polymerase (New England Biolabs), and coding sequence exons located within the homologous arms were sequenced to check for PCR-induced mutations. This targeting vector was electroporated into strain 129s6VeV mouse ES cells by the Johns Hopkins University (JHU) ES Cell Targeting Core, and, after positive selection with G418, homologous recombination was validated in surviving clones by PCR. A single ES cell line was injected into C57BL/6 blastocysts by the JHU Transgenics Core. After germ-line transmission, founders were crossed with transgenic mice ubiquitously expressing FLP recombinase (ACTB–FlpE; Rodríguez et al., 2000) to remove the FRT flanked NeoR gene. The modified Vangl2LoxP allele was validated by Southern blot analysis using conventional protocols. The position of 5′ and 3′ probe binding and BamH1 and EcoR1 REs used for Southern blotting are indicated in Figure 1A. The complementary Vangl2ΔATG knock-out (KO) allele was generated by crossing Vangl2LoxP to transgenic mice ubiquitously expressing Cre recombinase (CAG–Cre; Sakai and Miyazaki, 1997) to permanently delete exons 2 and 3 in mouse oocytes.
Figure 1.
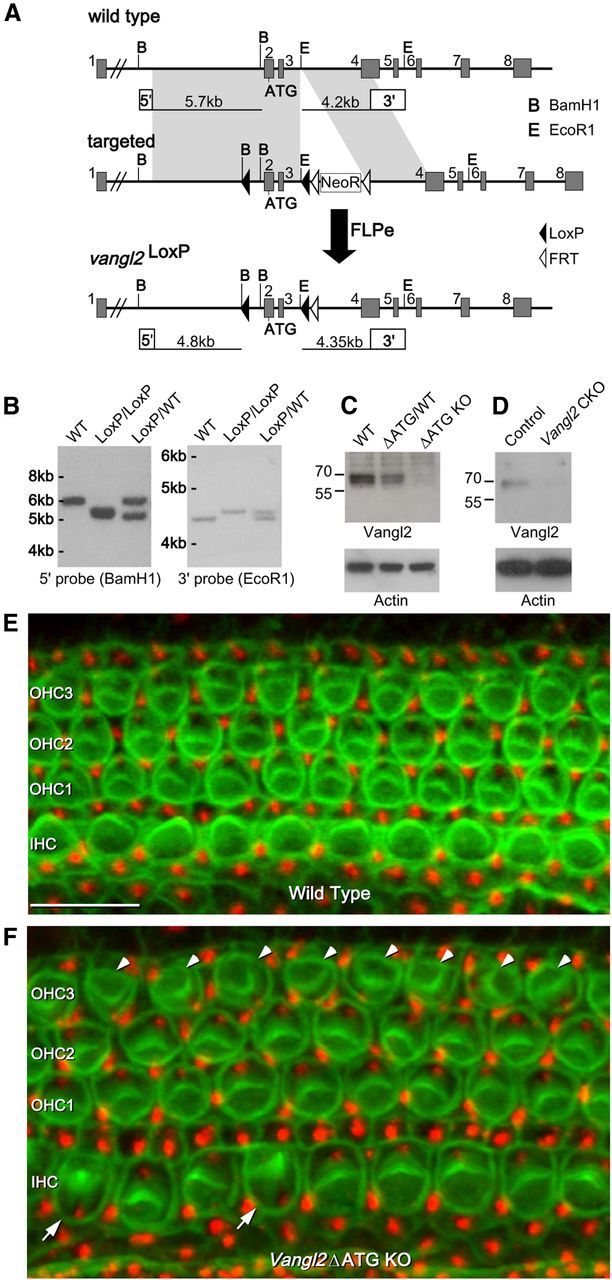
Vangl2 gene targeting for CKO and KO mouse production. A, The Vangl2 CKO allele was generated by flanking Vangl2 exons 2 and 3 with LoxP sequences. Exon 2 contains the translation initiation codon (ATG). An additional BamH1 restriction site was inserted along with the 5′ LoxP sequence to facilitate subsequent Southern blot assays. After germ-line transmission of the targeted allele, progeny were crossed to FlpE transgenic mice to excise the NeoR selection cassette yielding the Vangl2 LoxP allele. B, Southern blot analysis confirming proper recombination at the Vangl2 allele, the presence of 5′ and 3′ LoxP sites, and excision of the NeoR selection cassette. The position of BamHI and EcoRI restriction sites and the location of 5′ and 3′ probe binding sites used for Southern blots are indicated in A. C, Western blot analysis demonstrates the loss of Vangl2 protein from brain lysates derived from Vangl2ΔATG KO mice at E18.5. D, Western blot analysis demonstrates the efficiency of Cre-mediated gene deletion based on the loss of Vangl2 protein from cochlear epithelium of individual Pax2–Cre;Vangl2 CKO mice at P1. E, F, Auditory planar polarity visualized using phalloidin (green) and antibodies against the basal body protein Pericentrin (red) for hair cells located in the middle turn of the cochlea of E18.5 WT (D) and Vangl2ΔATG KO (E) embryos. In Vangl2 KOs, misoriented hair cells are found in the IHC row (arrows) and throughout the OHC3 (arrowheads). Scale bar, 10 μm.
Mouse husbandry and genotyping.
Pax2–Cre mice were provided by Andrew Groves (Baylor College of Medicine, Houston, TX), and the CAG–Cre (Sakai and Miyazaki, 1997) and ACTB–FlpE (Rodríguez et al., 2000) lines were distributed by the JHU Transgenics Core. Vangl2ΔATG and Vangl2LoxP lines were produced as described, and the Vangl2ΔTMs allele was previously reported (Yin et al., 2012). For general colony maintenance, all mouse lines were backcrossed with hybrid B6129SF1/J females (The Jackson Laboratory strain 101043). Mice were genotyped by PCR amplification using the following primer pairs: Pax2–Cre and CAG–Cre, 5′-ATTTGCCTGCATTACCGGTC-3′ and 5′-ATCAACGTTTTCTTTTCGGA-3′; Vangl2ΔATG, 5′-GCCTTCCATGGTATGGTGTC-3′ and 5′-CACCCAACAGGAGGTGAGTT-3′; Vangl2LoxP and Vangl2 wild type (WT), 5′-TCCTGTCCCTGAGTCCCAAATG-3′ and 5′-CTACTCCAGCCTGCGCCAACCTTA-3′; and Vangl2ΔTMs, 5′-ATCACCTCACTTGGCTGGAATAGATG-3′ and 5′-GAAGTTATAAGCTTTGTTCCAG-3′. All mice were maintained at JHU School of Medicine under Institutional Animal Care and Use Committee-approved guidelines.
Western blot and immunofluorescence.
Protein lysates were prepared from tissues for Western blot analysis using a lysis buffer consisting of 25 mm Tris, pH 7.4, 1% NP-40, 50 mm NaCl, and 1× protease inhibitor cocktail (P8340; Sigma). Protein lysates from microdissected cochlear epithelium collected at P1 were concentrated before electrophoresis using Spin-X UF Concentrators (Corning). After SDS-PAGE, proteins were transferred to nitrocellulose filters and blotted with standard Western blot techniques using anti-Vangl2, anti-Zeb1, or anti-Actin antibodies, followed by chemiluminescent detection using Bio-Rad ImmunStar HRP substrate. Cochlear epithelial samples containing detectable levels of the mesenchymal marker Zeb1 (Hertzano et al., 2011) were considered to be insufficiently dissected and were excluded from the analysis. Immunofluorescent labeling of auditory and vestibular hair cells was completed using inner ear tissues fixed for 2 h in a solution of 4% paraformaldehyde (PFA) prepared in 67 mm Sorenson's phosphate buffer, pH 7.4. Utricles and cochleae were subsequently removed, dissected to expose the surface of the sensory epithelia, and permeabilized and blocked using blocking solution (5% donkey serum, 1% BSA, and PBS) supplemented with Triton X-100 to 0.5%. Primary antibodies and phalloidin Alexa Fluor 488 (Invitrogen A12379) were diluted in blocking solution supplemented with Tween 20 to 0.1% and incubated with the tissue overnight at 4 °C. Tissue was washed thoroughly with PBS-T (PBS and 0.05% Tween 20), followed by incubation with species-specific, Alexa Fluor-conjugated (Invitrogen) or DyLight-conjugated (Jackson ImmunoResearch) secondary antibodies. Tissue was subsequently washed with PBS-T, mounted using Fluoro-Gel (Electron Microscopy Sciences), and imaged using a Carl Zeiss LSM710 confocal microscope. Three-dimensional (3D) reconstructions of individual Deiters' cells were generated using Zen software (Carl Zeiss) from confocal stacks. The following commercial antibodies were used in this study: Actin (mAB1501; Millipore), β1β2-tubulin (T8535; Sigma), Myosin VIIa (25-6790; Proteus Biosciences), Oncomodulin (SC7446; Santa Cruz Biotechnology), Pericentrin (PRB432C; Covance), Vangl1 (HPA025235; Sigma), Vangl2 (SC46561; Santa Cruz Biotechnology), and Zeb1 (A301–921A; Bethyl). The Pk2 antibody was a gift from M. Scott and J. Axelrod (Stanford University, Stanford, CA; Deans et al., 2007), and the Fz6 antibody was a gift from J. Nathans (JHU, Baltimore, MD; Wang et al., 2006b).
Quantification of phenotypes.
For auditory hair cell analyses, the organ of Corti was imaged by confocal microscopy at three positions located at 25, 50, and 75% the length of the cochlea relative to the base. The orientation of individual hair cells was measured using the NIH ImageJ angle measurement tool as described previously (Yin et al., 2012) and were compiled in circular histograms using Oriana circular graphing software (Kovach Computing Services). Planar polarity phenotypes were further quantified by averaging the absolute deviation of hair cell polarities from mediolateral axis of the cochlear spiral for each animal. These analyses were completed for Vangl2 CKOs and littermate controls at each of the three cochlear positions. The ratio of OHCs/supporting cells at P10–P12 was determined for the 75% planar polarity analysis fields by counting individual cells using the NIH ImageJ cell counter plug-in. Cells were labeled with phalloidin, and hair cells and supporting cells were distinguished by the presence of stereocilia and the shape of the apical surface. The supporting cell populations quantified for comparison to the OHCs were the outer pillar cells (OPCs) and three rows of Deiters' cells (n = 5 Vangl2 CKOs and 5 littermate controls).
For vestibular hair cell analyses, the utricular maculae was imaged by confocal microscopy at two positions spanning the Oncomodulin-positive striola, and images were combined based on regions of overlap. Stereociliary bundle orientation measurements were completed in three 100 × 50 μm analysis fields as described previously (Yin et al., 2012) and were compiled in circular histograms using Oriana circular graphing software (Kovach Computing Services). Planar polarity phenotypes were further quantified by averaging the mean absolute deviation of hair cell polarities from a reference axis drawn perpendicular to the line of polarity reversal (LPR). Statistical significance was calculated by a two-tailed Student's t test with unequal variance. Circular variance (CV) was calculated separately using Oriana software for the hair cells located in each analysis field from the different animals, and calculated values were presented using scatter plots binned for each variable.
3D reconstruction of intact inner ears.
Ears were processed for 3D reconstruction as described by Kopecky et al. (2012). In brief, ears were dissected from embryonic day 18.5 (E18.5) mice and fixed in 4% PFA for 48 h, followed by PBS wash and dehydration through a graded series of ethanol, and then tissues were stained using a solution of 0.0005% Rhodamine B isothiocyanate (Sigma) prepared in 100% ethanol for 2 d. The staining solution was then replaced with a 1:1 ratio of staining solution/Spalteholz solution overnight. The ears were then placed in 100% Spalteholz solution (five parts methyl salicylate, three parts benzyl benzoate) for 6–48 h until imaged. For imaging, tissue was mounted on glass slides using Spalteholz solution and sealed using vacuum grease. Images were collected using a Carl Zeiss 780 confocal microscope with Zen software. For 3D reconstruction, image stacks were segmented and rendered using Imaris imaging software.
Scanning electron microscopy.
The mice for scanning electron microscopy (SEM) were killed using CO2 and perfused with 4% PFA. Ears were then immediately removed and fixed in a combination of 2.5% glutaraldehyde and 2% PFA overnight. Ears were rinsed in 0.1 m sodium phosphate buffer, followed by decalcification with 5% EDTA for 72 h. Cochleae were then dissected from the ear and, after tectorial membrane removal, were secondarily fixed in 2% osmium tetroxide in 0.1 m phosphate buffer for 1 h. Samples were dehydrated in a graded ethanol and hexamethyldisilazane series, mounted on stubs, and coated with gold/palladium for 2 min at 10 mA. Samples were then viewed with a LEO/Carl Zeiss Field-Emission Scanning Electron Microscope located in the JHU School of Medicine Microscopy Facility using 3 MeV acceleration.
Deiters' cell dye injection.
Postnatal mice (P8–P10) were anesthetized using isoflurane and were decapitated after ensuring deep anesthesia with a foot pinch. After removal of the temporal bone, the stria vascularis and tectorial membrane was microdissected away from the apical turns of the organ of Corti. The cochlear turn was then flattened by an insect pin glued onto a coverslip and imaged under a Carl Zeiss Examiner D1 microscope using a 40× water-immersion objective and a camera with contrast enhancement (Hamamatsu C2400-62). Tissue was bathed in an extracellular solution composed of the following (in mm): 5.8 KCl, 144 NaCl, 1.3 CaCl2, 0.9 MgCl2, 0.7 NaH2PO4, 5 glucose, and 10 HEPES, pH 7.4. Deiters' cells were identified by the location of their soma under the three rows of OHCs. Sharp electrodes were pulled from 1 mm borosilicate glass capillary (WPI), reaching a resistance of 100–150 MΩ, and were filled with 10 mm Alexa Fluor 488 hydrazide (Invitrogen). The dye was injected using biphasic current (±500 pA, 5 Hz, 30 s to 1 min) until the phalangeal processes of Deiters' cells were brightly labeled. After dye injection, the cochlea was immediately fixed in 4% PFA for 2 h at 4°C. After fixation, tissues were labeled for whole-mount immunofluorescent imaging as described previously.
Auditory brainstem response and distortion product otoacoustic emission.
Animals bred for auditory brainstem response (ABR) and distortion product otoacoustic emission (DPOAE) recordings were reared in a noise-controlled vivarium to minimize the potential for noise-induced hearing loss caused by environmental sources (Lauer et al., 2009). Six to 8-week-old mice were anesthetized with a solution of ketamine (100 mg/kg) and xylazine (20 mg/kg) in 14% ethyl alcohol administered by intraperitoneal injection and maintained at 37°C on gauze-covered heating pads located inside a sound-attenuating chamber. Body temperature was monitored throughout the recording period using a rectal thermometer, whereas heart rate and breathing were monitored with an audio monitor and oscilloscope.
ABRs were recorded from the scalp with platinum subdermal needle electrodes (Grass Instruments) placed behind the left pinna and at the vertex of the skull, whereas a ground electrode was inserted into the ipsilateral hindleg muscle. Stimulus generation and ABR recordings were controlled using customized MATLAB software interfaced with Tucker Davis Technologies hardware. Stimuli were amplified using a Crown amplifier and played through a Fostex dome tweeter speaker (model FT28D). Speaker calibration was performed using a ¼-inch Brüel and Kjær free-field microphone, Tucker Davis Technologies hardware, and customize MATLAB software, and speakers were positioned 25 cm from the vertex of the skull and aligned with the left–right axis of the animal. Sound stimuli were amplified using a Crown amplifier, and the recorded neuronal responses were amplified using a WPI ISO-80 biological amplifier and filtered between 30 and 3000 Hz using a Krohn-Hite bandpass filter. Responses to 100 μs clicks and 5 ms tone pips of 4, 8, 16, 24, or 32 kHz (0.5 ms rise/fall times) presented at a rate of 20–30/s were recorded for Pax2–Cre;Vangl2ΔTM/LoxP experimental or Pax2–Cre;Vangl2ΔTM/WT littermate control animals. The recording period lasted for 30 ms beginning with stimulus onset. Within this period, the ABR waveform initiated and receded within 2–10 ms of stimulus onset. ABR magnitude was determined by calculating the maximum peak-to-peak amplitude for any wave occurring within this 8 ms window. For each animal, recordings were averaged for >300 epochs at each frequency and sound pressure level. The magnitude of the baseline response was calculated by averaging the last 10 ms of each 30 ms trace. Threshold was defined as the stimulus level that produced a waveform response with magnitude >2× SD of the baseline magnitude. This value was interpolated from the input–output function relating ABR magnitude to stimulus level. Wave 1 amplitude was calculated as the difference between P1 and N2 (defined as maximum and minimum voltage, respectively, recorded in the time window 1.5–3.1 μs after stimulus onset). For Figure 11, representative ABR responses were produced by averaging the waveform responses from all animals tested (n = 8 Pax2–Cre;Vangl2 CKOs; n = 10 littermate controls). Statistical significance was calculated by a two-tailed Student's t test with unequal variance.
Figure 10.
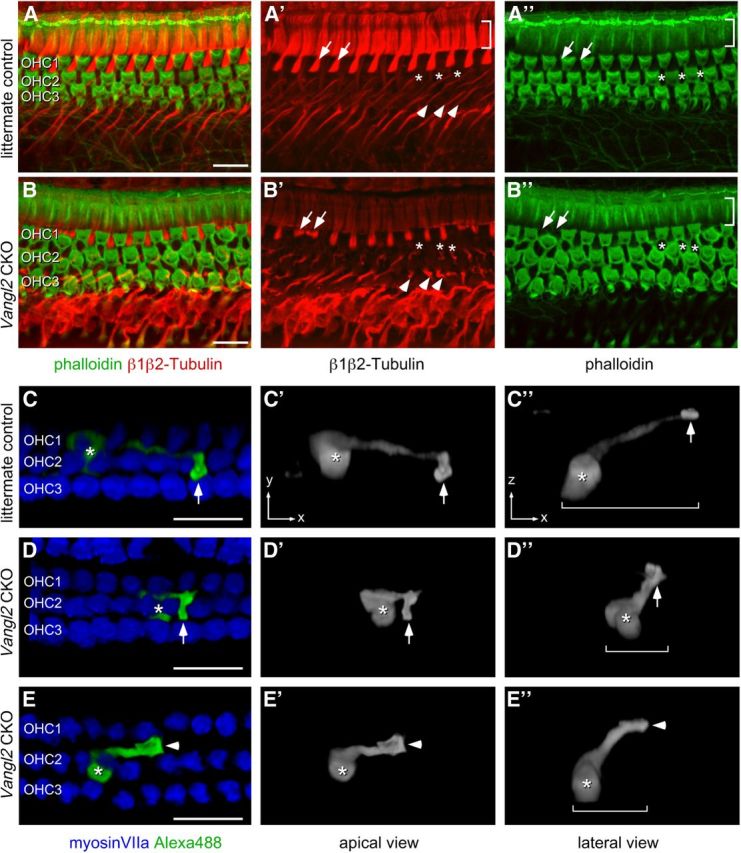
Loss of Vangl2 results in changes in organ of Corti supporting cell morphology. A, B, Phalloidin (green) and immunofluorescent β1β2-tubulin (red) labeling of P10–P12 organ of Corti in the 75% analysis field shows the distribution of hair cells and the morphology of supporting cells. The orientation of these panels has been inverted on the y-axis to highlight the orientation of supporting cells. A′, β1β2-Tubulin in control tissues marks the apical surface of IPCs (bracketed region), the apical surface of OPCs that separate hair cells in the OHC1 row (examples marked by arrows), and the phalangeal processes of Deiters' cells (examples marked by arrowheads). Asterisks mark the position of three Deiters' cells positioned between hair cells of the OHC2 row. A″, Phalloidin only labels the actin-rich apical surface of the IPCs and the hair cells. B′, In Vangl2 CKO tissues, changes in the morphology of cochlear supporting cells are evident by β1β2-tubulin labeling. This includes the displacement of some OPC processes to the medial side of OHCs (arrows highlight examples) and Deiters' cell phalangeal processes that fail to extend toward the apical turn (arrowheads highlight examples). B″, Changes in the distribution of the apical surface of supporting cells are also revealed by phalloidin labeling of cell boundaries, including the OPCs (arrowheads) and Deiters' cells (asterisks). C–E, Individual Deiters' cell morphology at P8–P10 stages in littermate control (C) and two Vangl2 CKO cochleae (D, E) visualized by intracellular injection of Alexa Fluor 488. Asterisks indicate the position of the cell body, and arrows (C, D) indicate the apical surface of the phalangeal process. In the absence of Vangl2, the phalangeal process of some Deiters' cells project directly toward the apical surface of the organ of Corti rather than laterally toward neighboring hair cells. The arrowhead in E illustrates a process that is misplaced to the medial side of the OHC. Brackets demarcate the length of the Deiters' cell process. Scale bars, 20 μm.
DPOAEs were measured from anesthetized mice using an ear insert consisting of independent conduction tubes for two Etymotic ER-2 remote speakers and a microphone (ER-10C; Etymotic). When fitted with a small rubber tip sized for a neonatal human, the probe unit fits snugly into the ear canal of an adult mouse. Accurate placement of the probe was tested by measuring the ear canal response for both speakers. Using this probe, the cochlea was stimulated with two primary frequencies (f1 and f2, where f2 > f1), and the distortion product (2f1 − f2) emitted by the cochlea was measured. Distortion products were produced using an f2/f1 ratio of 1.22 and an f2 primary frequency of 12 or 16 kHz. The level of f1 was always 10 dB higher than the level of f2, and f2 was varied from 10 to 50 dB SPL to produce input–output functions relating distortion product magnitude to stimulus level. Responses were averaged over 50 repetitions. Stimulus presentations and DPOAE recordings were made using MATLAB OpenDP software version 4.0 created by Ed Smith (University of Maryland, College Park, MD). Statistical significance was calculated by a two-tailed Student's t test with unequal variance.
Results
Production of ear-restricted Vangl2 CKOs and phenotypic comparison of KO and CKO phenotypes
The core PCP protein Vangl2 contributes to planar polarity during a number of different development events, including the convergent extension movements of neuroepithelial cells along the vertebrate axis that are essential for neural tube closure. As a result, the Vangl2 mutations in the Looptail mouse and Vangl2ΔTMs KO mice result in craniorachischisis, a profound and lethal neural tube defect in which the neural tube fails to close along the length of the embryo (Kibar et al., 2001; Yin et al., 2012). To interrogate Vangl2 function at later postnatal stages, Vangl2 CKO mice were generated in which Vangl2 gene deletion can be restricted in specific cells or tissues using Cre recombinase. For this approach, the Vangl2 gene was modified by homologous recombination in mouse ES cells to introduce tandem LoxP sites flanking exons 2 and 3 (Fig. 1A). Homozygous floxed animals (Vangl2LoxP/LoxP) are viable, and homologous recombination and excision of a neomycin resistance (NeoR) gene used for positive selection were confirmed by Southern blot assay (Fig. 1B). To confirm that Cre-mediated deletion of these exons prevented Vangl2 protein expression as predicted, Vangl2LoxP mice were crossed to CAG–Cre mice in which recombination occurs in the oocyte (Sakai and Miyazaki, 1997). This permanently deleted Vangl2, resulting in a second Vangl2 KO allele (Vangl2ΔATG). Western blot analyses using a polyclonal antibody directed against the N terminus of Vangl2 demonstrated a complete loss of Vangl2 protein from Vangl2ΔATG KO brain lysates at E18.5 (Fig. 1C). In addition, and similar to the Vangl2ΔTMs KO, Vangl2ΔATG KOs are not viable because of neural tube defects (Yin et al., 2012). To confirm that the Vangl2ΔATG deletion produced a fully penetrant inner ear phenotype, cochleae were collected from Vangl2ΔATG KOs and WT control embryos at E18.5. At this stage, the planar polarity of auditory hair cells was visualized using phalloidin to label the stereociliary bundle and antibodies against Pericentrin to mark the basal body of the kinocilium (Fig 1E,F). In all positions examined along the length of the cochlea, the mutant organ of Corti contained misoriented hair cells in the IHC and third outer hair cell (OHC3) rows. Similar to the Looptail (Montcouquiol et al., 2003) and Vangl2ΔTMs KO (Yin et al., 2012) lines, this phenotype is greatest in OHC3 in which the majority of hair cells are pointed in the wrong direction.
To study Vangl2 function during postnatal development, CKOs were generated in which Vangl2 gene deletion is restricted to limited tissues including the inner ear by crossing Vangl2LoxP/LoxP female mice to Pax2–Cre+;Vangl2ΔTMs/WT males. The resulting Pax2–Cre+;Vangl2ΔTMs/LoxP mice (henceforth called Vangl2 CKOs) are viable and display no overt physiological or behavior phenotypes in standard housing conditions. The efficacy of Vangl2 gene deletion by Pax2–Cre within the inner ear was demonstrated by Western blot analysis of cochlear epithelia microdissected from Vangl2 CKOs or littermate controls at P1 (Fig. 1D). The phenotypic efficacy of Vangl2 gene deletion by Pax2–Cre was demonstrated by quantifying the planar polarity phenotype of auditory hair cells in Vangl2 CKOs and comparing phenotypic severity with Vangl2ΔATG KOs at E18.5. For this comparison, the measured orientations of individual stereociliary bundles in analysis fields located 50% along the length of the cochlea were graphed on circular histograms (Fig. 2A). In addition, the deviation of bundle orientations from the mediolateral cochlear axis was calculated and averaged between animals for hair cells located in analysis fields positioned at 25, 50, or 75% of the cochlear length as measured from base to apex (Fig. 2B–D). Although statistically significant differences were measured between Vangl2ΔATG KOs or Vangl2 CKOs and WT controls, there was no difference in averaged stereociliary bundle deviations between KOs and CKOs (two-tailed Student's t test with unequal variance).
Figure 2.
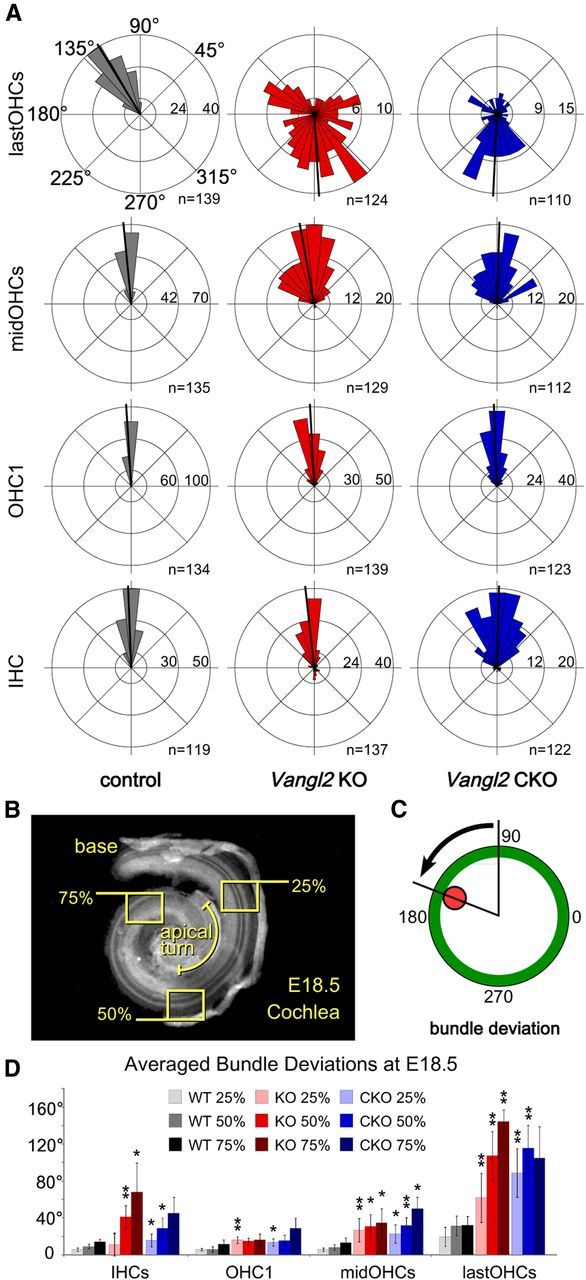
Vangl2 CKOs phenocopy Vangl2ΔATG KOs in the E18.5 organ of Corti. Vangl2 CKO mice were generated in which the Vangl2ΔATG deletion is restricted to tissues including the inner ear using Pax2–Cre. Efficacy of Vangl2 deletion on Pax2–Cre-mediated recombination was determined by quantifying the auditory planar polarity phenotypes for comparison between Vangl2 CKOs and KOs at E18.5. A, Individual stereociliary bundle orientations graphed on circular histograms for all hair cells analyzed in the middle turn of the cochlea (50% cochlear length). For these histograms, 0° is directed toward the base of the cochlea and 180° toward the apical turn. Bin width is 12°. The total number of hair cells represented by each histogram (n) is shown, and black bars mark mean stereociliary bundle orientation. B, For quantitative analyses, stereociliary bundle orientations were measured for hair cells located within three analysis fields located at positions 25, 50, and 75% along the length of the cochlea as illustrated on this low-magnification image of a fluorescently labeled E18.5 mouse cochlea. C, Schematic illustration of a single hair cell demonstrating the angular measurement used for quantifying stereociliary bundle deviation. The red dot marks the position of the basal body of the kinocilium. D, The averaged stereociliary bundle deviation from the mediolateral axis of the cochlea for Vangl2 KO, Vangl2 CKO, and control hair cells from basal (25%), middle (50%), and apical (75%) turns of the cochlea. For orientation assays, the number of mice analyzed is n = 5 (25%), 5 (50%), 5 (75%) for WT, n = 6, 6, 6 for KO, and n = 5, 5, 3 for CKO. Because Vangl2 KO cochleae frequently contain additional hair cell rows in the 75% analysis field, those hair cells located between OHC1 and the last row of OHCs (lastOHCs) were group together for analysis as middle hair cells (midOHCs). Error bars show SD, and asterisks indicate statistical significance for differences between Vangl2 CKOs or Vangl2 KOs and littermate controls of the same hair cell type and cochlear position calculated using two-tailed Student's t test with unequal variance (*p < 0.05, **p < 0.005). No significant differences between Vangl2 KO and Vangl2 CKO were identified in this analysis.
The cochleae of Vangl2ΔATG KO mice frequently contained additional rows of OHCs in that region of the apical turn, corresponding to 75% of the cochlear length (five of six embryos) similar to Looptail and the Vangl2ΔTMs KO. Therefore, for the purpose of quantification, hair cells located between OHC1 and the outermost row were grouped together (Fig. 2A,D, midOHCs), whereas the outermost row was analyzed separately (Fig. 2A,D, lastOHCs). Additional OHC rows were less common in Vangl2 CKOs, occurring in only 2 of 21 embryos at this apical location and at a frequency more similar to littermate controls (1 of 18 embryos). The Vangl2 CKO also lacks the gross morphological changes that occur in Looptail mutants (Montcouquiol et al., 2003) and the Vangl2ΔATG KO ear. When evaluated by 3D reconstruction of whole inner ears optically sectioned by confocal microscopy (Kopecky et al., 2012), the length and number of turns of the Vangl2 CKO cochlea is similar to littermate controls (Fig. 3A,B,D,E). In contrast, the cochlea of Vangl2 KOs is shorter and has fewer turns (Fig. 3C,F). Altogether, these analyses demonstrate that Pax2–Cre is sufficient to remove Vangl2 from the developing inner ear at a stage early enough in development to produce stereociliary bundle orientation phenotypes that are indistinguishable in severity between Vangl2 CKOs and Vangl2ΔATG KOs. In contrast, cochlear convergent extension deficits, as defined by the presence of additional rows of OHCs in the apical turns and length of the spiraling cochlea, are infrequent in Vangl2 CKOs.
Figure 3.

The gross morphology of the inner ear is unaltered in Vangl2 CKOs. Medial views of the 3D reconstructions of control (A) and Vangl2 CKO (B) inner ears at E18.5 show similar size and morphology of the endolymphatic spaces, including the length and spiral coil of the cochlea. Auditory (blue) and vestibular (red) structures were highlighted by pseudocoloring after reconstruction. C, The inner ear from Vangl2 KOs shows a reduction in size dorsoventrally and a shortened cochlear duct. Ventral views of control (D) and Vangl2 CKO (E) scala media demonstrate the similar length and number of turns of the cochlea in these genotypes. The ventral view of Vangl2 KO scala media (F) shows a reduction in the length and number of turns to the cochlea duct. Scale bars, 200 μm.
Planar polarity in the Vangl2 mutant cochlea is actively refined during neonatal development
The severity of the planar polarity phenotype in Vangl2ΔATG and Vangl2ΔTMs KO mice decreases along a gradient running the length of the cochlea, with the most effected cells located in the apical turn and the least effected in the base (Fig. 2D; Yin et al., 2012). To determine whether this phenotypic gradient is maintained at later postnatal stages, the planar polarity of Vangl2 CKOs was evaluated from birth (P0) to a stage just before onset of hearing (P10–P12) using phalloidin and Pericentrin antibodies. As reported previously, the hair cells located in OHC3 of littermate control animals generally pointed toward the apical turns of the cochlea at P0, deviating ∼40° from the mediolateral cochlear axis (Figs. 4A, 5A). These cells are actively reoriented so that, by P4, their stereociliary bundles are aligned with bundles from the other hair cell rows (Figs. 4C, 5B; Dabdoub et al., 2003). In comparison, the stereociliary bundles in OHC3 of Vangl2 CKOs are more severely misoriented at P0 relative to controls and are inappropriately aligned along the mediolateral axis of the organ of Corti (Figs. 4B, 5A). Remarkably, over the next 4 d of postnatal development, the severity of this phenotype is diminished, and, by P4, hair cells located in OHC3 are realigned with stereociliary bundles correctly oriented toward the lateral edge of the cochlea similar to controls (Figs. 4C,D, 5B). Other aspects of cellular differentiation and tissue maturation, including flattening of the stereocilia rows on IHCs and expansion of the inner pillar cell (IPC) apical surfaces, continue at a similar rate in Vangl2 CKOs and littermate controls (Fig. 4E,F).
Figure 4.

Auditory stereociliary bundles are reoriented through a Vangl2-independent mechanism. A, B, Hair cells labeled at P0 with phalloidin (green) and antibodies against Pericentrin (red) demonstrate the planar polarity phenotype of Vangl2 CKO mice (B), particularly in OHC3. C, D, At P4, the magnitude of the planar polarity phenotype in CKO mice is diminished and stereociliary bundle orientation appears less severely affected. E, F, For hair cells in tissue labeled between P10 and P12, planar polarity development appeared complete and stereociliary bundle orientations were more similar between Vangl2 CKOs and littermate controls. Schematics presented in A′–F′ illustrate the stereociliary bundle orientations of hair cells imaged in the primary panels. All images were collected from the 50% analysis field. Scale bars, 10 μm.
Figure 5.

A period of auditory planar polarity refinement occurs between P0 and P4. A, B, Individual stereociliary bundle orientations for hair cells located in the 75% analysis field graphed as circular histograms from Vangl2 CKO and littermate control cochlea labeled at P0 (A) and P4 (B). In control tissues at P0, the hair cells located in OHC3 have stereociliary bundles that lean toward the apical turn of the cochlea (A). These bundles are reoriented along the mediolateral axis through a process that is completed by P4 (B). In Vangl2 CKO tissues, hair cells in OHC3 are severely affected at P0 with the majority of stereociliary bundles oriented toward the spiral ganglia (A). These bundles are also actively reoriented, as are the hair cells in the remaining rows, so that they appear more similar to littermate controls at P4 (B). For these histograms, 0° is directed toward the base of the cochlea and 180° toward the apical turn. Bin width is 12°. The total number of hair cells represented by each histogram (n) is shown, and black bars show mean stereociliary bundle orientation.
Despite this period of dramatic refinement and continued maturation, the planar polarity of OHCs is never completely corrected in Vangl2 CKOs. As a result, a broader range of stereociliary bundle orientations remain present in OHC3 at all ages (Figs. 6, 7). Similar to the Looptail and Vangl2 KO phenotypes, there is also a gradient in the planar polarity phenotype that spans the length of the cochlea. When quantified, the averaged deviation of stereociliary bundle polarity from the mediolateral axis is less in the 25% analysis fields positioned in the base (Fig. 6A) than at the 50% (Fig. 6B) and 75% (Fig. 6C) locations. However, because of the period of postnatal refinement, this gradient is shallower in Vangl2 CKO cochlea at P10–P12 than Vangl2 KOs at E18.5 (Fig. 2C). Moreover, the remaining planar polarity deficits in the CKO are greatest in the apical turn of the cochlea, beyond the 75% analysis field (illustrated in Fig. 4B), in which severely misaligned OHCs can be visualized between P10 and P12 (Fig. 7A,B). These misoriented hair cells are maintained in the apical turn of the adult until at least 7 weeks of age, as demonstrated by SEM (Fig. 7C,D). Overall, at 7 weeks, hair cells in the CKO appear healthy and viable, and there is no indication of hair cell loss in the Vangl2 CKO cochlea. Other characteristics of the stereocilia, including stereocilium length and bundle formation, also appear normal. Together, these results suggest the existence of a critical period in which planar polarity deficits are actively refined and that afterward stereociliary bundle orientation becomes static. As a result, some cells in the apical turn remain fixed in a misaligned state. One interesting possibility is that closure of the critical period is attributable to the elaboration of intercellular adhesion complexes (Collado et al., 2011; Burns et al., 2013) and that cytoskeletal maturation prevents stereocilia rearrangement or hair cell rotation.
Figure 6.

The extent of planar polarity refinement is graded along the length of the cochlea. A–C, Averaged stereociliary bundle deviations from the mediolateral axis for hair cells located at the 25% (A), 50% (B), and 75% (C) analysis fields from tissues collected at three stages of postnatal development. Planar polarity refinement actively reorients stereociliary bundles in the Vangl2 CKO between P0 and P4, whereas bundle polarity does not change significantly between tissues collected at P4 and P10–P12. At all ages, the differences in averaged stereociliary bundle deviation from the mediolateral axis are greatest in the most apically positioned 75% analysis field (C). Despite planar polarity refinement, IHCs and hair cells located in OHC3 remain modestly misoriented and are never as organized as the corresponding hair cells in littermate controls. The number of mice assayed at P0 is n = 4 (25%), 4 (50%), 4 (75%) for WT and n = 6, 6, 6 for CKO; at P4, n = 3, 3, 3 for WT and n = 5, 6, 6 for CKO; and at P10–P12, n = 2, 4, 6 for WT and n = 4, 4, 6 for CKO. Error bars show SD, and asterisks indicate statistical significance for differences between Vangl2 CKOs and littermate controls of the same hair cell type and cochlear position calculated using two-tailed Student's t test with unequal variance (*p < 0.05, **p < 0.005).
Figure 7.

Misoriented stereociliary bundles in the apical turn of the cochlea are maintained in the adult. OHCs in the apical turn of the cochlea from littermate control (A) and Vangl2 CKO (B) mice labeled for phalloidin at P10–P12. In this position of the cochlea, the postnatal refinement of planar polarity deficits is incomplete and misoriented stereociliary bundles in OHC3 can still be identified (B, arrowheads). The loss of Vangl2 also disrupts the patterning of Deiters' cells, and their apical cell surfaces are frequently misshapen and displaced to the medial side of OHCs. Three examples of Deiters' cells are marked by asterisks in control (A) and Vangl2 CKO (B) tissues. C, D, SEM images of tissue collected at 7 weeks of age demonstrate that misoriented hair cells are maintained in OHC3 of the apical turn of the adult cochlea. OHC stereociliary bundles are pseudocolored in purple, and arrowheads mark misoriented bundles in OHC3 (D). Scale bars: A, B, 10 μm; C, D, 2 μm.
In contrast to the auditory system, the planar polarity phenotype of vestibular hair cells of the utricular maculae is not actively refined. This was established using vestibular planar polarity assays in which the utricular maculae is divided into three analysis fields based on the LPR and position of the striola (Fig. 8A; Yin et al., 2012). In Vangl2 CKOs, stereociliary bundles in the striola are misoriented (Fig. 8B–D), similar to the vestibular phenotype of Vangl2ΔTMs KOs (Yin et al., 2012). During the developmental period between P0 and P12, the overall distribution of stereociliary bundle orientations (Fig. 8B) and the averaged deviation of the bundle orientation from a reference drawn perpendicular to the LPR (Fig. 8C) are not changed in Vangl2 CKOs. This finding is confirmed by measurements of circular variance (CV), an independent statistical measure of PCP for groups of hair cells in each analysis field in which a CV value of 0 only occurs when stereociliary bundle orientations are uniform. CV analysis further demonstrates that the planar polarity phenotype of vestibular hair cells is not refined during postnatal development (Fig. 8D). Altogether, these postnatal studies demonstrate the presence of a Vangl2-independent planar polarity pathway that actively refines the orientation of stereociliary bundles of auditory, but not vestibular, hair cells.
Figure 8.
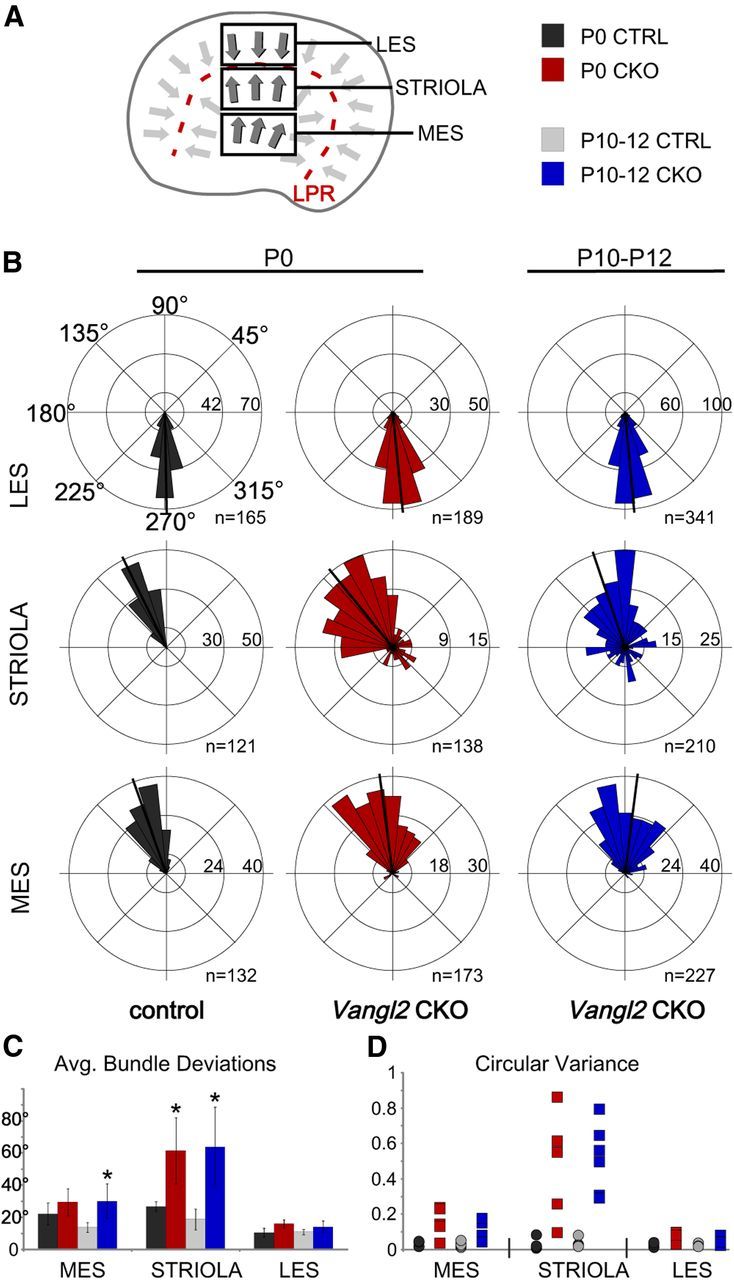
Planar polarity refinement does not occur in the utricular maculae. A, Schematic illustrating the positions of the three analysis fields relative to the position of the LPR. Hair cells in the maculae are patterned about an LPR, and, as a result, cells in the LES have stereociliary bundle orientations that are opposite of those in the striola and MES. B, Individual stereociliary bundle orientations for vestibular hair cells of the utricular maculae at P0 or between P10 and P12 graphed as circular histograms demonstrate stereociliary bundle misorientation in the striola region of the Vangl2 CKO. Unlike the case for auditory hair cells, the orientation of affected cells in the striola of Vangl2 CKO mice is not refined during the first 12 postnatal days. For these histograms, 90° is directed toward the lateral and 180° toward the medial edge of the utricular maculae, and each bin is 12°. The total number of hair cells represented by each histogram (n) is shown, and black bars mark the mean stereociliary bundle orientation. C, Averaged vestibular stereociliary bundle deviations from a polarity reference drawn perpendicular to the LPR. Error bars show SD, and asterisks indicate statistical significance for differences between Vangl2 CKOs and littermate controls of the same hair cell type and utricular position calculated using two-tailed Student's t test with unequal variance (*p < 0.025). D, The CV of stereociliary bundle orientation for hair cells located in each vestibular analysis field demonstrates the loss of coordinated orientation for hair cells located in the striola region. In this analysis, a CV value of 0 occurs for uniform bundle orientations, and each symbol represents a single analysis field. No difference in the distribution of CV values occurs between P0 and P12, indicating that active refinement does not occur in the vestibular maculae. The number of mice assayed at P0 is n = 4 for WT and n = 5 CKO, and, at P10–P12, n = 6 for WT and n = 6 for CKO. LES, Lateral extra striolar region; MES, medial extra striolar region.
Postnatal planar polarity refinement does not require asymmetric localization of the remaining PCP proteins
In vertebrates, like invertebrates, mutations in core PCP genes lead to changes in the expression or subcellular distribution of the remaining PCP proteins. For example, disrupted Vangl2 trafficking to the cell surface in Looptail mutants (Merte et al., 2010; Wansleeben et al., 2010) prevents the concurrent delivery of Vangl1 attributable to oligomerization between Vangl1 and Vangl2 (Belotti et al., 2012; Yin et al., 2012). Similarly, in Looptail mutants, Fz3 and Fz6 fail to assemble into a functional complex at the apical cell surface despite maintaining protein expression levels similar to controls (Wang et al., 2006b). In contrast, the loss of Vangl2 in Vangl2ΔTMs KOs does not inhibit Pk2 delivery to the cell surface but results in the symmetrical redistribution of Pk2 around vestibular hair cells located in the striola region of the utricle (Yin et al., 2012). Nevertheless, one possible explanation for planar polarity refinement in Vangl2 CKOs is residual PCP signaling or genetic compensation from the closely related Vangl1 gene. Consistent with this hypothesis, genetic interactions between Vangl1 and Vangl2 have been reported in the developing cochlea (Torban et al., 2008; Song et al., 2010). This possibility was tested by evaluating the expression and distribution of core PCP proteins in the Vangl2 CKO mice.
For these experiments, immunofluorescent labeling was completed at P1 because this postnatal age falls within the active period of planar polarity refinement. When visualized by confocal microscopy in control tissues, Vangl1 immunofluorescence is detected at the boundaries between OHCs and the adjacent OPCs or Deiters' cells (Fig. 9A,A′; Song et al., 2010). Although generated against a Vangl1 antigen, this Vangl1 antibody has been shown to cross-react with Vangl2 after overexpression in heterologous cells (Yin et al., 2012), raising the possibility that the labeling patterning in littermate controls represents the distribution of both proteins. In Vangl2 CKOs, this pattern of Vangl1 immunofluorescence is significantly altered with decreased labeling of the hair cell–supporting cell (HC–SC) boundary (Fig. 9B,B′). The absence of immunofluorescent signal at this time suggests that Vangl1 protein is not present during the initial stages of planar polarity refinement. However, in both Vangl2 CKOs and littermate controls, Vangl1 levels increase between P1 and P5 (Fig. 9C,D). In control tissue, Vangl1 becomes highly enriched at the HC–SC boundary at P5 (Fig. 9C). This is in contrast to Vangl2 CKOs in which Vangl1 protein is also upregulated at P5 but never attains a polarized subcellular distribution (Fig. 9D). Nonetheless, these results raise the possibility that residual Vangl1 signaling could compensate for the loss of Vangl2. Another core PCP protein that is enriched at the HC–SC boundary is the transmembrane receptor Fz6 (Fig. 9E; Wang et al., 2006b). Consistent with the observed loss of hair cell planar polarity in the Vangl2 CKO cochlea, Fz6 is also missing from cell boundaries in the absence of Vangl2. Moreover, changes in Fz6 localization are correlated with increased immunofluorescent puncta at the apical surface of hair cells and supporting cells, suggesting that Fz6 expression is maintained in the CKO but that, similar to Vangl1, the asymmetric localization of Fz6 protein at the HC–SC boundary is dependent on Vangl2 (Fig. 9F,F′).
Figure 9.
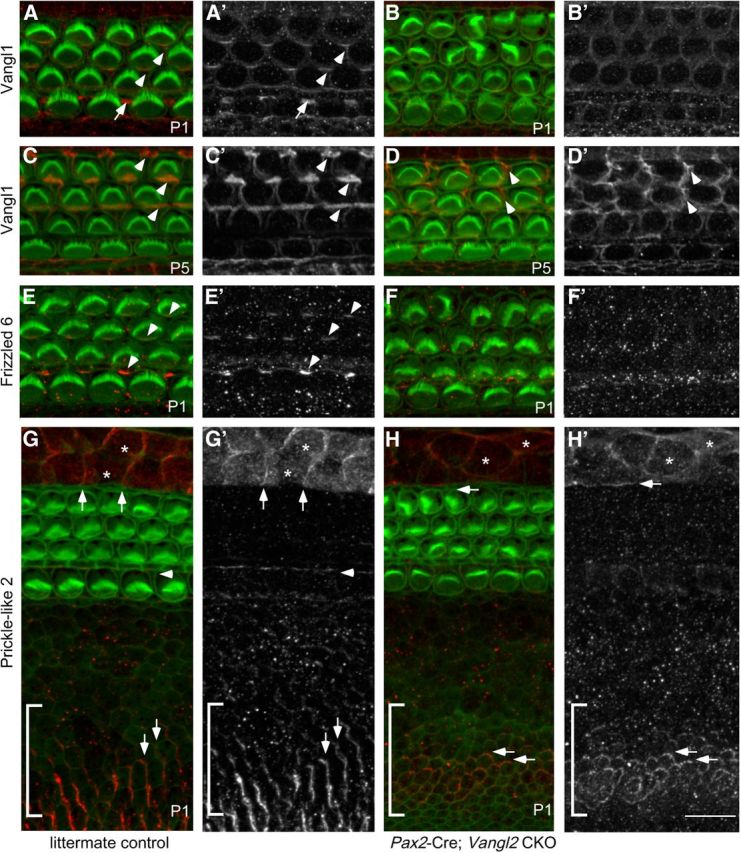
The polarized distribution of the remaining PCP proteins is disrupted in Vangl2 CKOs. A, A′, Vangl1 protein visualized by immunofluorescence (red) is asymmetrically localized in the P1 organ of Corti, including the cell boundaries between OHCs and the adjacent Deiters' cells (examples indicated by arrowheads) and at the boundaries between IPCs and inner phalangeal cells (example indicated by arrow). A′, Grayscale image of A shows the asymmetric distribution of Vangl1 at these cell boundaries. B, B′, In Vangl2 CKOs, Vangl1 localization is disrupted and Vangl1 protein is no longer enriched at cell boundaries. C, D, At P5, the level of Vangl1 expression is increased in littermate controls (C, examples illustrated by arrowheads) and Vangl2 CKOs (D). Despite this, Vangl1 is never asymmetrically localized at hair cell boundaries after OHC reorientation (D, examples illustrated by arrowheads). E, The transmembrane receptor Fz6 (red) is asymmetrically localized in auditory hair cells at P1 to the medial boundary between OHCs and the adjacent Deiters' cells and at the boundaries between IPCs and inner phalangeal cells (examples indicated by arrowheads). E′, Grayscale image of E shows the asymmetric distribution of Fz6 at cell boundaries. F, F′, In Vangl2 CKOs, Fz6 localization to cell boundaries is disrupted (F′) and appears as immunofluorescence puncta throughout the organ of Corti. G, G′, The Vangl2-associated protein Pk2 (red) is enriched in nonsensory cells flanking the organ of Corti, including the Hensons' cells (asterisks mark two examples) and cells of the inner sulcus (bracketed region). In both cell types, Pk2 is enriched at cell boundaries oriented perpendicular to the hair cell rows (vertical arrows). Within the organ of Corti, Pk2 is enriched along one edge of the IPCs (arrowhead). G′, Grayscale image of G shows the asymmetric distributions of Pk2 at these cell boundaries. H, H′, In Vangl2 CKOs, the polarized distribution of Pk2 is disrupted with Pk2 frequently redistributed throughout the cell periphery (horizontal arrows). Pk2 expression in the IPCs is also significantly reduced. For all primary panels, hair cell stereociliary bundles and the actin-rich cortical belts surrounding hair cells and supporting cells are labeled with phalloidin (green). Scale bar, 10 μm.
The polarized subcellular distribution of the putative Vangl2 binding protein Pk2 is also dependent on Vangl2. In control tissues, a low level of Pk2 is present at the boundary between the IPCs and the IHCs or the inner phalangeal cells (Fig. 9G,G′, arrowhead). Similar to Vangl1 and Fz6, the polarized distribution of Pk2 at these cell boundaries is lost in the Vangl2 CKO (Fig. 9H,H′). In littermate controls, Pk2 immunolabeling is more prominent outside of the organ of Corti in the Hensons' cells and cells of the inner sulcus in which it is localized to cell boundaries parallel to the mediolateral cochlear axis (Fig. 9G,G′, arrows). This localization is perpendicular to polarized subcellular distribution of Pk2 and other PCP proteins within the organ of Corti. The distribution of Pk2 in these nonsensory cell types is also altered in the Vangl2 CKO in which it becomes more uniform and is also present at lateral cell boundaries (Fig. 9H,H′, arrows). Altogether, these protein distribution assays argue that residual PCP signaling in Vangl2 CKO tissue is severely compromised because essential proteins are either missing or are mislocalized and that PCP signaling is unlikely to contribute to the refinement of planar polarity at this postnatal stage.
Vangl2 contributes to the morphogenesis of auditory supporting cells
In the developing organ of Corti, Vangl2 is present at the HC–SC boundary in which it is in a position to influence planar polarity signaling between the two cells types (Montcouquiol et al., 2006). Recent protein distribution studies based on electroporation of GFP-tagged Vangl2 and visualization of Vangl2 immunofluorescence by stimulated emission depletion microscopy show Vangl2 enrichment at the supporting cell side of the HC–SC boundary (Giese et al., 2012). At this location, Vangl2 is opposite of Fz3 and Fz6 at the hair cell side of the boundary (Wang et al., 2006b) and is similar to Drosophila in which Fz and Vang complexes also oppose each other across the extracellular space (Wu and Mlodzik, 2008). More importantly, this distribution raises the possibility that Vangl2 may have specific functions during the morphogenesis of supporting cells in addition to acting with Fz during the initial establishment of hair cell planar polarity.
Hair cells and supporting cells in the organ of Corti form a pseudostratified epithelium in which the hair cell bodies are located closer to the cochlear lumen and above the supporting cells. Two classes of supporting cells, the OPCs and Deiters' cells, extend phalangeal processes between the OHCs to contact the organ of Corti surface. The Deiters' cell phalangeal process projects toward the apical turn of the cochlea and contacts the apical surfaces of two neighboring hair cells. Deiters' cells are thought to be important cellular components of the cochlear amplifier that transmit the force generated by OHC electromotility to the underlying basilar membrane (Nam and Fettiplace, 2010). The Deiters' cell phalangeal process can be visualized when the Deiters' cell cytoskeleton is immunolabeled using antibodies against β1β2-tubulin (Fig. 10A′, arrowheads). This antibody also highlights the apical surface of the tubulin-rich IPCs (Fig. 10A′, bracket) and OPCs (Fig. 10A′, arrows). During postnatal development in the mouse, the apical surface of OPCs and Deiters' cells is expanded and establishes the regular spacing between OHCs that is evident when the surface of the organ of Corti is labeled with phalloidin (Fig. 10A″, arrows and asterisks). Supporting cells from each class are centrally positioned between adjacent hair cells of a single row. Thus, the apical surface of the OPC is located between adjacent hair cells in OHC1, and the apical surfaces of Deiters' cells are located between adjacent hair cells in OHC2 and OHC3.
Distinct changes in the shapes and distribution of supporting cell apical surfaces are evident in Vangl2 CKOs at P10–P12 in the 75% analysis field (Fig. 10B), and these changes become more pronounced in the apical turn. In Vangl2 CKOs, the OPCs are often more compact and incorrectly positioned at the neural side of OHC1 rather than between adjacent hair cells (Fig. 10B′, arrows). Similarly, the Deiters' cells are frequently shifted out of the OHC2 or OHC3 rows and are not centrally positioned between the hair cell lateral edges (Fig. 10B″, asterisks). The changes in the apical surface of Deiters' cell processes are correlated with structural changes in their phalangeal process as revealed by β1β2-tubulin labeling (Fig. 10B′, arrowheads). Frequently in the CKO, the phalangeal process does not project laterally to contact neighboring hair cells and instead appears to contact the apical surface of the OHC above the Deiters' cell body. In these instances, the apical surface of the Deiters' cell appears to be misplaced to the neural side of the hair cell (Fig. 10B, asterisks).
The characteristic morphology of an individual Deiters' cell is best illustrated when it is injected with the fluorescent tracer Alexa Fluor 488 (Fig. 10C–E). The Deiters' cell soma sits beneath a single hair cell (Fig. 10C, asterisk), whereas the apical surface of the phalangeal process extends past three to four OHCs before contacting the organ of Corti surface (Fig. 10C, arrow). In Vangl2 CKOs, the position of the Deiters' cell body beneath the OHCs is not altered, but the relative length of the phalangeal processes is frequently reduced (Fig. 10D,E). As suggested by β1β2-tubulin immunofluorescence, these phalangeal processes are often shorter and contact the apical surface of the OHC located immediately adjacent to the labeled Deiters' cell (Fig. 10D). For other Deiters' cells, the apical surface of the phalangeal process is mispositioned between the OHC rows rather than terminating between the lateral edges of OHCs in a single row (Fig. 10E, arrowhead). Despite these morphological changes, there are no differences in the number of supporting cells, and the ratio of OHCs/supporting cells remains constant (1 OHC:1.4 SCs for both genotypes). Thus, in addition to its well-described function, stereociliary bundle planar polarity, Vangl2 also acts during the polarized morphogenesis of cochlear supporting cells.
Changes to the cellular architectures in the Vangl2 CKO organ of Corti lead to hearing deficits
The ability of Vangl2 mutant ears to detect sound and relay that information to the CNS was tested by ABR and DPOAE measurements. It has not been possible to collect similar physiological measurements from other core PCP mouse mutants because of the lethal neural tube defects associated with those mutations. In contrast, when Vangl2 gene deletion is restricted using Pax2–Cre, these mice are viable beyond 6 months of age. Nonetheless, ABR and DPOAE measurements were conducted in 6- to 8-week-old animals to preclude the effects of age-related hearing loss associated with inbred mouse strains. In addition, mice subjected to auditory testing were also raised in a sound-controlled environment because background noise levels in standard high-capacity vivariums may also contribute to hearing loss (Lauer et al., 2009).
At the loudest sound pressure levels applied, the overall shape of the ABR waveform was similar between Vangl2 CKOs and littermate controls, although the amplitude of the CKO ABR was diminished (Fig. 11A). In addition, the response threshold of Vangl2 CKOs to clicks and pure tones across a range of frequencies was mildly, albeit significantly, increased (Fig. 11A,B). For these measurements, threshold was defined as a synchronous neural activity with a magnitude of response 2 SDs above baseline activity. The ABR waveform can be temporally divided, and separate peaks are associated with the activation of different populations of neurons along the ascending auditory pathway. Wave 1 is generated by the neurons of the spiral ganglion; bipolar neurons are essential for hearing because they receive input from auditory hair cells and extend axons through the VIIIth cranial nerve to the CNS (Fig. 11A, arrows). Pax2–Cre-mediated gene deletion resulted in a decrease in wave 1 peak amplitude consistent with phenotypic changes in the organ of Corti (Fig. 11C). In addition, wave 1 amplitude was decreased across all frequencies, suggesting that the physiological consequences of Vangl2 gene deletion were not enhanced in the apical versus the basal turns despite the graded severity of the planar polarity phenotype along the length of the cochlea (Fig. 6). These differences are not attributable to progressive hair cell loss because there is not a significant difference in hair cell number when the organ of Corti was examined by SEM at 7 weeks of age (Fig. 7 and data not shown).
Figure 11.

ABR and DPOAE analyses demonstrate reduced auditory sensitivity in Vangl2 CKOs. A, The averaged ABR waveform collected from littermate control and Vangl2 CKO mice between 6 and 8 weeks of age in response to click stimuli. CKO animals have decreased waveform amplitude and increased response threshold. B, The threshold of the ABR response to click stimuli or tones at fixed frequencies. C, The peak amplitude of ABR wave 1 measured from P1 (arrow in A) to N2 (arrowhead in A) in response to clicks or tones of increasing sound intensity. The amplitude of the response is reduced for all stimuli. D, DPOAE measurements of the amplitude of the distortion product in response to f2 stimulus of increasing sound pressure level. The decreased amplitude of the distortion product in Vangl2 CKO animals suggests that hearing deficits in these animals stem from changes in OHC activity and/or function of the cochlear amplifier. In each graph, the responses of Vangl2 CKO animals are red. The number of mice assayed for ABR is n = 10 for controls and n = 8 for CKOs, and for DPOAEs is 8 for controls and n = 5 for CKOs. Error bars show SD, and asterisks indicate statistical significance for differences between littermate controls and Vangl2 CKOs using two-tailed Student's t test with unequal variance (*p < 0.05, **p < 0.005).
Because Pax2–Cre also drives Cre-mediated recombination in neurons of the spiral ganglion (Ohyama and Groves, 2004), mice tested for ABRs were also subjected to DPAOE measurements to determine whether the cellular basis of the ABR phenotype was attributable to changes in the spiral ganglia or the organ of Corti. Distortion products are sounds generated by the cochlea when it is stimulated with two pure tones (f1 and f2) that can be recorded from within the ear canal in which the frequency of the distortion product equals 2f2 − f1. DPOAEs reflect the activity of the cochlear amplifier and as such reflect the functional state of the OHC and Deiters' cell array. When assayed using two separate pure tone combinations, Vangl2 CKOs showed significant decreases in the amplitude of the distortion product produced compared with littermate controls (Fig. 11D). Altogether, these tests of auditory function indicate that the hearing deficits associated with the loss of Vangl2 are attributable to developmental changes to the organ of Corti. Because the planar polarity of auditory hair cells is primarily corrected before the onset of hearing, one possible explanation is that the hearing deficits in Vangl2 CKO mice are attributable to changes in supporting cell morphology.
Discussion
Altogether, these experimental results demonstrate the activity of a Vangl2-independent planar polarity mechanism that is capable of rescuing defects in stereociliary bundle orientation that occur during embryonic cochlear development. Although this is still consistent with previous studies demonstrating that Vangl2 is necessary for establishing PCP during embryonic development, these results suggest that core PCP signaling may not be the only patterning mechanism that influences inner ear planar polarity. Evidence for a parallel planar polarity mechanism is also suggested by the phenotypes of Looptail and Vangl2 KO mice because, in these mutants, the severity of the PCP deficits increases along the length of the cochlea (Montcouquiol et al., 2003; Yin et al., 2012). This gradation mirrors the hair cell differentiation gradient and suggests that the Vangl2-independent mechanism reported here may be a normal step in stereociliary bundle maturation. One possibility is that this second later phase is mediated by the related Vangl1 protein that is coincidently upregulated in the organ of Corti between P1 and P5 (Fig. 9A–D). Remarkably, this mechanism is robust enough to reorient mutant hair cells that initially develop 180° out-of-phase and is not dependent on the polarized subcellular distribution of the remaining core PCP proteins, including Vangl1. We also report changes to supporting cell morphology in Vangl2 CKOs that influence the projection of the Deiters' cell phalangeal process and the shape and position of their apical cell surface. In contrast to stereociliary bundle orientation, this aspect of the Vangl2 mutant phenotype does not appear to be refined during postnatal development. These changes in Deiters' cell morphology highlight an underappreciated role for Vangl2 in shaping other complex cellular architectures.
Another significant phenotypic feature of vertebrate PCP mutations is craniorachischisis resulting from convergent extension deficits in the developing neuroepithelia. Similar cellular movements have been proposed to establish the four rows of cochlear hair cells (Wang et al., 2005, 2006a). In this study, we used Pax2–Cre to restrict Vangl2 gene deletion to limited tissues, including the inner ear, thereby avoiding the embryonic lethality of the neural tube defect. Remarkably, in the absence of craniorachischisis, additional rows of OHCs are not prevalent in the Vangl2 CKO and extension of the cochlea is not obstructed (Fig. 3). This is unlikely to be a hypomorphic artifact stemming from the Vangl2ΔATG deletion because extra rows of OHCs are formed in the Vangl2ΔATG KO cochlea. One possibility is that stereociliary bundle polarization and convergent extension are temporally distinct developmental events that can be distinguished by the onset of Pax2–Cre-mediated deletion of Vangl2. A related possibility is that Vangl2 is required in cells outside of the Pax2–Cre expression domain to guide cochlear extension, in which case this activity would not be disrupted in Vangl2 CKOs, where gene deletion is restricted to inner ear epithelia and spiral ganglia (Ohyama and Groves, 2004). Alternatively, the appearance of ectopic OHC rows in PCP mutants is a peripheral phenotype that is a secondary consequence of the dramatic disruptions in cranial morphogenesis and cochlear duct extension associated with craniorachischisis.
Regardless, by using Pax2–Cre in this study to produce a restricted pattern of Vangl2 deletion that includes the inner ear, we were able to characterize the postnatal refinement of stereociliary bundle orientation. Postnatal reorientation has been described for WT hair cells in OHC3 as they rotate ∼30° to become aligned with the mediolateral axis of the cochlear duct (Dabdoub et al., 2003). We observed a similar refinement of littermate control hair cells between P0 and P4 (Fig. 5). Stereociliary bundle reorientation is also a significant maturational event occurring in the chick basilar papillae, the hearing organ of birds (Cotanche and Corwin, 1991). In vitro studies using mouse cochlear explants suggest that reorientation occurs downstream of a Wnt signal because the process is disrupted by the application of Wnt inhibitors (Qian et al., 2007) or ectopic Wnt7a (Dabdoub et al., 2003). Mild planar polarity deficits also occur in the wnt5a mutant cochlea (Qian et al., 2007). Despite these observations, the signal transduction pathway that may act downstream of these Wnt ligands to reorient stereociliary bundle polarity are not known. Biochemical approaches have demonstrated that Wnt5a signaling through ROR2 (receptor tyrosine kinase-like orphan receptor 2) regulates Vangl2 phosphorylation and asymmetric localization in the developing limb bud (Gao et al., 2011), whereas signaling through Ryk controls Vangl2 turnover (Andre et al., 2012). However, because our phenotypic analyses demonstrate that the postnatal refinement of planar polarity occurs independently of Vangl2, stereociliary bundle reorientation is unlikely to involve either of these Wnt signaling pathways.
In the chick, it was proposed that stereociliary bundle reorientation is the result of physical interactions between the stereocilia and the developing tectorial membrane as this extracellular matrix grows across the basilar papillae (Cotanche and Corwin, 1991), raising the possibility that a similar physical stimulus could reorient stereociliary bundles in the mouse cochlea. This mechanism was demonstrated experimentally for the multi-ciliated ependymal cells that line the lateral ventricles of the brain. In this setting, physical stimuli comprising hydrodynamic forces act in parallel with core PCP signaling to establish planar polarity and the coordinated ciliary beating movements that drive CSF flow (Guirao et al., 2010). Despite this potential role for a physical component of polarization, planar polarity phenotypes were not reported in α-tectorin KO mice in which the tectorial membrane is detached from the cochlear epithelium and does not contact the stereocilia (Legan et al., 2000). Moreover, in Vangl2 CKO mice, the planar polarity defect of vestibular hair cells is not refined despite the fact that their stereociliary bundles receive physical stimuli from the overlying otoconial matrix. Although these arguments do not rule out the contribution of physical mechanisms, together they suggest that the tectorial membrane is unlikely to be a primary component of auditory planar polarity refinement.
The auditory deficits measured in Vangl2 CKO mice could have several different cellular origins. Although Pax2–Cre effectively promotes recombination in the organ of Corti, Cre is also expressed in the spiral ganglia and nonsensory epithelia of the inner ear, including the stria vascularis (Ohyama and Groves, 2004). Altered stria vascularis function can lead to ionic imbalance with dilation of the endolymphatic spaces and deafness as seen in Pendred syndrome and Pendrin/SLC26A4 KOs (Everett et al., 2001). Despite this, the gross morphology of the Vangl2 CKO (Fig. 3) appears normal, suggesting that at least the ionic homeostasis function of the stria vascularis remains intact. Conversely, the reduced amplitude of Peak1 of the ABR waveform (Fig. 11C) is indicative of decreased spiral ganglion activity. Although this may be attributable to uncharacterized changes in spiral ganglion morphology or function, the concomitant reduction in distortion product amplitude (Fig. 11D) indicates that the reduced ABR amplitude is influenced at least in part by functional changes to the organ of Corti. One possibility is that the threshold shifts stem from residual planar polarity or stereociliary bundle orientation deficits on OHCs. The amplitude of the hair cell response to mechanical stimulation scales with the cosine of the angular difference between the orientation of the stimulus and the orientation of the bundle (Shotwell et al., 1981). Consistent with this, stereociliary bundle misorientation is associated with diminished auditory function in guinea pig and hamster models (Fujita, 1990; Yoshida and Liberman, 1999). However, the cosine relationship between stimulus and bundle orientation predicts that the average deviation of 25° occurring in the middle turn of the Vangl2 CKO cochlea (Fig. 6) should only reduce response amplitudes to 91% that of hair cells from littermate controls. Therefore, it seems unlikely that planar polarity deficits are the only factor contributing to hearing loss in Vangl2 CKOs. The remaining structural defect in the organ of Corti that might have more a significant impact on auditory threshold are the morphological changes that occur in the Deiters' cells. This population of supporting cells is thought to contribute to OHC function during cochlear amplification by acting as a transducer that allows the force generated by OHC electromotility to be transferred to the underlying basilar membrane (Nam and Fettiplace, 2010). We propose that the changes in Deiters' cell phalangeal processes alter the active biomechanical properties of the organ of Corti, possibly by dampening the force generated by OHC electromotility. Together, these changes in Deiters' cell structure and stereociliary bundle orientation could have a negative effect on the function of the cochlear amplifier, thereby decreasing sensitivity to sound. In future studies, we propose to test this hypothesis through the development of transgenic mouse lines in which Vangl2 gene deletion is further restricted to specific cell populations.
Footnotes
This research was sponsored by grants from the National Organization of Hearing Research, National Institute on Deafness and Other Communication Disorders (NIDCD) Grants R03 DC009490, R01 DC013066, and P30 DC005211, Training Grant T32 DC0000023-28 (J.S.D.), and Grant R01 DC011741 (C.L.). We thank Amanda Lauer for guidance in conducting auditory brainstem response and distortion product otoacoustic emission recordings and Benjamin Copley for assistance in data management and analysis.
The authors declare no competing financial interests.
References
- Andre P, Wang Q, Wang N, Gao B, Schilit A, Halford MM, Stacker SA, Zhang X, Yang Y. The Wnt coreceptor Ryk regulates Wnt/planar cell polarity by modulating the degradation of the core planar cell polarity component Vangl2. J Biol Chem. 2012;287:44518–44525. doi: 10.1074/jbc.M112.414441. [DOI] [PMC free article] [PubMed] [Google Scholar]
- Belotti E, Puvirajesinghe TM, Audebert S, Baudelet E, Camoin L, Pierres M, Lasvaux L, Ferracci G, Montcouquiol M, Borg JP. Molecular characterisation of endogenous Vangl2/Vangl1 heteromeric protein complexes. PLoS One. 2012;7:e46213. doi: 10.1371/journal.pone.0046213. [DOI] [PMC free article] [PubMed] [Google Scholar]
- Burns JC, Collado MS, Oliver ER, Corwin JT. Specializations of intercellular junctions are associated with the presence and absence of hair cell regeneration in ears from six vertebrate classes. J Comp Neurol. 2013;521:1430–1448. doi: 10.1002/cne.23250. [DOI] [PubMed] [Google Scholar]
- Collado MS, Thiede BR, Baker W, Askew C, Igbani LM, Corwin JT. The postnatal accumulation of junctional E-cadherin is inversely correlated with the capacity for supporting cells to convert directly into sensory hair cells in mammalian balance organs. J Neurosci. 2011;31:11855–11866. doi: 10.1523/JNEUROSCI.2525-11.2011. [DOI] [PMC free article] [PubMed] [Google Scholar]
- Cotanche DA, Corwin JT. Stereociliary bundles reorient during hair cell development and regeneration in the chick cochlea. Hear Res. 1991;52:379–402. doi: 10.1016/0378-5955(91)90027-7. [DOI] [PubMed] [Google Scholar]
- Curtin JA, Quint E, Tsipouri V, Arkell RM, Cattanach B, Copp AJ, Henderson DJ, Spurr N, Stanier P, Fisher EM, Nolan PM, Steel KP, Brown SD, Gray IC, Murdoch JN. Mutation of Celsr1 disrupts planar polarity of inner ear hair cells and causes severe neural tube defects in the mouse. Curr Biol. 2003;13:1129–1133. doi: 10.1016/S0960-9822(03)00374-9. [DOI] [PubMed] [Google Scholar]
- Dabdoub A, Donohue MJ, Brennan A, Wolf V, Montcouquiol M, Sassoon DA, Hseih JC, Rubin JS, Salinas PC, Kelley MW. Wnt signaling mediates reorientation of outer hair cell stereociliary bundles in the mammalian cochlea. Development. 2003;130:2375–2384. doi: 10.1242/dev.00448. [DOI] [PubMed] [Google Scholar]
- Deans MR. A balance of form and function: planar polarity and development of the vestibular maculae. Semin Cell Dev Biol. 2013;24:490–498. doi: 10.1016/j.semcdb.2013.03.001. [DOI] [PMC free article] [PubMed] [Google Scholar]
- Deans MR, Antic D, Suyama K, Scott MP, Axelrod JD, Goodrich LV. Asymmetric distribution of prickle-like 2 reveals an early underlying polarization of vestibular sensory epithelia in the inner ear. J Neurosci. 2007;27:3139–3147. doi: 10.1523/JNEUROSCI.5151-06.2007. [DOI] [PMC free article] [PubMed] [Google Scholar]
- Everett LA, Belyantseva IA, Noben-Trauth K, Cantos R, Chen A, Thakkar SI, Hoogstraten-Miller SL, Kachar B, Wu DK, Green ED. Targeted disruption of mouse Pds provides insight about the inner-ear defects encountered in Pendred syndrome. Hum Mol Genet. 2001;10:153–161. doi: 10.1093/hmg/10.2.153. [DOI] [PubMed] [Google Scholar]
- Fujita H. Mutant golden hamsters with an abnormal outer hair cell stereociliary arrangement. Hear Res. 1990;44:63–69. doi: 10.1016/0378-5955(90)90022-H. [DOI] [PubMed] [Google Scholar]
- Gao B, Song H, Bishop K, Elliot G, Garrett L, English MA, Andre P, Robinson J, Sood R, Minami Y, Economides AN, Yang Y. Wnt signaling gradients establish planar cell polarity by inducing Vangl2 phosphorylation through Ror2. Dev Cell. 2011;20:163–176. doi: 10.1016/j.devcel.2011.01.001. [DOI] [PMC free article] [PubMed] [Google Scholar]
- Giese AP, Ezan J, Wang L, Lasvaux L, Lembo F, Mazzocco C, Richard E, Reboul J, Borg JP, Kelley MW, Sans N, Brigande J, Montcouquiol M. Gipc1 has a dual role in Vangl2 trafficking and hair bundle integrity in the inner ear. Development. 2012;139:3775–3785. doi: 10.1242/dev.074229. [DOI] [PMC free article] [PubMed] [Google Scholar]
- Guirao B, Meunier A, Mortaud S, Aguilar A, Corsi JM, Strehl L, Hirota Y, Desoeuvre A, Boutin C, Han YG, Mirzadeh Z, Cremer H, Montcouquiol M, Sawamoto K, Spassky N. Coupling between hydrodynamic forces and planar cell polarity orients mammalian motile cilia. Nat Cell Biol. 2010;12:341–350. doi: 10.1038/ncb2040. [DOI] [PubMed] [Google Scholar]
- Hertzano R, Elkon R, Kurima K, Morrisson A, Chan SL, Sallin M, Biedlingmaier A, Darling DS, Griffith AJ, Eisenman DJ, Strome SE. Cell type-specific transcriptome analysis reveals a major role for Zeb1 and miR-200b in mouse inner ear morphogenesis. PLoS Genet. 2011;7:e1002309. doi: 10.1371/journal.pgen.1002309. [DOI] [PMC free article] [PubMed] [Google Scholar]
- Hudspeth AJ, Corey DP. Sensitivity, polarity, and conductance change in the response of vertebrate hair cells to controlled mechanical stimuli. Proc Natl Acad Sci U S A. 1977;74:2407–2411. doi: 10.1073/pnas.74.6.2407. [DOI] [PMC free article] [PubMed] [Google Scholar]
- Kibar Z, Vogan KJ, Groulx N, Justice MJ, Underhill DA, Gros P. Ltap, a mammalian homolog of Drosophila Strabismus/Van Gogh, is altered in the mouse neural tube mutant Loop-tail. Nat Genet. 2001;28:251–255. doi: 10.1038/90081. [DOI] [PubMed] [Google Scholar]
- Kopecky BJ, Duncan JS, Elliott KL, Fritzsch B. Three-dimensional reconstructions from optical sections of thick mouse inner ears using confocal microscopy. J Microsc. 2012;248:292–298. doi: 10.1111/j.1365-2818.2012.03673.x. [DOI] [PMC free article] [PubMed] [Google Scholar]
- Lauer AM, May BJ, Hao ZJ, Watson J. Analysis of environmental sound levels in modern rodent housing rooms. Lab Anim (NY) 2009;38:154–160. doi: 10.1038/laban0509-154. [DOI] [PMC free article] [PubMed] [Google Scholar]
- Legan PK, Lukashkina VA, Goodyear RJ, Kössi M, Russell IJ, Richardson GP. A targeted deletion in alpha-tectorin reveals that the tectorial membrane is required for the gain and timing of cochlear feedback. Neuron. 2000;28:273–285. doi: 10.1016/S0896-6273(00)00102-1. [DOI] [PubMed] [Google Scholar]
- Merte J, Jensen D, Wright K, Sarsfield S, Wang Y, Schekman R, Ginty DD. Sec24b selectively sorts Vangl2 to regulate planar cell polarity during neural tube closure. Nat Cell Biol. 2010;12:41–46. doi: 10.1038/ncb2002. sup pp 1–8. [DOI] [PMC free article] [PubMed] [Google Scholar]
- Montcouquiol M, Rachel RA, Lanford PJ, Copeland NG, Jenkins NA, Kelley MW. Identification of Vangl2 and Scrb1 as planar polarity genes in mammals. Nature. 2003;423:173–177. doi: 10.1038/nature01618. [DOI] [PubMed] [Google Scholar]
- Montcouquiol M, Sans N, Huss D, Kach J, Dickman JD, Forge A, Rachel RA, Copeland NG, Jenkins NA, Bogani D, Murdoch J, Warchol ME, Wenthold RJ, Kelley MW. Asymmetric localization of Vangl2 and Fz3 indicate novel mechanisms for planar cell polarity in mammals. J Neurosci. 2006;26:5265–5275. doi: 10.1523/JNEUROSCI.4680-05.2006. [DOI] [PMC free article] [PubMed] [Google Scholar]
- Nam JH, Fettiplace R. Force transmission in the organ of Corti micromachine. Biophys J. 2010;98:2813–2821. doi: 10.1016/j.bpj.2010.03.052. [DOI] [PMC free article] [PubMed] [Google Scholar]
- Ohyama T, Groves AK. Generation of Pax2-Cre mice by modification of a Pax2 bacterial artificial chromosome. Genesis. 2004;38:195–199. doi: 10.1002/gene.20017. [DOI] [PubMed] [Google Scholar]
- Qian D, Jones C, Rzadzinska A, Mark S, Zhang X, Steel KP, Dai X, Chen P. Wnt5a functions in planar cell polarity regulation in mice. Dev Biol. 2007;306:121–133. doi: 10.1016/j.ydbio.2007.03.011. [DOI] [PMC free article] [PubMed] [Google Scholar]
- Rodríguez CI, Buchholz F, Galloway J, Sequerra R, Kasper J, Ayala R, Stewart AF, Dymecki SM. High-efficiency deleter mice show that FLPe is an alternative to Cre-loxP. Nat Genet. 2000;25:139–140. doi: 10.1038/75973. [DOI] [PubMed] [Google Scholar]
- Sakai K, Miyazaki Ji. A transgenic mouse line that retains Cre recombinase activity in mature oocytes irrespective of the cre transgene transmission. Biochem Biophys Res Commun. 1997;237:318–324. doi: 10.1006/bbrc.1997.7111. [DOI] [PubMed] [Google Scholar]
- Shotwell SL, Jacobs R, Hudspeth AJ. Directional sensitivity of individual vertebrate hair cells to controlled deflection of their hair bundles. Ann N Y Acad Sci. 1981;374:1–10. doi: 10.1111/j.1749-6632.1981.tb30854.x. [DOI] [PubMed] [Google Scholar]
- Song H, Hu J, Chen W, Elliott G, Andre P, Gao B, Yang Y. Planar cell polarity breaks bilateral symmetry by controlling ciliary positioning. Nature. 2010;466:378–382. doi: 10.1038/nature09129. [DOI] [PMC free article] [PubMed] [Google Scholar]
- Torban E, Patenaude AM, Leclerc S, Rakowiecki S, Gauthier S, Andelfinger G, Epstein DJ, Gros P. Genetic interaction between members of the Vangl family causes neural tube defects in mice. Proc Natl Acad Sci U S A. 2008;105:3449–3454. doi: 10.1073/pnas.0712126105. [DOI] [PMC free article] [PubMed] [Google Scholar]
- Wang J, Mark S, Zhang X, Qian D, Yoo SJ, Radde-Gallwitz K, Zhang Y, Lin X, Collazo A, Wynshaw-Boris A, Chen P. Regulation of polarized extension and planar cell polarity in the cochlea by the vertebrate PCP pathway. Nat Genet. 2005;37:980–985. doi: 10.1038/ng1622. [DOI] [PMC free article] [PubMed] [Google Scholar]
- Wang J, Hamblet NS, Mark S, Dickinson ME, Brinkman BC, Segil N, Fraser SE, Chen P, Wallingford JB, Wynshaw-Boris A. Dishevelled genes mediate a conserved mammalian PCP pathway to regulate convergent extension during neurulation. Development. 2006a;133:1767–1778. doi: 10.1242/dev.02347. [DOI] [PMC free article] [PubMed] [Google Scholar]
- Wang Y, Guo N, Nathans J. The role of Frizzled3 and Frizzled6 in neural tube closure and in the planar polarity of inner-ear sensory hair cells. J Neurosci. 2006b;26:2147–2156. doi: 10.1523/JNEUROSCI.4698-05.2005. [DOI] [PMC free article] [PubMed] [Google Scholar]
- Wansleeben C, Feitsma H, Montcouquiol M, Kroon C, Cuppen E, Meijlink F. Planar cell polarity defects and defective Vangl2 trafficking in mutants for the COPII gene Sec24b. Development. 2010;137:1067–1073. doi: 10.1242/dev.041434. [DOI] [PubMed] [Google Scholar]
- Wu J, Mlodzik M. The frizzled extracellular domain is a ligand for Van Gogh/Stbm during nonautonomous planar cell polarity signaling. Dev Cell. 2008;15:462–469. doi: 10.1016/j.devcel.2008.08.004. [DOI] [PMC free article] [PubMed] [Google Scholar]
- Yin H, Copley CO, Goodrich LV, Deans MR. Comparison of phenotypes between different vangl2 mutants demonstrates dominant effects of the Looptail mutation during hair cell development. PLoS One. 2012;7:e31988. doi: 10.1371/journal.pone.0031988. [DOI] [PMC free article] [PubMed] [Google Scholar]
- Yoshida N, Liberman MC. Stereociliary anomaly in the guinea pig: effects of hair bundle rotation on cochlear sensitivity. Hear Res. 1999;131:29–38. doi: 10.1016/S0378-5955(99)00008-8. [DOI] [PubMed] [Google Scholar]