

Abstract
Without the age-regulating protein klotho, mouse lifespan is shortened and the rapid onset of age-related disorders occurs. Conversely, overexpression of klotho extends mouse lifespan. Klotho is most abundant in kidney and expressed in a limited number of other organs, including the brain, where klotho levels are highest in choroid plexus. Reports vary on where klotho is expressed within the brain parenchyma, and no data is available as to whether klotho levels change across postnatal development. We used in situ hybridization to map klotho mRNA expression in the developing and adult rat brain and report moderate, widespread expression across grey matter regions. mRNA expression levels in cortex, hippocampus, caudate putamen, and amygdala decreased during the second week of life and then gradually rose to adult levels by postnatal day 21. Immunohistochemistry revealed a protein expression pattern similar to the mRNA results, with klotho protein expressed widely throughout the brain. Klotho protein co-localized with both the neuronal marker NeuN, as well as, oligodendrocyte marker olig2. These results provide the first anatomical localization of klotho mRNA and protein in rat brain parenchyma and demonstrate that klotho levels vary during early postnatal development.
Keywords: in situ hybridization, neurodevelopment, and aging
1. Introduction
Klotho (kl) is a type I transmembrane protein (Kuro-o et al., 1997; Shiraki-Iida et al., 1998) that is shed from the cell surface by ADAM 10/17 cleavage (Chen et al., 2007). Shed kl protein is detectable in serum and CSF (Imura et al., 2004), allowing humoral functions body-wide. Kl protein is expressed in a limited number of organs, with the highest levels in kidney (Kuro-o et al., 1997) where it maintains phosphate/calcium/vitamin D homeostasis via FGF23-mediated signaling (Kurosu et al., 2006). Kl also inhibits insulin/IGF-1 signaling, wnt signaling, TGF-β signaling, and modifies ion channels through its sialidase activity (Cha et al., 2008; Cha et al., 2009; Doi et al., 2011; Kurosu et al., 2005; Kurosu et al., 2006; Liu et al., 2007; Utsugi et al., 2000). Through its varied functions as a humoral factor and transmembrane protein, kl impacts the aging process. In addition to a dramatically shortened lifespan, kl knockout mice develop numerous age-related pathologies (Kuro-o et al., 1997; Nagai et al., 2003). Conversely, overexpression of kl in mice extends lifespan and increases resistance to oxidative stress (Kurosu et al., 2005). Human case reports demonstrate that major disruptions in kl expression or function produce extreme illness(Brownstein et al., 2008; Ichikawa et al., 2007), while minor polymorphic changes increase risk for multiple age-related disorders (Deary et al., 2005; Kawano et al., 2002; Kim et al., 2006; Kim et al., 2008). Kl protein levels decrease with age in the brain of rat, mouse, and non-human primate (Duce et al., 2008), and also decrease with age in human serum (Xiao et al., 2004), rodent liver and heart (Nabeshima, 2002; Shih and Yen, 2007).
Considering kl’s known roles as an age-regulating protein that affects oxidative stress, mineral homeostasis, and insulin signaling, it is critical to elucidate kl’s basic function(s) in the brain, the mechanisms by which its expression and/or function vary with age, and its possible role in the pathophysiology of central nervous system degenerative disorders. While much is known about kl function in kidney, considerably less is known about kl in brain. Kl knockout mice exhibit decreased memory retention compared to wild-type controls (Nagai et al., 2003) and have altered cholinergic function (Park et al., 2013). Kl knockout mice have fewer dopaminergic neurons (Kosakai et al., 2011), hippocampal neurons, and Purkinje cells, and show evidence of neuronal degeneration in cortex and hippocampus compared to wild-type mice (Kuro-o et al., 1997; Shiozaki et al., 2008). Kl knockout mouse brains are deficient in axonal transport (Uchida et al., 2001), have decreased synaptic protein expression (Li et al., 2004; Shiozaki et al., 2008), and increased markers of apoptosis (Nagai et al., 2003; Shiozaki et al., 2008) and oxidative stress (Nagai et al., 2003). To date, several reports characterized abnormalities in the kl knockout mouse brain, yet there is no anatomical map of kl expression in the brain of any species, or an understanding of how the protein functions in brain to cause the observed alterations.
Rat kl protein is 94% homologous to mouse kl, with an identical domain structure (Ohyama et al., 1998). Expression is likewise restricted to a limited number of organs with highest expression in kidney (Ohyama et al., 1998). Kl expression patterns in rat do not completely match patterns in mouse as kl is expressed in rat but not mouse lung (Kuro-o et al., 1997; Ohyama et al., 1998). Controversy exists over whether and where kl is expressed in the brain parenchyma (German et al., 2012). Outside of the choroid plexus, while kl mRNA is detected, evidence of protein expression by immunohistochemistry is limited (German et al., 2012). This may be the result of deficient detection tools, lower overall kl expression, a result of kl’s currently unknown function in brain, evidence that kl in brain is predominantly shed, and/or an indicator that although mRNA is transcribed it is not translated in brain.
Beyond the molecular cloning of rat kl, nothing is known about its mRNA or protein expression pattern in rat brain beyond confirmation that kl is age-downregulated in the rat brain as it is in rhesus monkey and mouse (Duce et al., 2008). Since rats have been used as models of brain aging for many decades(Gallagher et al., 2011), understanding and manipulating kl in rat is important and would open an array of widely used behavioral tests to more deeply understand its role in cognition. While available antibody tools clearly detect kl in kidney where its transmembrane form is most concentrated, these tools are less effective for immunohistochemistry in other organs where kl expression is anticipated to be much lower. In order to comprehensively assess kl expression in the rodent brain, we undertook a two-pronged approach of 1) detecting kl mRNA by radioactive in situ hybridization, and 2) confirming protein expression by immunohistochemistry with an antibody we verified would specifically detect kl protein. In addition, we report the mapping of kl mRNA expression during early postnatal rat neurodevelopment.
2. Results
2.1 Relative quantification of kl mRNA in the adult rat brain
Although reverse-transcriptase PCR has detected kl mRNA in rat brain (Ohyama et al., 1998), no information is available as to whether it is expressed in brain parenchyma or restricted to choroid plexus outside of the brain itself. In mouse brain, kl protein is detected from total brain homogenates (Chen et al., 2013; King et al., 2011) but localization by immunohistochemistry (IHC) remains controversial, with the exception of the choroid plexus. We used quantitative PCR (qPCR) to examine regional expression of kl and compare its expression levels across organ systems. Since kl expression is consistently highest in kidney across multiple species, detection of kl mRNA in rat kidney samples served as our positive control (Figure 1) (Kuro-o et al., 1997; Ohyama et al., 1998). As anticipated (Ohyama et al., 1998), kl mRNA was not detectible in liver, thus providing a negative control (Figure 1). Comparing kl mRNA expression from various brain areas, the highest kl level in brain tissue was detected in choroid plexus with lesser but clearly detectible kl mRNA in both grey matter (cortex)- and white matter (fimbria)-enriched brain samples (Figure 1).
Figure 1. Klotho mRNA detected in brain parenchyma.
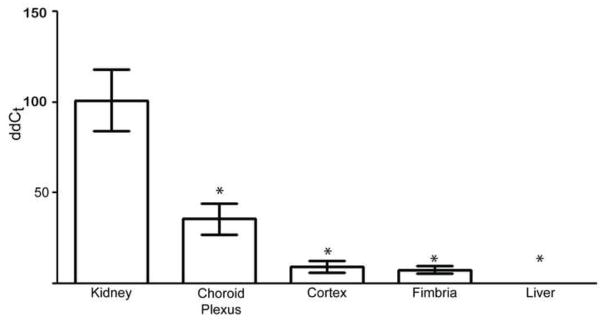
MRNA was extracted from adult rat tissue, converted to cDNA, and quantified relative to the Ct value of 18S ribosomal subunit and to kidney kl. As anticipated, kl levels were highest in kidney and undetectable in liver. Kl was also detected in tissue carefully punched from choroid plexus, cortex, and fimbria with highest expression in choroid plexus. (n=2 kidney and liver, n=4 for each brain region; +/− standard error of the mean; * p<0.0001 as determined by ANOVA).
2.2 kl protein expression in adult rat brain
While qPCR allows quantitative assessment of mRNA levels, it provides no information regarding anatomical or cell-type specific localization. In our hands, anti-kl antibody AF1819 was the only commercially available antibody that functioned in IHC and showed specific labeling in the convoluted tubules of kidney and choroid plexus of brain (Figure 2A–D). To verify antibody specificity, 8 week old wild-type and kl knockout mouse kidney and brain were likewise assessed (Figure 2E–G). As anticipated, specific staining consistent with the convoluted tubules was observed in the wild-type and was completely absent in the knockout mouse kidney (Figure 2E). In brain, the staining pattern in mouse was similar to that in rat with highest expression in choroid plexus but clear localization in brain parenchyma (Figure 2F). The kl knockout mouse is not a traditional knockout, but rather is an accidentally disrupted promoter. Kl mRNA has been detected by qPCR in the brain of kl knockout mice(Kuro-o et al., 1997). We confirmed this finding, detecting kl mRNA in knockout mice, albeit at lower levels than wild-type (data not shown). AF1819 immunostaining in kl knockout mouse brain tissue revealed low levels of kl protein in choroid plexus and brain parenchyma as would be expected if mRNA is present, although the level of detection was markedly lower compared to that in wild-type brain (Figure 2G).
Figure 2. Klotho protein is expressed in rat and mouse brain parenchyma.

For all panels AF1819 was used to detect kl (red) and nuclei were detected with DAPI (blue). A. Antibody specificity for AF1819 was validated in rat kidney. Signal was detected in structures consistent with distal convoluted tubules. Image taken at 20x. B. The antibody was further validated in brain tissue by observing the strongest signal in choroid plexus. Staining is appreciable in both white and grey matter of brain parenchyma, shown here by red signal in hippocampus and fimbria. Using the identical staining protocol, the absence of AF1819 (C) or its replacement with equal concentration of goat serum (D) shows no appreciable off target staining. Images were taken at 10x. Wild-type litermates and kl knockout mice were utilized to validate antibody specificity. E. As in rat kidney, in mouse kidney, AF1819 signal was detected in structures consistent with the distal convoluted tubule. No signal was detected when AF1819 was replaced with serum (second panel) or when AF1819 was incubated with knockout kidney sections (third panel). Wild-type (F) and kl knockout (G) brain was similarly assessed for kl protein expression. Specific expression was strongest in wild-type choroid plexus and appreciable in brain parenchyma (F). Markedly less expression was detected in the kl knockout, noted previously to be a severe hypomorph (Kuro-o et al., 1997) particularly in brain (G). No signal was detected in serum controls (third panel G and F). For brain, images were taken at 10x using identical exposure times. IHC was conducted on at least 3 independent animals.
As AF1819 performed as anticipated across species and in multiple tissues tested, we further examined kl protein expression in rat brain. Although levels were lower than in choroid plexus, kl protein expression was widely observed throughout the brain parenchyma (Figure 2B). Kl protein was expressed in grey matter including cortex and hippocampus, labeling neuronal cell bodies and processes particularly in cortex (Figure 3A). Kl protein was also detected in white matter (Figure 3B). In contrast to observations in grey matter where kl localization is consistent with a plasma membrane protein, in white matter, puncta directly adjacent to the oligodendrocyte nuclei were observed (Figure 3B). Although co-localization was observed with neuronal and oligodendrocytic markers, kl expression did not co-localize with microglial marker, Iba1, or astrocyte marker, GFAP (Figure 3D and E), although both cell types were closely associated with kl-expressing cells. Further, kl labeling was not apparent in myelinated processes, evident by lack of co-localization with MBP (Figure 3C). Confocal microscopy orthogonal projections confirm colocalization of kl in NeuN and olig2 but not GFAP expressing cells (Figure 3F, G, H).
Figure 3. Klotho protein is expressed in neurons and oligodendrocytes in rat brain.

For all panels AF1819 was used to detect kl (red) and nuclei were detected with DAPI (blue). A. Kl protein expression in cortex and hippocampus co-localizes with NeuN (green), a marker of neurons. Arrows indicate expression in processes, appreciable in some cortical layers. B. In white matter, represented here by fimbria, distinct kl labeling was detected (red). Kl co-localized in oligodrocytes (olig2 expression in nuclei is green) just adjacent to the nucleus. C,D, E. Kl did not co-localize with markers of myelinated processes (MBP), microglia (Iba1), or astrocytes (GFAP). IHC was conducted on at least 3 independent animals. A–E, Images were taken at 20x. To confirm expression in the same cells, confocal images with orthogonal projection were taken. Representative images are a single optical section (0.521μm) obtained using a 63x oil objective. NeuN is the green channel and kl is the red channel (F). Olig2 is the green channel and Klotho is the red channel (G). GFAP is the green channel and kl is the red channel (H).
To determine whether apparent neuronal labeling in vivo was the result of shed kl present in cerebrospinal fluid, we cultured rat neurons for 7 days in media. Kl antibody binding was detected in cultured neurons isolated from either cortex or hippocampus (Figure 4). In cultured neurons, kl expression was consistent with a plasma membrane localization and extended down the neuronal process in a distinct pattern from NeuN alone (Figure 4, merge). As before, no fluorescence was observed in control conditions (not shown).
Figure 4. Klotho protein expression in cultured neurons.
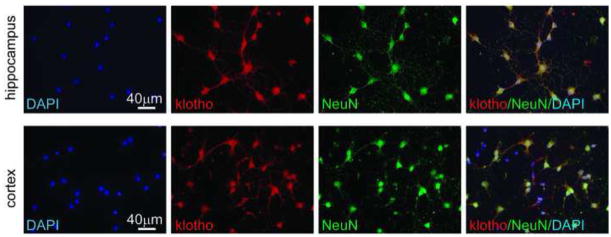
E18 neurons isolated from hippocampus or cortex were cultured for 7 days. Kl was detected with AF1819 (red). Neuronal cell type specificity was confirmed with NeuN (green). Nuclei were stained with DAPI (blue). IHC was repeated on 3 independent neuronal preparations with identical results. Images were taken at 40x.
2.3 Anatomical localization of mRNA by in situ hybridization
To insure our observations were not a spurious result from the single IHC-capable antibody we found, we sought to confirm anatomical localization of kl in neurons via an independent method. In situ hybridization was conducted to localize mRNA to specific brain regions and quantify regional kl expression differences across the brain. Similar to our IHC results with kl protein, kl mRNA was moderately, but widely distributed throughout the adult rat brain, showing differential regional distribution largely restricted to grey matter (Figure 5A; abbreviations defined in Table 1). Kl mRNA was present throughout adult rat cerebral cortex, including prelimbic cortex (PrL), cingulate (Cg), motor cortex (M1, M2), sensory cortex (S1), retrosplenial cortex (RS), and entorhinal cortex (Figure 5A,B). Kl was moderately expressed in the nucleus accumbens (Acb), septum, bed nucleus of the stria terminalis (BST) and caudate putamen (Cpu), with sparse labeling apparent in the globus pallidus (GP) (Figure 5A,B). Kl mRNA was also expressed in several hypothalamic nuclei, including the paraventricular nucleus (PVN), suprachiasmatic nucleus (SCN), medial preoptic area (MPA), anterior hypothalamus (AHA), arcuate nucleus (Arc), lateral hypothalamus (LH) and ventromedial hypothalamus (VMH) (Figure 5A,B). Higher levels of kl mRNA were visible in the hippocampus (Figure 5A,B), as well as several nuclei of the amygdala (Figure 5A,B). Kl mRNA was enriched in the anterior (A), mediodorsal (MD), and paraventricular nuclei of the thalamus, and moderately expressed throughout the rest of the thalamus, including the lateral dorsal (LD), centromedial (CM), rhomboid (Rh), reuniens (Re), and ventral posterior (VP) nuclei (Figure 5A,B). In the midbrain and pons, kl was enriched in the substantia nigra (SN), and showed fairly low expression in several nearby structures, including the superior colliculus (SC), periaquaductral grey (PAG), dorsal (DR) and median (MR) raphe, and pontine nuclei (Figure 5A,B).
Figure 5. Klotho mRNA distribution by in situ hybridization in the adult rat brain.

A. Autoradiograms from representative tissue sections of the adult rat brain at multiple rostro-caudal levels. Tissue was processed by in situ hybridization with an anti-sense S35-labelled riboprobe against rat kl mRNA. B. Kl mRNA signal was quantified in several brain regions of adult rats (n=3–4). Kl signal was widely expressed throughout the brain, including several cortical areas, forebrain structures, nuclei of the hypothalamus and thalamus, hippocampus and amygdala. For abbreviations, see Table 1.
Table 1.
Abbrevations
| A | anterior nucleus of thalamus |
| ac | anterior commisure |
| Acb | nucleus accumbens |
| AHA | anterior hypothalamic area |
| Arc | arcuate nucleus |
| BLA | basolateral amygdala |
| BM | basomedial nucleus of amygdala |
| BS | brainstem |
| BST | bed nucleus of the stria terminals |
| CA1 | hippocampus. Comu Ammonis 1 field of Ammon’s horn |
| CA2 | hippocampus. Comu Ammonis 2 field of Ammon’s horn |
| CA3 | hippocampus. Comu Ammonis 3 field of Ammon’s horn |
| Ce | central amygdaloid nucleus |
| Cg | cingulate |
| ChPlx | choriod plexus |
| CM | centromedial nucleus of thalamus |
| Co | cortical amygdaloid nucleus |
| Cpu | caudate putamen |
| DG | dentate gyrus |
| DLG | dorsal lateral geniculate nucleus |
| DMH | dorsomedlal hypothalamus |
| DR | dorsal raphe |
| Dtt | dorsal tenia tecta |
| Ent | entorhinal cortex |
| GP | globus pallidus |
| Hb | habenula |
| HPC | hippocampus |
| Hyp | hypothalamus |
| ICjM | islands of Calleja, major island |
| IG | indusium griseum |
| LA | lateroanterior hypothalamic nucleus |
| La | lateral amygdaloid nucleus |
| LD | lateral dorsal nucleus of thalamus |
| LH | lateral hypothalamus |
| LS | lateral septum |
| M1 | primary motor cortex |
| M2 | secondary motor cortex |
| MB | midbrain |
| MD | mediodorsal nucleus of thalamus |
| Me | medial amygdaloid nucleus |
| MG | medial geniculate nucleus |
| MnPo | median preoptic nucleus |
| MPA | medial preoptic area |
| MR | median raphe |
| MS | medial septum |
| PAG | periaquaductral grey |
| Pin | pineal gland |
| Pir | piriform cortex |
| Pn | pontine nuclei |
| Po | posterior nucleus of thalamus |
| PrL | prelimbic cortex |
| PV | paraventricular nucleus of thalamus |
| PVN | paraventricular nucleus of hypothalamus |
| PVP | paraventricular nucleus of thalamus, posterior part |
| Re | reuniens nucleus of thalamus |
| Rh | rhomboid nucleus of thalamus |
| Rt | reticular nucleus of thalamus |
| S | subiculum |
| SC | superior colliculus |
| SCN | suprachiasmatic nucleus |
| sm | stria medullaris of the thalamus |
| SN | substantia nigra |
| SON | supraoptic nucleus |
| TegN | tegmental nucleus |
| VM | ventromedial nucleus of thalamus |
| VMH | ventromedial hypothalamus |
| VP | ventral posterior nucleus of thalamus |
| ZI | zona incerta |
Until now, kl expression in brain has remained questionable, so we were surprised by the widespread distribution of kl mRNA apparent in the in situ hybridization experiment. To ensure specificity of the kl riboprobe, specific labeling was validated by incubating adjacent slides with rat kidney (Figure 6A) and brain (Figure 6B) tissue with either the anti-sense strand kl riboprobe or the sense strand kl riboprobe. Kl sense riboprobe produced minimal labeling in control sections from rat brain and kidney (Figure 6A, B). Meanwhile, the anti-sense riboprobe revealed very strong labeling in choroid plexus, as anticipated (Li et al., 2004) (Figure 6B). In an additional control experiment, a separate set of tissue sections were processed with anti-sense kl riboprobes and then emulsion-dipped and counterstained with hematoxylin. As anticipated, specific kl signal was indicated by a heavy concentration of silver grains around cell nuclei in select brain regions where we previously found high levels of kl mRNA (Figure 6C).
Figure 6. Klotho riboprobe validation in rat brain and kidney.

A, B. Images show autoradiograms of kidney (A) or brain (B) tissue sections processed for in situ hybridization with either the kl sense (top) or anti-sense (bottom) riboprobe for 3 days. As anticipated, only incubation with the anti-sense probe resulted in signal detection upon exposure to film. Kidney expression is restricted to the distal convoluted tubules (A). Brain expression is detected most strongly in choroid plexus (B, second section) however lower levels of signal are detected throughout the neuronal layers of the brain (A,C,E). Following incubation with the radioactive anti-sense kl riboprobe, slides were emulsion-dipped and counterstained with hematoxylin. Punctate signal overlaying nuclei and consistent with cellular localization is detected across the brain. Representative images are from amygdala, cortex, and hippocampus (n=3 adult rats, images taken at 20x).
2.4 Kl mRNA distribution in the developing rat brain
In addition to characterizing the pattern of kl mRNA expression in the adult brain, we examined its expression in the developing rat brain (postnatal day (P)1, P4, P7, P14, and P21). Kl mRNA was detected as early as P1 (Figure 7A). Kl is widely expressed throughout the developing rat brain, with a distribution pattern that closely resembled findings in adulthood (Figures 5 and 6). We selected four representative brain areas that could be identified at all postnatal time points selected (RS cortex, hippocampus, Cpu, and amygdala) for quantitative analysis to determine developmental patterns of kl mRNA expression (Figure 7).
Figure 7. Klotho mRNA in the developing rat brain.

A. Representative autoradiograms of tissue sections from rostral through caudal levels of brains collected at postnatal day (P) 1, P4, P7, P10, P14, or P21. Tissue was processed by in situ hybridization with an antisense S35-labelled riboprobe against rat kl mRNA. Similar to our observations in adult brain, kl mRNA was moderately but widely expressed across structures of the developing rat brain. B. We quantified kl mRNA levels in four representative brain areas: retrosplenial cortex, hippocampus, caudate putamen, and amygdala at postnatal day P1, P4, P7, P10, P14, P21, and P75. Kl mRNA was moderately expressed in the retrosplenial cortex during the first week of life, slightly dropped in the second week of life, and then peaked in adulthood. In both the hippocampus (CA regions as well as dentate gyrus) and caudate putamen, kl mRNA expression levels were slightly higher during the first postnatal week and then dropped to adult-like levels around the second week of life. Kl expression in the amygdala was fairly low during the first three weeks of life, but dramatically increased in adulthood. See Table 1 for abbreviations (n=3–4 brains per time-point, +/− standard error of the mean; repeated measures ANOVA with Fisher’s PLSD post-test, *p<0.05)
In the RS cortex, we found that kl mRNA expression varied across development (Figure 7B; main effect of age [F(133,6) =5.63, p<0.0001]). Post hoc tests showed that kl mRNA levels were higher in the adult (P75) RS cortex compared to P21, P14, P10, P7 and P1 (p<0.05 for each of those ages relative to P75). Kl expression also appeared to be higher during the first versus second week of life; post hoc showed that kl levels were significantly lower at P10 and P14 compared to P1, P4 and P7 (p<0.05 for each comparison). Within the hippocampus, we measured kl levels in the dentate gyrus (DG) and CA regions (averaged measurements from CA1–3). There was little variation of kl expression across developmental ages (no effect of age; p=0.46 and p=0.11 for CA regions and DG, respectively; Figure 7B). In the Cpu, kl expression varied with age (Figure 7C, main effect of age [F(133,6) =8.62, p<0.0001]). Post hoc tests showed that kl levels were highest at P1 versus P10, P14, P21, and P75 (p<0.01 for all comparisons), and lowest at P10 compared to all other ages (p<0.05 for all comparisons). Kl levels in Cpu were relatively high during the first week of life, dropped during the second to third week of life, then increased slightly by adulthood. In the amygdala we assessed kl expression in 4 nuclei -- the lateral amygdaloid nucleus (La), basolateral amygdala (BLA), medial amygdaloid nucleus (Me), and central amygdaloid nucleus (Ce) -- from P4 through P75 (P1 was omitted as it was difficult to identify all nuclei in all specimens). We found a similar developmental expression pattern across all nuclei where kl levels were generally lower during early life relative to adulthood (Figure 7B, main effect of age [F(133,5) =7.55, p<0.001 for La; F(133,5) =8.55, p<0.0001 for BLA; F(133,5) =7.90, p<0.0001 for Me; and F(133,5) =3.47, p<0.05 for Ce]). Post hoc analysis showed that in all 4 amygdalar nuclei, kl levels were significantly higher at P75 versus P4, P10, P14 and P21 (p<0.05 for all comparisons).
3. Discussion
The present study examined the distribution of kl mRNA and protein in postnatal developing and adult rat brain. We report similar patterns of kl mRNA and protein expression in the rat brain, with low-level (compared to choroid plexus), but widespread kl mRNA/protein apparent across many brain structures (Figures 2, 3 and 5). Co-localization experiments indicated that kl protein is present in neurons and oligodendrocytes (Figures 3 and 4). In addition to mapping mRNA and protein expression in adult rat brain, we further report widespread kl mRNA expression in the developing rat brain as early as P1 (Figure 7). We found that kl mRNA levels fluctuate with age, in most regions starting at relatively lower levels and increasing to around adult levels by P21 (Figure 7). These results indicate an important functional role for kl in the brain that may be consistent with those described in other organs or unique to functions of the brain, warranting further investigation.
To date, there has been some controversy as to whether kl is expressed in the brain. (German et al., 2012). Kl mRNA has been detected in brain since the initial characterization of the gene in 1999 (Kuro-o et al., 1997), and kl protein was detected by Western Blot in total brain homogenates (Chen et al., 2013; King et al., 2011). However, few reports described kl’s anatomical localization in the brain, leaving open the question of whether the effects of kl’s absence are 1) a result of shed kl produced in choroid plexus or 2) a result of endogenous expression within cells in the parenchyma. Our results indicate that kl mRNA is widely expressed in the rat brain (albeit at relatively low levels compared to the choroid plexus), which is consistent with the Allen Brain Atlas map of kl mRNA in the mouse brain (http://www.brain-map.org/). Detection of kl protein by IHC is inherently complicated by 1) kl shedding from the cell surface and the difficulty of detecting shed protein; 2) antibody specificity and functionality in IHC protocols; and 3) overall much lower kl protein levels outside of the kidney. We evaluated multiple antibodies and determined that, in our hands, only AF1819 worked in IHC, showing specific kl labeling in the kidney of wild-type mice but not kl knockout mice. Previously this antibody in combination with a single level of tyramide signal amplification did not reveal parenchymal expression in mouse (German et al., 2012). Using AF1819 similarly with the slightly more sensitive DAB colorimetric detection method, we saw hints that kl protein was present (not shown), indicating additional amplification was required. Since our kl mRNA results pointed to widespread expression in the brain, we modified our IHC protocol to increase the sensitivity of detection to amplify protein signal detection, which ultimately revealed similar patterns of kl mRNA and protein expression in brain. Considering the difficulty in detecting kl protein in the brain compared to kidney, we predict that unlike kidney (where transmembrane kl predominates), kl protein in the brain is in transmembrane form, but often shed from the cell surface making it more challenging to detect. If this indeed occurs, it would have important functional implications for kl in brain. Sialidase activity of kl in the kidney alters ion channel retention on the cell surface and subsequently ion flux (Cha et al., 2008; Cha et al., 2009). If kl acted similarly in the brain, synaptic activity could be modulated by the presence of kl in the synaptic cleft. Kl also inhibits numerous cell signaling pathways by binding ligand and preventing interaction with receptor. Inhibition of known kl-interacting proteins like wnt (Liu et al., 2007), TGF-β (Doi et al., 2011), and insulin/IGF-1 (Utsugi et al., 2000) as well as unidentified proteins in brain could affect numerous downstream processes.
We show that kl protein can be detected in the kl hypomorphic mouse brain, although as expected, kl protein is expressed at much lower levels than in wild-type animals (Figure 2F, G). This finding is not unanticipated based on the original characterization of the kl hypomorph/knockout; however, it complicates use of the model in brain research as in this mouse the kl gene is intact and integration of a transgene occurred in the promoter (Kuro-o et al., 1997). In the original report, evidence suggested that the promoter disruption alone provided an incomplete knockout in brain (Kuro-o et al., 1997). In a different line of investigation, kl protein expression in the promoter disrupted hypomorph could be turned on by controlling dietary phosphorus in males and dietary zinc in females (Morishita et al., 2001). Together these indicate that great care must be taken in considering whether the kl hypomorph is the best model for uncovering the role of kl in a given organ system. Moreover, studies in the brain, in particular, would greatly benefit from the use of a model mouse in which the kl gene itself is more traditionally disrupted. Conversely, the existing hypomorphic model provides a unique and potentially powerful way to study regulation of kl expression in various organ systems. As we know relatively little about the regulation of the kl gene, investigation into transcriptional regulatory factors involved in organ specific expression of kl expression are warranted.
In aging humans and non-human primates, white matter degeneration is common and widespread whereas grey matter remains largely intact outside of pathological conditions (Bartzokis et al., 2003; Peters, 2009). Age-related downregulation of kl has been observed in white matter (but not grey matter) in non-human primate and rodents (Duce et al., 2008; King et al., 2011). Our current results revealed kl expression in oligodendrocytes within white matter tracts as well as in other parts of the brain where oligodendrocytes and neurons coexist. As age-related downregulation of kl appears to be a specific phenomenon of white matter, our results indicate that such downregulation may occur via loss of kl in axons or oligodendrocytes in white matter during the aging process. Recent reports detected kl protein on the nuclear membrane where it may co-localize with the FGFR to affect nuclear signaling, akin to kl-FGFR interactions in kidney that mediate FGF23 signaling (German et al., 2012). While we saw some overlap of kl staining with nuclear markers in oligodendrocytes, our data likewise indicate that kl is near but outside of the nucleus (Figure 3). A function for kl expression on the nuclear envelope has not been determined, but our results further implicate a need to understand kl’s role(s) inside the cell.
The first three postnatal weeks represent a critical developmental period for rodent neural systems, evident in radical changes in behavior, neuroendocrine response, synaptic connectivity, and global neural gene expression (Eilam and Golani, 1988; Sapolsky and Meaney, 1986; Stead et al., 2006). Numerous genes exhibit distinct developmental expression patterns in the first weeks of life, so it is not surprising to find the same to be true with kl. It is interesting to see how these expression patterns vary across brain regions. For example, kl levels are fairly stable in the developing hippocampus, but in the RS cortex, kl mRNA levels are fairly high during the first week of life, drop from P10–21 and then markedly increase by adulthood. In the caudate putamen, kl is highest at P1 then drops to adult-like levels by P10 onward; in the amygdala, kl is moderately expressed through P21, but rapidly increases by adulthood. It is difficult to postulate the functional import of these changes since so little is known about kl function in the adult or developing brain. It is quite possible that kl plays distinct roles both at different points in neural development as well as within different brain regions during these times. Future experiments are certainly warranted to elucidate the role of kl in the brain across the lifespan. In addition to studying the functional implications of kl’s developmental expression pattern, it is also interesting to speculate what may be driving these expression changes. Other work revealed epigenetic mechanisms that regulate kl expression (Azuma et al., 2012; King et al., 2011). DNA methylation and other epigenetic modifications are dynamically changing in the developing and adult brain (Numata et al., 2012) and it is tempting to speculate that such mechanisms may underlie kl’s developmental expression changes.
In conclusion, our results demonstrate that kl mRNA and protein are detected throughout the brain parenchyma, co-localizing in neurons and oligodendrocytes. We likewise show that kl mRNA expression is developmentally regulated in early postnatal development, and previous work found that it is among a limited number of proteins to undergo age-related downregulation (Duce et al., 2008). Observations from kl knockout mouse brains implicate a neuroprotective role for the protein, and it is known to critically modulate numerous important homeostatic and signaling pathways. Our findings of widespread, low-level kl expression in brain represent an important first step that will pave the way to better understanding kl’s roles in brain function, the normal aging process in brain, and its implications for disease.
4. Experimental Procedures
4.1 Animals and tissue preparation
Male Sprague Dawley rats were euthanized from several developmental time points P1, P4, P7, P10, P14, P21, and P75 (adulthood, 350–400 g) n=6–8 per time point with no more than 2 pups from a single litter collected at a given timepoint). Animals were housed in standard conditions with free access to food and water. The kl knockout line was obtained from M. Kuroo (Kuro-o et al., 1997). 8 week old male KL knockout mice and wild-type litermate controls (n=3; 129/SvImJ strain) were used. KL knockout animals were closely monitored and provided Bacon Softies (BioServ, Frenchtown, NJ) or Gel-Diet (Clear H2O, Portland, ME) as they became unable to eat standard chow, ~weeks 6–8. All procedures were conducted in accordance with the National Institutes of Health (NIH) guidelines on laboratory animal use and care, using protocols approved by the University of Alabama at Birmingham Institutional Animal Care and Use Committee.
For in situ hybridization studies, rats were sacrificed by rapid decapitation. All tissues were removed, snap frozen, and stored at −80°C. Kidney served as a positive control for mRNA and protein studies as it is highly enriched in transmembrane kl (Kuro-o et al., 1997). Rat brains (n=3–4 per time point) and an adult rat kidney were cryostat-sectioned at 12 μm, thaw-mounted on Fisherbrand Superfrost Plus Microscope slides (Fisher Scientific, Suwanee, GA), and stored at −80°C until further processing. Slides were processed by in situ hybridization to assess kl mRNA expression at 240 μm intervals throughout the brain (described below). Brains used for immunohistochemistry were post-fixed in Bouin’s fix (Polysciences, Warrington, PA) and paraffin embedded prior to being sectioned via microtome at 10 μm.
4.2 qPCR
Using 300μm cryosections from rat brain, the fimbria, choroid plexus, cortex, and hippocampus were removed from the tissue using a 0.35 mm tissue punch (Harris Micro-Punch, Ted Pella, Redding, CA) and stored in RNAlater (Qiagen, Valencia, CA) at −20 °C. Tissue blocks of equal weight of either kidney or liver were similarly used. RNA was extracted from all tissues via RNeasy kit (Qiagen). Reverse transcription was performed using iScript RT Supermix per manufacture instructions (Biorad, Hercules, CA) to generate cDNA. cDNA was utilized in primer/probe based duplex qPCR reaction using SsoFast Probes Supermix with ROX (Biorad) and a StepOne qPCR system model 4369074 (Applied Biosystems, Foster City, CA). Primer/probes specific to either rat 18S ribosomal subunit (Rsp18) or rat kl were designed and synthesized by IDT (Coralville, IA). The HEX labeled Rps18 primer/probe mix contained the following: probe: 5′-HEX/CCGCCATGT/ZEN/CCCTAGTGATCCC/31ABkFQ/-3′, primer 1: 5′-CCTTAATGGCAGTGATAGCGA-3′, primer 2: 5′-CTCTTCCACAGGAGGCCTA-3′. The FAM labeled kl primer/probe mix contained following sequences: Probe: 5′-56-FAM/CCGTCCAAC/ZEN/ACGTAGGCTTTCAGAG/31ABkFQ/-3′, primer 1: 5′-GAATACGCAAAGTAGCCACAAAG-3′, primer 2: 5′-GAGCAAGACTCACTGAGGATG-3′. The samples were incubated at 95°C for 2 minutes and then cycled 40 times at 95°C for 15 seconds then 60°C for 60 seconds. Data was collected after each cycle. ΔCt for each tissue was determined by taking the absolute value of the difference between CtRps18 and Ctkl. ΔΔCt value was determined by ΔCtkidney − ΔCttissue. Fold difference was calculated by the following: 2−ΔΔCt. Significance was determined by one-way ANOVA and Dunnett’s Multiple Comparison test.
4.3 In situ hybridization
To generate a subclone for riboprobe synthesis, PCR was used to amplify a unique 500 nucleotide region of rat kl (NCBI GenBank accession #NM 031336; nucleotides 2895–3395) from a rat brain cDNA brain library (EdgeBiosystems, Gaithersburg, MD). Amplified cDNA segments were extracted (QIAquick Gel Extraction Kit, Qiagen), subcloned into a Bluescript vector, and then confirmed by restriction digestion and sequencing. Linearized probe template was generated by restriction enzyme digestion. The anti-sense strand kl probe was generated by digestion in Hind III, while the sense strand kl probe was generated by digestion in EcoR1 (New England Biolabs, Ipswitch, MA).
In situ hybridization processing was performed as previously described (Clinton et al., 2010; Clinton et al., 2011; Simmons et al., 2012). The kl probes were labeled in a reaction mixture consisting of 1 μg of linearized plasmid, 5 μl 5x transcription buffer (Epicenter Technologies, Madison, WI), 125 μCi of 35S-labeled-UTP, 125 μCi of 35S-CTP, 150 μM ATP and GTP, 12.5 mM dithiothreitol, 0.5 μl of RNase inhibitor, and 1.5 μl of T3 RNA polymerase. The labeled probe was purified using Micro Bio-Spin P-30 Tris Spin Columns (Bio-Rad Laboratories; Hercules, CA), then diluted in hybridization buffer (50% formamide, 10% dextran sulfate, 3xSSC, 50mM sodium phosphate buffer, pH 7.4, 1×Denhardt’s solution, 0.1 mg/ml yeast tRNA, and 10mM dithiothreitol) to yield 106 dpm/100 μl.
Tissue sections were fixed in 4% paraformaldehyde at room temperature for 1 hr. The slides were washed in 2x saline-sodium citrate (SSC, 300mM NaCl/30mM sodium citrate, pH 7.2), placed in a solution containing 0.25% acetic anhydride in 0.1M triethanolamine pH 8.0, for 10 min at room temperature, rinsed in distilled water, and dehydrated through graded ethanol washes. After air drying, tissue sections were hybridized overnight at 55°C with an anti-sense 35S-labeled cRNA probe for rat kl. Following hybridization, coverslips were removed and the slides were washed with 2X SSC for 5 min and incubated for 1 hr in RNaseA (200 μg/ml in 10 mM Tris buffer containing 0.5 M NaCl, pH 8) at 37°C, followed by multiple washes in increasingly stringent SSC solutions: 15 min in 2x SSC; 10 min in 1x SSC; 5 min in 0.5x SSC; 1 hr in 0.1x SSC heated to 55°C; an additional 1 hr in fresh 0.1X SSC heated to 55°C; and finally 5 min in room temperature 0.5X SSC. Slides were rinsed in distilled H2O, dehydrated through graded ethanol washes, air-dried, and exposed to Kodak XAR film (Eastman Kodak, Rochester, NY). Slides were exposed to film for 7 days; this development time was chosen after preliminary experiments determined it to be within the linear range of the development curve for the kl probe for the majority of brain regions of interest. After the 7 day exposure period, autoradiograms were developed and digitized using a ScanMaker 1000XL Pro flatbed scanner (Microtek, Carson, CA) with LaserSoft Imaging software (AG, Kiel, Germany) at 1,600 dpi. Digitized images were analyzed using ImageJ Analysis Software for PC (http://rsbweb.nih.gov/ij/). Specific signal, defined as 3.5x the standard deviation of individual pixel signal values above mean background signal, was converted to optical density and multiplied by the area of signal to produce integrated optical density (IOD).
To ensure the specificity of in situ hybridization signal, multiple control studies were performed. An additional set of slides containing sections through rat brain and kidney were processed as described above, except that half of the slides were treated with the anti-sense strand radiolabeled kl riboprobe and the other half were treated with a sense strand riboprobe. After the final SSC washes, H2O rinse, and dehydration through graded ethanol washes, a subset of the sense-probe and anti-sense probe treated slides were opposed to film for 3 days. An additional group of anti-sense probe-treated slides containing rat brain sections was dipped in Kodak NTB-2 emulsion, exposed to film at 4°C for 21 days prior to development and hematoxylin counterstain (Meador-Woodruff et al., 1989).
In situ hybridization results were visualized on autoradiographic film, and macroscopic images were compared to plates and diagrams from atlases of the adult and developing rat brain (Paxinos et al., 1994; Paxinos, 2004) for identification of structures. Digitized images were analyzed using ImageJ Analysis Software for PC from NIH. Optical density measurements relative to background were obtained for regions of interest in each animal at each time point. Each brain region was sampled across 5–8 tissue sections collected in 240 μm increments; measurements for a given region were taken from the right and left sides of the brain and averaged to produce a single data point from each rostro-caudal level, and then averaged across the 3 animals to provide data. We assessed the developmental pattern of kl mRNA expression in four brain regions (the retrosplenial cortex, hippocampus, caudate putamen, and amygdala) by repeated measures ANOVA, with rostro-caudal level as within subject factor and age as between subject factor. When necessary we used Fisher’s PLSD post-hoc tests. For all tests, α was 0.05. For all autoradiograms and photomicrographs, original images were exported to Adobe Photoshop for minor adjustments of brightness and contrast in final processing of images presented in this report.
4.4 Immunohistochemistry (IHC)
10 μm microtome sections of paraffin embedded brain and kidney were mounted on Superfrost slides (Fisher). Slides were dried overnight in a 42°C oven. Paraffin was removed and the tissue rehydrated by incubation in washes of Citrisolv (Fisher) and then isopropanol followed by washing in running distilled water. Antigen retrieval was performed in 10mM Citrate buffer, in a rice cooker. Once slides reached room temperature, they were washed in phosphate buffered saline (PBS). Sections were washed in PBS between each subsequent step. Endogenous peroxidases were inactivated in 0.3% H2O2. Cells were permeabilized in 0.5% TritonX 100 in PBS (PBST). Sections were blocked in blocking buffer (5% horse serum and 0.03% PBST) and then exposed to anti-kl antibody (1:20, AF1819; R and D Systems, Minneapolis, MN) diluted in 0.5% PBST overnight at 4°C. Antibody specificity was tested by incubation of sections with no primary, goat serum diluted to the same concentration as AF1819 (Figure 2), and in AF1819 preincubated with recombinant kl protein (not shown). Although the identical protocol was applied to all controls, no condition other than incubation in AF1819 produced a fluorescent signal. Sections were then incubated in ImmPRESS anti-goat Ig peroxidase (Vector Labs, Burlingame, CA). Sections were incubated in biotin-tyramide signal amplification (TSA) (1:100; Perkin Elmer, Waltham, MA) and then incubated in Vectastain ABC solution (Vector Labs), followed by incubated in Cy3-TSA Plus (1:400; Perkin Elmer). TSA was quenched in 0.3% hydrogen peroxide and incubated again in blocking buffer. Sections were incubated for 4 hr. at room temperature with cell-type specific antibodies. Neurons were labeled with neuron specific NeuN (Millipore, MAB377). Oligodendrocytes and myelin were labeled with myelin basic protein (MBP; Abcam ab62631) (Leonardo et al., 2010) or olig2 (Millipore MABN50). Microglia were labeled with IbaI (Wako, 019-19741). Astrocytes were labeled with glial fibrillary acidic protein (GFAP; DAKO Z033429) (Hansen et al., 1989). Sections were incubated in ImmPRESS anti-rabbit or anti-mouse peroxidase (Vector Labs), washed and incubated in FITC TSA Plus (1:400; Perkin Elmer). Sections were washed in PBS containing DAPI and mounted in Prolong Gold anti-fade mounting media (Invitrogen, Grand Island, NY). Slides were imaged on an Olympus BX53 fluorescent microscope (Center Valley, PA). Results were confirmed in 3–4 independent adult rat brains. Confocal images were captured on a Zeiss laser scanning LSM710 with a 63x, NA 1.4 oil-immersion objective.
4.5 Neuronal culture and immunocytochemistry (ICC)
Neuronal cultures were derived from cerebral cortex and hippocampus of fetal (embryonic day 17–19) rats. Cortex and hippocampus tissue was separated from meninges and digested using papain (Worthington, Lakewood, NJ) in calcium and magnesium free Hanks’ buffer solution (Invitrogen) for 20 minutes at 37°C. Tissue was dissociated using Pasteur pipette and cells were strained using 70 μm cell strainer (Fisher). After coverslips were coated overnight with poly-L-lysine (Sigma), 5×10⁴ cells were plated per well in 500 μl neurobasal media (GIBCO) supplemented with B-27 (Invitrogen), 0.001% penicillin streptomycin solution (Cellgro, Manassas, VA) and 0.0025% glutamine (Invitrogen). Cells were grown for 7 days with half of the media overlaying cells being replaced every three days. For immunohistochemistry, coverslips with neurons were fixed in 4% paraformaldehyde and a similar immunohistochemistry technique was followed as mentioned for tissue sections. Coverslips were exposed to anti-kl antibody and neuron specific NeuN. Following ImmPRESS anti-goat secondary incubation, Cy3-TSA Plus (1:400; Perkin Elmer) amplification was used for kl as mentioned and NeuN was labeled using Alexa488 (1:400, Invitrogen).
Highlights.
Klotho mRNA and protein are detected in rat brain parenchyma.
Klotho protein co-localizes in neurons and oligodendrocytes.
Neuronal expression of klotho is detected in vitro and in vivo.
Klotho mRNA is widely distributed throughout neuronal layers of the brain.
Klotho expression is developmentally regulated during early postnatal life.
Acknowledgments
We are grateful to Sharon Burke and the laboratory of Dr. Stanley Watson at the University of Michigan for designing and providing the subclone for the kl riboprobe. We are also grateful to Terry Lewis and the UAB Molecular Detection Core for vital help in developing the immunohistochemistry protocol (P30 NS047466). We thank the Alabama Neuroscience Blueprint Core Center (P30-NS57098), the UAB Intellectual and Developmental Disabilities Research Center (P30-HD38985), and the UAB Neuroscience Core (P30-NS47466) for instrumentation. This study was supported by NIH/NIMH R00 MH085859-03 (SMC) and NIH/NIA R00 AG034989 (GDK).
Abbreviations
- CSF
Cerebrospinal fluid
- DAB
diamino-benzidine
- FGFR
fibroblast growth factor receptor
- FGF23
fibroblast growth factor 23
- GFAP
glial fibrillary acidic protein
- IGF-1
insulin-like growth factor 1
- IHC
immunohistochemistry
- ICC
immunocytochemistry
- kl
klotho
- mRNA
messenger ribonucleic acid
- MBP
myelin basic protein
- P
postnatal
- qPCR
quantitative polymerase chain reaction
- TGFβ
transforming growth factor receptor beta
Footnotes
Role of Authors
All authors had full access to all of the data in the study and take responsibility for the integrity of the data and accuracy of the data analysis. Study concept and design: SMC, GDK. In situ hybridization: SMC. In situ hybridization quantification: MEG, SJM. Immunohistochemistry: GDK. qPCR: AML. Neuronal culture and ICC: AM. Microscopy: AM, GDK. Statistical analysis: RKS. Analysis, interpretation of data and drafting of the manuscript: SMC, GDK.
Publisher's Disclaimer: This is a PDF file of an unedited manuscript that has been accepted for publication. As a service to our customers we are providing this early version of the manuscript. The manuscript will undergo copyediting, typesetting, and review of the resulting proof before it is published in its final citable form. Please note that during the production process errors may be discovered which could affect the content, and all legal disclaimers that apply to the journal pertain.
References
- Azuma M, Koyama D, Kikuchi J, Yoshizawa H, Thasinas D, Shiizaki K, Kuro OM, Furukawa Y, Kusano E. Promoter methylation confers kidney-specific expression of the Klotho gene. FASEB J. 2012 doi: 10.1096/fj.12-211631. [DOI] [PMC free article] [PubMed] [Google Scholar]
- Bartzokis G, Cummings JL, Sultzer D, Henderson VW, Nuechterlein KH, Mintz J. White matter structural integrity in healthy aging adults and patients with Alzheimer disease: a magnetic resonance imaging study. Arch Neurol. 2003;60:393–8. doi: 10.1001/archneur.60.3.393. [DOI] [PubMed] [Google Scholar]
- Brownstein CA, Adler F, Nelson-Williams C, Iijima J, Li P, Imura A, Nabeshima Y, Reyes-Mugica M, Carpenter TO, Lifton RP. A translocation causing increased alpha-klotho level results in hypophosphatemic rickets and hyperparathyroidism. Proc Natl Acad Sci U S A. 2008;105:3455–60. doi: 10.1073/pnas.0712361105. [DOI] [PMC free article] [PubMed] [Google Scholar]
- Cha SK, Ortega B, Kurosu H, Rosenblatt KP, Kuro OM, Huang CL. Removal of sialic acid involving Klotho causes cell-surface retention of TRPV5 channel via binding to galectin-1. Proc Natl Acad Sci U S A. 2008;105:9805–10. doi: 10.1073/pnas.0803223105. [DOI] [PMC free article] [PubMed] [Google Scholar]
- Cha SK, Hu MC, Kurosu H, Kuro-o M, Moe O, Huang CL. Regulation of renal outer medullary potassium channel and renal K(+) excretion by Klotho. Mol Pharmacol. 2009;76:38–46. doi: 10.1124/mol.109.055780. [DOI] [PMC free article] [PubMed] [Google Scholar]
- Chen CD, Podvin S, Gillespie E, Leeman SE, Abraham CR. Insulin stimulates the cleavage and release of the extracellular domain of Klotho by ADAM10 and ADAM17. Proc Natl Acad Sci U S A. 2007;104:19796–801. doi: 10.1073/pnas.0709805104. [DOI] [PMC free article] [PubMed] [Google Scholar]
- Chen CD, Sloane JA, Li H, Aytan N, Giannaris EL, Zeldich E, Hinman JD, Dedeoglu A, Rosene DL, Bansal R, Luebke JI, Kuro-o M, Abraham CR. The antiaging protein Klotho enhances oligodendrocyte maturation and myelination of the CNS. J Neurosci. 2013;33:1927–39. doi: 10.1523/JNEUROSCI.2080-12.2013. [DOI] [PMC free article] [PubMed] [Google Scholar]
- Clinton SM, Bedrosian TA, Abraham AD, Watson SJ, Akil H. Neural and environmental factors impacting maternal behavior differences in high- versus low-novelty-seeking rats. Hormones and behavior. 2010;57:463–73. doi: 10.1016/j.yhbeh.2010.02.004. [DOI] [PMC free article] [PubMed] [Google Scholar]
- Clinton SM, Kerman IA, Orr HR, Bedrosian TA, Abraham AD, Simpson DN, Watson SJ, Akil H. Pattern of forebrain activation in high novelty-seeking rats following aggressive encounter. Brain Research. 2011;1422:20–31. doi: 10.1016/j.brainres.2011.08.033. [DOI] [PMC free article] [PubMed] [Google Scholar]
- Deary IJ, Harris SE, Fox HC, Hayward C, Wright AF, Starr JM, Whalley LJ. KLOTHO genotype and cognitive ability in childhood and old age in the same individuals. Neurosci Lett. 2005;378:22–7. doi: 10.1016/j.neulet.2004.12.005. [DOI] [PubMed] [Google Scholar]
- Doi S, Zou Y, Togao O, Pastor JV, John GB, Wang L, Shiizaki K, Gotschall R, Schiavi S, Yorioka N, Takahashi M, Boothman DA, Kuro-o M. Klotho inhibits transforming growth factor-beta1 (TGF-beta1) signaling and suppresses renal fibrosis and cancer metastasis in mice. J Biol Chem. 2011;286:8655–65. doi: 10.1074/jbc.M110.174037. [DOI] [PMC free article] [PubMed] [Google Scholar]
- Duce JA, Podvin S, Hollander W, Kipling D, Rosene DL, Abraham CR. Gene profile analysis implicates Klotho as an important contributor to aging changes in brain white matter of the rhesus monkey. Glia. 2008;56:106–17. doi: 10.1002/glia.20593. [DOI] [PubMed] [Google Scholar]
- Eilam D, Golani I. The ontogeny of exploratory behavior in the house rat (Rattus rattus): the mobility gradient. Dev Psychobiol. 1988;21:679–710. doi: 10.1002/dev.420210707. [DOI] [PubMed] [Google Scholar]
- Gallagher M, Stocker AM, Koh MT. Mindspan: lessons from rat models of neurocognitive aging. ILAR J. 2011;52:32–40. doi: 10.1093/ilar.52.1.32. [DOI] [PMC free article] [PubMed] [Google Scholar]
- German DC, Khobahy I, Pastor J, Kuro OM, Liu X. Nuclear localization of Klotho in brain: an anti-aging protein. Neurobiol Aging. 2012;33:1483 e25–30. doi: 10.1016/j.neurobiolaging.2011.12.018. [DOI] [PMC free article] [PubMed] [Google Scholar]
- Hansen SH, Stagaard M, Mollgard K. Neurofilament-like pattern of reactivity in human foetal PNS and spinal cord following immunostaining with polyclonal anti-glial fibrillary acidic protein antibodies. J Neurocytol. 1989;18:427–36. doi: 10.1007/BF01474540. [DOI] [PubMed] [Google Scholar]
- Ichikawa S, Imel EA, Kreiter ML, Yu X, Mackenzie DS, Sorenson AH, Goetz R, Mohammadi M, White KE, Econs MJ. A homozygous missense mutation in human KLOTHO causes severe tumoral calcinosis. J Clin Invest. 2007;117:2684–91. doi: 10.1172/JCI31330. [DOI] [PMC free article] [PubMed] [Google Scholar]
- Imura A, Iwano A, Tohyama O, Tsuji Y, Nozaki K, Hashimoto N, Fujimori T, Nabeshima Y. Secreted Klotho protein in sera and CSF: implication for post-translational cleavage in release of Klotho protein from cell membrane. FEBS Lett. 2004;565:143–7. doi: 10.1016/j.febslet.2004.03.090. [DOI] [PubMed] [Google Scholar]
- Kawano K, Ogata N, Chiano M, Molloy H, Kleyn P, Spector TD, Uchida M, Hosoi T, Suzuki T, Orimo H, Inoue S, Nabeshima Y, Nakamura K, Kuro-o M, Kawaguchi H. Klotho gene polymorphisms associated with bone density of aged postmenopausal women. J Bone Miner Res. 2002;17:1744–51. doi: 10.1359/jbmr.2002.17.10.1744. [DOI] [PubMed] [Google Scholar]
- Kim Y, Kim JH, Nam YJ, Kong M, Kim YJ, Yu KH, Lee BC, Lee C. Klotho is a genetic risk factor for ischemic stroke caused by cardioembolism in Korean females. Neurosci Lett. 2006;407:189–94. doi: 10.1016/j.neulet.2006.08.039. [DOI] [PubMed] [Google Scholar]
- Kim Y, Jeong SJ, Lee HS, Kim EJ, Song YR, Kim SG, Oh JE, Lee YK, Seo JW, Yoon JW, Koo JR, Kim HJ, Noh JW, Park SH. Polymorphism in the promoter region of the klotho gene (G-395A) is associated with early dysfunction in vascular access in hemodialysis patients. Korean J Intern Med. 2008;23:201–7. doi: 10.3904/kjim.2008.23.4.201. [DOI] [PMC free article] [PubMed] [Google Scholar]
- King GD, Rosene DL, Abraham CR. Promoter methylation and age-related downregulation of Klotho in rhesus monkey. Age (Dordr) 2011 doi: 10.1007/s11357-011-9315-4. [DOI] [PMC free article] [PubMed] [Google Scholar]
- Kosakai A, Ito D, Nihei Y, Yamashita S, Okada Y, Takahashi K, Suzuki N. Degeneration of mesencephalic dopaminergic neurons in klotho mouse related to vitamin D exposure. Brain Res. 2011;1382:109–17. doi: 10.1016/j.brainres.2011.01.056. [DOI] [PubMed] [Google Scholar]
- Kuro-o M, Matsumura Y, Aizawa H, Kawaguchi H, Suga T, Utsugi T, Ohyama Y, Kurabayashi M, Kaname T, Kume E, Iwasaki H, Iida A, Shiraki-Iida T, Nishikawa S, Nagai R, Nabeshima YI. Mutation of the mouse klotho gene leads to a syndrome resembling ageing. Nature. 1997;390:45–51. doi: 10.1038/36285. [DOI] [PubMed] [Google Scholar]
- Kurosu H, Yamamoto M, Clark JD, Pastor JV, Nandi A, Gurnani P, McGuinness OP, Chikuda H, Yamaguchi M, Kawaguchi H, Shimomura I, Takayama Y, Herz J, Kahn CR, Rosenblatt KP, Kuro-o M. Suppression of aging in mice by the hormone Klotho. Science. 2005;309:1829–33. doi: 10.1126/science.1112766. [DOI] [PMC free article] [PubMed] [Google Scholar]
- Kurosu H, Ogawa Y, Miyoshi M, Yamamoto M, Nandi A, Rosenblatt KP, Baum MG, Schiavi S, Hu MC, Moe OW, Kuro-o M. Regulation of fibroblast growth factor-23 signaling by klotho. J Biol Chem. 2006;281:6120–3. doi: 10.1074/jbc.C500457200. [DOI] [PMC free article] [PubMed] [Google Scholar]
- Leonardo CC, Hall AA, Collier LA, Green SM, Willing AE, Pennypacker KR. Administration of a Sigma Receptor Agonist Delays MCAO-Induced Neurodegeneration and White Matter Injury. Transl Stroke Res. 2010;1:135–145. doi: 10.1007/s12975-009-0005-9. [DOI] [PMC free article] [PubMed] [Google Scholar]
- Li SA, Watanabe M, Yamada H, Nagai A, Kinuta M, Takei K. Immunohistochemical localization of Klotho protein in brain, kidney, and reproductive organs of mice. Cell Struct Funct. 2004;29:91–9. doi: 10.1247/csf.29.91. [DOI] [PubMed] [Google Scholar]
- Liu H, Fergusson MM, Castilho RM, Liu J, Cao L, Chen J, Malide D, Rovira, Schimel D, Kuo CJ, Gutkind JS, Hwang PM, Finkel T. Augmented Wnt signaling in a mammalian model of accelerated aging. Science. 2007;317:803–6. doi: 10.1126/science.1143578. [DOI] [PubMed] [Google Scholar]
- Meador-Woodruff JH, Mansour A, Bunzow JR, Van Tol HH, Watson SJ, Jr, Civelli O. Distribution of D2 dopamine receptor mRNA in rat brain. Proceedings of the National Academy of Sciences of the United States of America. 1989;86:7625–8. doi: 10.1073/pnas.86.19.7625. [DOI] [PMC free article] [PubMed] [Google Scholar]
- Morishita K, Shirai A, Kubota M, Katakura Y, Nabeshima Y, Takeshige K, Kamiya T. The progression of aging in klotho mutant mice can be modified by dietary phosphorus and zinc. J Nutr. 2001;131:3182–8. doi: 10.1093/jn/131.12.3182. [DOI] [PubMed] [Google Scholar]
- Nabeshima Y. Ectopic calcification in Klotho mice. Clin Calcium. 2002;12:1114–7. [PubMed] [Google Scholar]
- Nagai T, Yamada K, Kim HC, Kim YS, Noda Y, Imura A, Nabeshima Y, Nabeshima T. Cognition impairment in the genetic model of aging klotho gene mutant mice: a role of oxidative stress. FASEB J. 2003;17:50–2. doi: 10.1096/fj.02-0448fje. [DOI] [PubMed] [Google Scholar]
- Numata S, Ye T, Hyde TM, Guitart-Navarro X, Tao R, Wininger M, Colantuoni C, Weinberger DR, Kleinman JE, Lipska BK. DNA methylation signatures in development and aging of the human prefrontal cortex. Am J Hum Genet. 2012;90:260–72. doi: 10.1016/j.ajhg.2011.12.020. [DOI] [PMC free article] [PubMed] [Google Scholar]
- Ohyama Y, Kurabayashi M, Masuda H, Nakamura T, Aihara Y, Kaname T, Suga T, Arai M, Aizawa H, Matsumura Y, Kuro-o M, Nabeshima Y, Nagail R. Molecular cloning of rat klotho cDNA: markedly decreased expression of klotho by acute inflammatory stress. Biochem Biophys Res Commun. 1998;251:920–5. doi: 10.1006/bbrc.1998.9576. [DOI] [PubMed] [Google Scholar]
- Park SJ, Shin EJ, Min SS, An J, Li Z, Hee Chung Y, Hoon Jeong J, Bach JH, Nah SY, Kim WK, Jang CG, Kim YS, Nabeshima YI, Nabeshima T, Kim HC. Inactivation of JAK2/STAT3 Signaling Axis and Downregulation of M1 mAChR Cause Cognitive Impairment in klotho Mutant Mice, a Genetic Model of Aging. Neuropsychopharmacology. 2013 doi: 10.1038/npp.2013.39. [DOI] [PMC free article] [PubMed] [Google Scholar]
- Paxinos G, Ashwell KWS, Tork I. Atlas of the Developing Rat Nervous System. Academic Press; New York: 1994. [Google Scholar]
- Paxinos G. The Rat nervous system. Elsevier Academic Press; Amsterdam; Boston: 2004. [Google Scholar]
- Peters A. The effects of normal aging on myelinated nerve fibers in monkey central nervous system. Front Neuroanat. 2009;3:11. doi: 10.3389/neuro.05.011.2009. [DOI] [PMC free article] [PubMed] [Google Scholar]
- Sapolsky RM, Meaney MJ. Maturation of the adrenocortical stress response: neuroendocrine control mechanisms and the stress hyporesponsive period. Brain Research. 1986;396:64–76. doi: 10.1016/s0006-8993(86)80190-1. [DOI] [PubMed] [Google Scholar]
- Shih PH, Yen GC. Differential expressions of antioxidant status in aging rats: the role of transcriptional factor Nrf2 and MAPK signaling pathway. Biogerontology. 2007;8:71–80. doi: 10.1007/s10522-006-9033-y. [DOI] [PubMed] [Google Scholar]
- Shiozaki M, Yoshimura K, Shibata M, Koike M, Matsuura N, Uchiyama Y, Gotow T. Morphological and biochemical signs of age-related neurodegenerative changes in klotho mutant mice. Neuroscience. 2008;152:924–41. doi: 10.1016/j.neuroscience.2008.01.032. [DOI] [PubMed] [Google Scholar]
- Shiraki-Iida T, Aizawa H, Matsumura Y, Sekine S, Iida A, Anazawa H, Nagai R, Kuro-o M, Nabeshima Y. Structure of the mouse klotho gene and its two transcripts encoding membrane and secreted protein. FEBS Lett. 1998;424:6–10. doi: 10.1016/s0014-5793(98)00127-6. [DOI] [PubMed] [Google Scholar]
- Simmons RK, Howard JL, Simpson DN, Akil H, Clinton SM. DNA methylation in the developing hippocampus and amygdala of anxiety-prone versus risk-taking rats. Dev Neurosci. 2012;34:58–67. doi: 10.1159/000336641. [DOI] [PMC free article] [PubMed] [Google Scholar]
- Stead JD, Neal C, Meng F, Wang Y, Evans S, Vazquez DM, Watson SJ, Akil H. Transcriptional profiling of the developing rat brain reveals that the most dramatic regional differentiation in gene expression occurs postpartum. Journal of Neuroscience. 2006;26:345–53. doi: 10.1523/JNEUROSCI.2755-05.2006. [DOI] [PMC free article] [PubMed] [Google Scholar]
- Uchida A, Komiya Y, Tashiro T, Yorifuji H, Kishimoto T, Nabeshima Y, Hisanaga S. Neurofilaments of Klotho, the mutant mouse prematurely displaying symptoms resembling human aging. J Neurosci Res. 2001;64:364–70. doi: 10.1002/jnr.1087. [DOI] [PubMed] [Google Scholar]
- Utsugi T, Ohno T, Ohyama Y, Uchiyama T, Saito Y, Matsumura Y, Aizawa H, Itoh H, Kurabayashi M, Kawazu S, Tomono S, Oka Y, Suga T, Kuro-o M, Nabeshima Y, Nagai R. Decreased insulin production and increased insulin sensitivity in the klotho mutant mouse, a novel animal model for human aging. Metabolism. 2000;49:1118–23. doi: 10.1053/meta.2000.8606. [DOI] [PubMed] [Google Scholar]
- Xiao NM, Zhang YM, Zheng Q, Gu J. Klotho is a serum factor related to human aging. Chin Med J (Engl) 2004;117:742–7. [PubMed] [Google Scholar]