

Mechanisms accounting for the role of Net1 in cell proliferation have not been described. This study shows that Net1 plays a Rho GTPase–independent role in controlling mitotic spindle assembly and kinetochore attachment and is required for centrosome activation of Pak2 and Aurora A.
Abstract
Neuroepithelial transforming gene 1 (Net1) is a RhoA-subfamily–specific guanine nucleotide exchange factor that is overexpressed in multiple human cancers and is required for proliferation. Molecular mechanisms underlying its role in cell proliferation are unknown. Here we show that overexpression or knockdown of Net1 causes mitotic defects. Net1 is required for chromosome congression during metaphase and generation of stable kinetochore microtubule attachments. Accordingly, inhibition of Net1 expression results in spindle assembly checkpoint activation. The ability of Net1 to control mitosis is independent of RhoA or RhoB activation, as knockdown of either GTPase does not phenocopy effects of Net1 knockdown on nuclear morphology, and effects of Net1 knockdown are effectively rescued by expression of catalytically inactive Net1. We also observe that Net1 expression is required for centrosomal activation of p21-activated kinase and its downstream kinase Aurora A, which are critical regulators of centrosome maturation and spindle assembly. These results identify Net1 as a novel regulator of mitosis and indicate that altered expression of Net1, as occurs in human cancers, may adversely affect genomic stability.
INTRODUCTION
Proper completion of mitosis is required for maintenance of genomic integrity. Mechanisms controlling mitotic progression are incompletely understood. Among the key regulators of mitosis and cytokinesis are the Rho-family small G proteins RhoA and Cdc42. For example, RhoA regulates centrosome duplication and positioning, cortical actin contraction, cleavage furrow specification, and ingression (Kishi et al., 1993; Drechsel et al., 1997; Chevrier et al., 2002; Maddox and Burridge, 2003; Yoshizaki et al., 2003; Ma et al., 2006). In addition, Cdc42 activation is necessary for the formation of kinetochore attachments before metaphase (Yasuda et al., 2004). Thus, although RhoA and Cdc42 function are clearly necessary for mitosis and cell division, regulatory mechanisms controlling their activities are not fully described.
Rho GTPase activity is controlled by three classes of proteins: Rho guanine nucleotide exchange factors (RhoGEFs), Rho GTPase–activating proteins, and Rho guanine nucleotide dissociation inhibitors (Jaffe and Hall, 2005). In this regulatory paradigm, the RhoGEFs are responsible for GTP loading of Rho proteins to initiate downstream signaling. The RhoGEF family consists of nearly 70 gene products (Rossman et al., 2005), several of which have been shown to participate in mitosis and cytokinesis. For instance, the RhoGEF Ect2 controls Cdc42 activity during prometaphase to regulate kinetochore attachments (Tatsumoto et al., 2003; Oceguera-Yanez et al., 2005). Similarly, GEF-H1/Lfc affects kinetochore assembly in some cell types by regulating RhoA activity (Bakal et al., 2005). Alternatively, ARHGEF10 controls centrosome duplication via activation of RhoA (Aoki et al., 2009). In addition, Ect2, GEF-H1/Lfc, and MyoGEF act in distinct temporal and spatial patterns to control RhoA activation during cytokinesis (Tatsumoto et al., 1999; Kimura et al., 2000; Yuce et al., 2005; Chalamalasetty et al., 2006; Wu et al., 2006; Birkenfeld et al., 2007; Asiedu et al., 2009).
The neuroepithelial transforming gene 1 (Net1) is a RhoA-subfamily specific GEF that has also been reported to control cell proliferation (Leyden et al., 2006; Dutertre et al., 2010). It was first identified in a screen for novel oncogenes and is overexpressed in a number of human cancers (Chan et al., 1996; Leyden et al., 2006; Shen et al., 2008; Tu et al., 2010). Two isoforms of Net1 exist in most cells, Net1 and Net1A, which are identical except for divergent N-terminal regulatory domains (Qin et al., 2005). Net1 proteins are exceptional among RhoGEFs in that they localize to the nucleus by virtue of multiple N-terminal nuclear localization signal (NLS) sequences. Nuclear localization is believed to act as a negative regulatory mechanism to prevent Net1 isoforms from accessing plasma membrane–associated RhoA (Sander et al., 1999; Qin et al., 2005; Carr et al., 2012). Although most studies have not focused on the function of individual Net1 isoforms, recent work indicates that Net1 isoforms may fulfill widely divergent roles in the cell. For example, we recently showed that the Net1A isoform preferentially controls cell spreading and focal adhesion maturation downstream of Rac1 in breast cancer cells (Carr et al., 2012). In contrast, Net1 expression is differentially regulated by transforming growth factor β (TGFβ) and estradiol, and this longer isoform has been implicated in controlling cell proliferation (Dutertre et al., 2010; Papadimitriou et al., 2011). Thus it is likely that Net1 isoforms are uniquely regulated to control distinct cellular events.
In the present work we investigate the role of Net1 isoforms in controlling mitotic progression. We find that the Net1 isoform plays a crucial, RhoA-independent role in controlling early events during mitosis. Net1 expression is necessary for proper chromosome alignment and spindle assembly and is associated with unstable kinetochore attachments and spindle assembly checkpoint activation. Net1 is also required for efficient activation of Aurora kinase A and its upstream activator, p21-activated kinase (Pak2), which are critical kinases required for centrosome maturation and spindle assembly. These findings indicate that Net1 plays a novel, Rho GTPase-independent role in controlling mitotic kinase activation and mitotic progression and suggest that aberrant regulation of Net1 expression in human cancer may adversely affect genomic stability.
RESULTS
Net1 overexpression causes abnormal nuclear morphology
Net1 expression is important for cell proliferation (Dutertre et al., 2010; Leyden et al., 2006), but mechanisms accounting for this effect have not been identified. We reasoned that Net1 might contribute to mitotic progression, since other RhoGEFs have also been shown to regulate mitosis and cytokinesis (Narumiya and Yasuda, 2006). Hemagglutinin (HA)-epitope tagged wild-type Net1, Net1A, or Net1ΔN was expressed in asynchronously growing HeLa cells (Figure 1B). Net1ΔN is a cytoplasmic form of Net1 that constitutively activates RhoA and is transforming in NIH3T3 cells (Alberts and Treisman, 1998; Schmidt and Hall, 2002; Garcia-Mata et al., 2007). Two days later the cells were fixed and stained for Net1 expression, α-tubulin, and DNA. Transfected cells exhibiting abnormal nuclear morphologies were then scored as multinucleated (multiple nuclei of equal size), containing micronuclei (multiple unequally sized nuclei), or containing misshapen nuclei (multilobed, irregularly shaped nuclei). Of importance, the presence of micronuclei or abnormally shaped single nuclei is indicative of errors occurring during mitosis, whereas the presence of multiple, normally shaped nuclei is indicative of errors during cytokinesis (Tatsumoto et al., 1999; Holland and Cleveland, 2012). Representative examples of Net1 isoform–transfected cells and quantification of three independent experiments are shown in Figure 1, A and C. In these experiments, ∼6% of untransfected HeLa cells exhibited abnormal nuclei with morphologies that were evenly distributed among the three phenotypes. On the other hand, cells that overexpressed HA-Net1 exhibited nearly 10 times more abnormal nuclei, with 30% of the cells containing micronuclei,16% containing misshapen nuclei, and 10% multinucleated. In contrast, only 34% of the HA-Net1A–overexpressing cells exhibited abnormal nuclei, with these cells being evenly distributed between micronuclei and multinuclei phenotypes. Cells expressing the N-terminal deletion mutant Net1ΔN also exhibited a high percentage of abnormal nuclei (57%). The majority of these cells, however, showed a multinuclear phenotype (42%), with only a small percentage of cells containing micronuclei (7%) or misshapen single nuclei (8%). Thus these data suggest that Net1 or Net1A overexpression mainly causes errors during mitosis, whereas Net1ΔN expression causes errors during cytokinesis. The effect of Net1ΔN is consistent with the phenotype caused by constitutively active RhoA expression, which also inhibits cytokinesis in HeLa cells (Morin et al., 2009). Intriguingly, the effects of Net1 and Net1A overexpression were qualitatively different, as Net1 overexpression caused the accumulation of cells with micronuclei far more frequently than Net1A.
FIGURE 1:

Overexpression of Net1 isoforms causes nuclear morphology defects. (A) HeLa cells were transfected with HA-Net1, HA-Net1A, or HA-Net1ΔN. Two days later the cells were fixed and stained for HA-epitope proteins (green), α-tubulin (red), and DNA (blue). Shown are representative micrographs. Bar, 10 μm. (B) Functional domains in Net1 proteins. DH, Dbl homology domain; PH, pleckstrin homology domain; orange ovals, nuclear localization signal sequences; purple ovals, C-terminal PDZ domain–binding site; blue bar, Net1-specific sequence (amino acids 1–85); green bar, Net1A-specific sequence (amino acids 1–31); numbers refer to amino acids for mouse Net1 proteins. (C) Quantification of defects in nuclear morphology. Average of three independent experiments. Errors are SEM. Statistical significance compared with control values was determined by Student's t test; *p < 0.05; **p < 0.01; ***p < 0.001.
Net1 depletion causes micronucleus formation
Because overexpression of the two Net1 isoforms had distinct effects on nuclear morphology, we tested the requirement for each isoform during mitosis using RNA interference. Short hairpin RNAs (shRNAs) specific for Net1, Net1A, or both isoforms were constructed. HeLa cells were then transfected with each shRNA plasmid and allowed to proliferate. Cells expressing the shRNAs were detected by coexpression of hMGFP from the same plasmid or selection of cells for a coexpressed puromycin resistance gene. Figure 2, A and B, shows representative micrographs from the 48-h time point and quantification of results from three independent experiments. In these experiments <5% of the cells expressing a nontargeting, control shRNA exhibited abnormal nuclei. Similarly, knockdown of Net1A did not cause a significant increase in abnormal nuclear morphology (7%). Depletion of Net1 alone, however, or both Net1 isoforms together caused more than one-fourth of the cells to accumulate abnormal nuclei (Figure 2, A and B). All shRNAs were specific for their intended Net1 isoforms, as assessed by real-time quantitative PCR (qPCR) and Western blotting (Figure 2, C and D). Thus these results indicate that endogenous Net1, but not Net1A, is required for proper completion of mitosis in HeLa cells. Similar results were observed in U20S osteosarcoma and nontransformed human foreskin fibroblasts (unpublished data).
FIGURE 2:

Net1 knockdown results in aberrant nuclear morphology. HeLa cells were transfected with isoform-specific shRNA sequences in plasmids coexpressing either hMGFP or puromycin resistance genes. At 48 or 72 h later cells were fixed for immunofluorescence analysis or collected for real-time qPCR and Western blot analysis. (A) Immunofluorescence images of cells expressing nontargeting control, Net1, Net1A, or Net1/Net1A shRNAs. shRNA-transfected cells expressed hMGFP and were stained for α-tubulin (red) and DNA (blue). Bar, 10 μm. (B) Quantification of aberrant nuclear morphology in shRNA-transfected cells selected with puromycin. Average of at least three independent experiments. Errors are SEM. Statistical significance was determined by Student's t test; *p < 0.05; **p < 0.01; ***p < 0.001. (C) Real-time qPCR analysis of Net1 and Net1A transcript expression. Transcript levels are normalized to GAPDH. Errors are SEM. (D) Representative Western blot analysis of whole-cell lysates from shRNA-transfected cells. Upper band, Net1; lower band, Net1A.
Net1 is required for proper mitotic progression
To evaluate the effect of Net1 depletion on mitotic progression, we performed live imaging of HeLa cells transfected with control and Net1 small interfering RNAs (siRNAs), plus an expression plasmid for histone H2B-mCherry to visualize chromatin. Live cell imaging confirmed that loss of Net1 expression had a profound effect on the ability of cells to progress through mitosis. Control siRNA–transfected cells completed mitosis in an average of 45 min, in agreement with previously published results in this cell type (Figure 3A; Yoshizaki et al., 2003; Oceguera-Yanez et al., 2005; Schmidt et al., 2007). However, ∼60% of the Net1-depleted cells never completed mitosis during the 4-h imaging period. The remaining cells were significantly delayed in mitotic progression, requiring 90–160 min to complete cell division (Figure 3, B and C). In arrested cells it was apparent that some of the chromatin never properly aligned to the metaphase plate. This type of defect would be expected to engage the spindle assembly checkpoint and prevent cells from entering anaphase. In the cells that completed mitosis, quantification revealed a significant delay in progression from prometaphase to metaphase, as well as from metaphase to anaphase. There was no discernible delay in progression from anaphase to telophase (Figure 3C). Of importance, the cells that progressed through anaphase often contained one or more lagging chromosomes, suggesting that spindle attachments were aberrant. Thus these results indicate that Net1 expression is required for cells to align all of their chromosomes on the metaphase plate and faithfully progress through mitosis. These data also explain why we observed so many Net1-knockdown cells with misshapen nuclei or micronuclei, since these phenotypes typically occur after errors in chromatin separation during mitosis.
FIGURE 3:
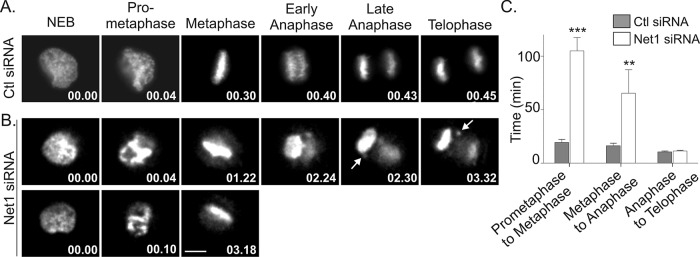
Net1 depletion interferes with mitotic progression. HeLa cells were transfected with control or Net1-specific siRNAs. One day later the cells were retransfected with a plasmid expressing mCherry-H2B. Live cell imaging was performed 2 d after that to monitor mitotic progression. (A) Representative still frames from control siRNA–transfected cells. The time elapsed from nuclear envelope breakdown is shown in the lower right-hand corner (minutes). (B) Mitotic progression in two different Net1 siRNA–transfected cells. Middle, arrows indicate lagging chromosomes. Bar, 10 μm. (C) Quantification of time required to progress through different phases of mitosis in control and Net1 siRNA–transfected cells. Errors are SEM. Statistical significance was determined by Student's t test; **p < 0.01; ***p < 0.001.
Net1 is required for proper chromosome congression and sister chromatid separation
To more precisely define mitotic defects associated with Net1 depletion, we examined the phenotype of fixed cells in metaphase and anaphase that were expressing Net1-isoform–targeting shRNAs. In these experiments we observed that cells transfected with nontargeting control shRNA or Net1A-specific shRNA were able to properly align their chromatin at the metaphase plate (Figure 4A). In contrast, cells that were depleted of either Net1 alone or both Net1 and Net1A exhibited misaligned, calcium-responsive transactivator (CREST)–positive chromosomes (Figure 4A). As a way to quantitatively assess this congression defect, we measured the area of condensed chromatin, including outlying chromosomes. In this analysis the nontargeting shRNA control cells showed an average chromatin area of 78.0 μm2 (Figure 4B). Net1A-knockdown cells did not vary significantly, with an average chromatin area of 76 μm2. Cells with Net1-specific depletion, however, as well as cells lacking both Net1 and Net1A, exhibited a >50% increase in chromatin area (114 and 125 μm2, respectively; Figure 4C). Hence loss of Net1 significantly compromises the ability of cells to align their chromosomes during metaphase.
FIGURE 4:

Net1 is required for chromosome congression and separation. (A) HeLa cells were transfected with control or Net1 isoform–specific shRNA expression plasmids. Two days later the cells were fixed and stained for the kinetochore antigen CREST (red), α-tubulin (green), and DNA (blue). Transfected cells were visualized by coexpression of enhanced green fluorescent protein (eGFP) from the same plasmid (not shown). Cells were imaged from the top down. Representative micrographs are depicted. Bar, 10 μm. (B) Quantification of chromatin area from three independent experiments. Bars are median values. Statistical significance compared with control values was determined by Student's t test; ***p < 0.001. (C) HeLa cells were transfected with control or Net1 isoform–specific shRNA expression plasmids. Two days later the cells were fixed and stained for CREST (red), α-tubulin (green), and DNA (blue). Transfected cells were visualized by coexpression of eGFP from the same plasmid (not shown). Representative micrographs. Bar, 10 μm. (D) Quantification of anaphase cells with lagging chromosomes. The average from three independent experiments. Errors are SEM. Statistical significance was determined by Student's t test; *p < 0.05; **p < 0.01.
We also examined whether Net1-knockdown cells exhibited lagging chromatin during anaphase. We observed that anaphase cells transfected with nontargeting shRNA exhibited proper segregation of sister chromatids (Figure 4B). Nearly 50% of the Net1-specific shRNA–transfected cells contained lagging chromosomes, however, as did cells transfected with the dual isoform–targeting shRNA vector. Of interest, there was a lesser but statistically significant increase in lagging chromosomes in cells with Net1A depletion (Figure 4D). Lagging chromosomes during anaphase are indicative of incorrect spindle attachment to kinetochores. Thus these data indicate that Net1 and, to a lesser extent, Net1A contribute to this process.
Net1 expression is essential for stable kinetochore–microtubule attachments
The delay in metaphase-to-anaphase transition in Net1-knockdown cells suggests that the spindle assembly checkpoint (SAC) may be activated, which normally inhibits the release of cells from metaphase until all of the kinetochores are properly attached to the spindle apparatus (Musacchio and Salmon, 2007). Hence we examined whether depletion of Net1 stimulated SAC activation, by testing for kinetochore recruitment of the SAC component proteins BubR1 and Mad2. We observed that both BubR1 and Mad2 colocalized with CREST-positive kinetochores in Net1-depleted cells but not in control siRNA–transfected cells (Figure 5A, insets). These results indicate that Net1 depletion results in SAC activation.
FIGURE 5:
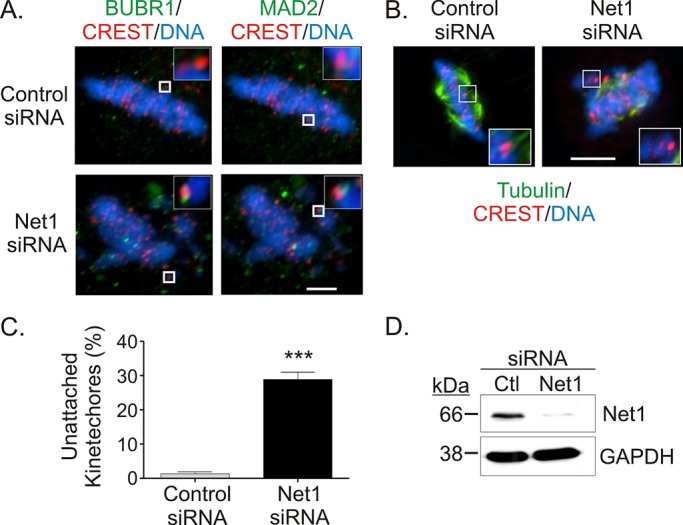
Spindle assembly checkpoint activation and reduced spindle stability in Net1-depleted cells. (A) HeLa cells were transfected with control or Net1-specific siRNAs. Two days later the cells were fixed and stained for the spindle assembly checkpoint proteins BubRI (left, green) or Mad2 (right, green), CREST (red), and DNA (blue). Spindle assembly checkpoint activation was determined by adjacent localization of BubRI or Mad2 with CREST in metaphase cells (insets). Representative micrographs. Bar, 2 μm. (B) Control or Net1 siRNA–transfected cells were incubated at 4°C for 10 min before fixation. The cells were then stained for α-tubulin (green), CREST (red), and DNA (blue). Representative micrographs. Bar, 10 μm. (C) Quantification of unattached kinetochores in control or Net1 siRNA–transfected cells after cold treatment. Average of 25–30 kinetochores counted/cell from three independent experiments. Errors are SEM. Statistical significance was determined by Student's t test; **p < 0.001. (D) Representative Western blot of siRNA-transfected cells.
Improper attachment of spindle fibers to kinetochores results in reduced stability of spindle microtubules (Rieder, 1981; Lampson and Kapoor, 2005; Draviam et al., 2006). To assess spindle stability, we incubated control and Net1 siRNA–transfected cells at low temperature (4°C) for 10 min before fixation and then stained the cells for α-tubulin, the kinetochore antigen CREST, and DNA. Examination of control siRNA–transfected cells in metaphase showed that they retained a significant number of microtubules that were associated with kinetochores, indicating stable attachments. On the other hand, cold treatment of Net1-depleted cells caused disruption of many of the microtubule–kinetochore attachments (Figure 5B). Quantification of unattached kinetochores revealed that nearly 30% of kinetochores were not associated with spindle fibers after cold treatment in Net1-knockdown cells (Figure 5C). These results suggest that Net1 plays a critical role in stimulating stable kinetochore–microtubule attachments.
Loss of RhoA or RhoB expression does not phenocopy the effects of Net1 knockdown
Net1 acts a guanine nucleotide exchange factor for RhoA and to a lesser extent RhoB but not other Rho-family GTPases (Alberts and Treisman, 1998; Srougi and Burridge, 2011). Although neither RhoA nor RhoB has been reported to affect mitotic progression in HeLa cells, we tested whether siRNA-mediated knockdown of either GTPase recapitulated the effects of Net1 knockdown. HeLa cells were transfected with siRNAs for RhoA, RhoB, or both GTPases, and 2 d later the cells were fixed and examined for effects on nuclear morphology. In these experiments we observed that inhibition of RhoA or RhoB expression caused an increase in cells with multiple, normally shaped nuclei, which is indicative of a defect in cytokinesis. We did not observe, however, a significant increase in the number of cells with misshapen nuclei or micronuclei. Moreover, concurrent RhoA and RhoB knockdown also failed to phenocopy Net1 knockdown, suggesting that neither GTPase mediates the role of Net1 in mitotic progression (Figures 6, A–C).
FIGURE 6:
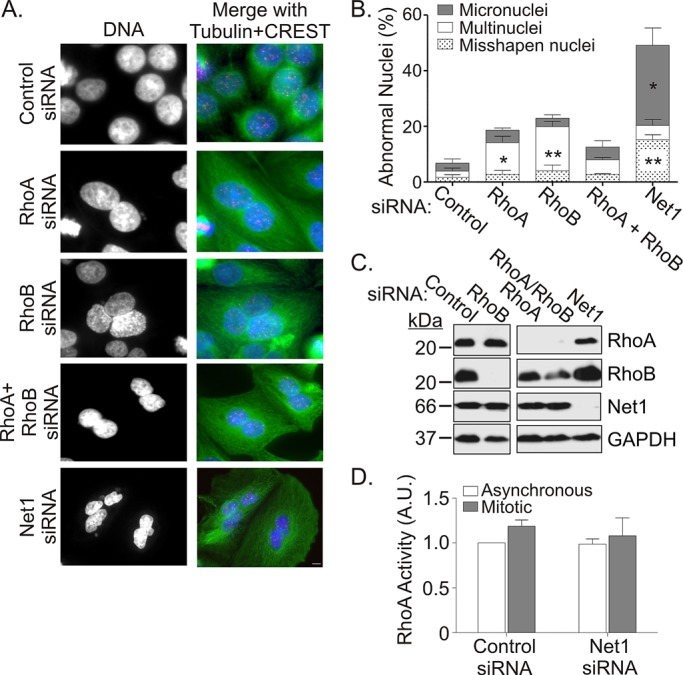
Depletion of RhoA or RhoB does not phenocopy the effects of Net1 knockdown on nuclear morphology. (A) HeLa cells were transfected with control, RhoA, RhoB, or Net1-specific siRNAs. Two days later the cells were fixed and stained for α-tubulin (green), CREST (red), and DNA (blue). Representative micrographs. Bar, 10 μm. (B) Quantification of aberrant nuclear morphologies in siRNA-transfected cells. Average of three independent experiments. Errors are SEM. Statistical significance compared with control values was determined by Student's t test; *p < 0.05; **p < 0.01. (C) Representative Western blot of siRNA-transfected cells. (D) RhoA activity in asynchronous and prometaphase-arrested cells transfected with control or Net1 specific siRNAs. Average of three independent experiments. Errors are SEM.
Previous work in other cell types shows that transfection of interphase cells with siRNAs that recognize both Net1 and Net1A significantly inhibits RhoA activity (Murray et al., 2008; Lee et al., 2010; Papadimitriou et al., 2011; Carr et al., 2012). To determine whether depletion of only the Net1 isoform affected RhoA activity, cells were transfected with Net1-specific siRNA and then maintained as an asynchronous population or synchronized in prometaphase. After synchronization the cells were lysed and tested for levels of active RhoA. We observed that Net1 knockdown did not significantly affect the overall level of active RhoA in interphase or prometaphase cells (Figure 6D). Thus these results indicate that the Net1 isoform does not contribute significantly to RhoA activation during mitosis. In addition, because knockdown of RhoA and RhoB does not phenocopy the effects of Net1 knockdown, these results support a model in which Net1 controls mitotic progression independently of RhoA or RhoB.
Mitotic defects associated with Net1 knockdown are rescued by expression of catalytically inactive Net1
If our model is correct, then the catalytic activity of Net1 should be dispensable for mitotic progression. We therefore tested whether the mitotic defect resulting from Net1 knockdown could be equally rescued by expression of siRNA-resistant, wild-type, or catalytically inactive Net1. This approach required careful titration of Net1 expression, since overexpression of Net1 itself causes mitotic defects (Figure 1). HeLa cells were transfected with control or Net1 siRNAs and later retransfected with siRNA-resistant, wild-type mouse Net1, or Net1 L321E. Net1 L321E was been reported to be unable to activate RhoA or stimulate actin polymerization in cells (Alberts and Treisman, 1998; Schmidt and Hall, 2002). Two days later the cells were fixed and stained for Net1 expression, α-tubulin, and DNA, and then examined for aberrations in nuclear morphology. In these experiments, overexpression of wild-type Net1 or Net1 L321E in control siRNA–transfected cells caused >40% of cells to exhibit abnormally shaped nuclei, with the majority of these being micronucleated (Figure 7, A and C). These effects were slightly less robust than observed in earlier experiments (Figure 1), as less Net1 plasmid was transfected. Of importance, overexpression of Net1 L321E did not result in accumulation of multinucleated cells, which would have been expected if it were competent to stimulate RhoA activation. On the other hand, in Net1 siRNA–transfected cells, expression of wild-type Net1 or catalytically inactive Net1 L321E was equally efficient at rescuing nuclear morphology (Figure 7, B and C). To confirm that the Net1-L321E mutant is catalytically inactive, we performed GST-A17RhoA pull-down assays. A17RhoA is a nucleotide-free form of RhoA that binds tightly to active RhoGEFs and can be used as a probe to detect RhoGEF activation (Garcia-Mata et al., 2006; Carr et al., 2012). Wild-type Net1 bound strongly to GST-A17RhoA but Net1-L321E did not, confirming that this mutant is catalytically inactive (Figure 7, D and E). Taken together, these data indicate that Net1 does not mediate mitotic progression through the activation of Rho GTPases.
FIGURE 7:

Expression of wild-type or catalytically inactive Net1 rescues nuclear morphology in Net1-depleted cells. HeLa cells were transfected with control (A) or Net1-specific (B) siRNAs. One day later the cells were transfected with plasmids expressing siRNA-resistant, HA-epitope-tagged wild-type or catalytically inactive Net1 (L321E). Two days later the cells were fixed and stained for HA-epitope expression (green), α-tubulin (red), CREST (purple), and DNA (blue). Representative micrographs. Bar, 10 μm. (C) Quantification of aberrant nuclear morphology. Average of three independent experiments. Errors are SEM. Statistical significance compared with control values was determined by Student's t test; *p < 0.05; **p < 0.01; ***p < 0.001. (D) Assessment of the activation state of wild-type and catalytically inactive Net1. HeLa cells were transfected with HA-epitope-tagged wild-type Net1 or Net1 L321E. Two days later the cells were lysed and tested for interaction with GST or GST-A17RhoA in pull-down assays. Left, Western blots for HA-Net1 proteins and GST in the glutathione-agarose pull downs. Right, Western blots of HA-Net1 proteins and GAPDH in cell lysates. A representative experiment from three independent experiments. (E) Quantification of Net1 activity assays. Statistical significance was determined by Student's t test; ***p < 0.001.
Net1 expression is required for centrosomal activation of Pak2 and Aurora A
Aurora A is a major regulator of mitotic progression. Its activity is required for initiation of mitosis, centrosomal maturation, and spindle assembly (Hirota et al., 2003; Dutertre et al., 2004; Kinoshita et al., 2005; Mori et al., 2007; Lu et al., 2008; Sasai et al., 2008; Venoux et al., 2008; Zhang et al., 2008; Carmena et al., 2009). Because cells lacking Net1 exhibited unstable mitotic spindles and failed to properly align their chromosomes during metaphase, we examined whether Aurora A activity was compromised by visualizing active Aurora A (pT288) or total Aurora A in mitotic cells. We observed that Net1 knockdown significantly inhibited endogenous Aurora A activation at the spindle poles and slightly inhibited overall spindle pole recruitment of Aurora A (Figure 8, A–C). This resulted in an increased distance between spindle poles (Figure 8D), which is consistent with aberrant mitotic microtubule motor activity caused by lack of Aurora A activation (Giet and Prigent, 2000; Bird and Hyman, 2008; Ma et al., 2011; Tanenbaum et al., 2011).
FIGURE 8:

Net1 knockdown inhibits Aurora A and Pak activation at centrosomes. (A) HeLa cells were transfected with control or Net1 siRNAs, fixed 72 h later, and stained for total Aurora A or phospho–threonine 288-Aurora A (red) and DNA (blue). Bar, 5 μm. (B) Quantification of total Aurora A or (C) phospho–Aurora A at the centrosome. Graphs represent average values from three independent experiments. Errors are SEM. Statistical significance was determined by Student's t test; *p < 0.05. (D) Distance between spindle poles in metaphase cells that were transfected with control or Net1 siRNAs. Values are from three independent experiments. Bars, median values. Statistical significance was determined by Student's t test; ***p < 0.001. (E) HeLa cells were transfected with control or Net1-specific siRNAs and then fixed and stained for phospho–T402-PAK (red) and DNA (blue). Bar, 5 μm. (F) Quantification of the phospho-Pak signal at the centrosome. Average of three independent experiments. Errors are SEM. Statistical significance was determined by Student's t test; **p < 0.01. (G) HeLa cells transfected with control and Net1 siRNAs were synchronized in prometaphase with nocodazole. Mitotic cells were collected by shake-off, and cell extracts were immunoprecipitated with control (IgG) or anti-PAK antibodies. Immunoprecipitates and total lysates were tested for the presence of GIT1, βPIX, PAK2, and Net1 by Western blotting. A representative experiment from three independent experiments. (H) Mitotic control or Net1 siRNA-transfected cells were collected as in G, and cell lysates were subject to immunoprecipitation with control IgG or Aurora A antibody. After washing, Aurora A kinase activity toward histone H3 serine 10 was assessed in vitro and visualized by Western blotting. A representative experiment from three independent experiments. (I) Mitotic control and Net1 siRNA–transfected cells were collected as in G, and cell lysates were tested by Western blotting with the indicated antibodies. A representative experiment from three independent experiments. (J) Control and Net1 siRNA–transfected cells were stained for TACC3 (red), α-tubulin (green), and DNA (blue). Bar, 5 μm. Representative maximum intensity z-planes from three independent experiments. (K) Western blot for phosphorylated (pTACC3) and total TACC3 from control and Net1 siRNA–transfected cells. A representative experiment from three independent experiments.
Multiple proteins have been shown to contribute to centrosomal activation of Aurora A, including Ajuba, Arpc1b, and Pak1/2 (Hirota et al., 2003; Zhao et al., 2005; Molli et al., 2010). Of these, only Pak2 has been shown to directly phosphorylate Aurora A on its activating site, T288. Moreover, we previously showed that the closely related kinase Pak1 phosphorylates Net1 in interphase cells, suggesting that a functional relationship between Paks and Net1 might exist in mitotic cells (Alberts et al., 2005). Thus we examined whether Net1 expression was required for centrosomal activation of endogenous Pak2, which is the predominant Pak isoform in HeLa cells (Zhao et al., 2005). Strikingly, we observed that the centrosomal localization of Pak2 phosphorylated on its activating site, T402, was also significantly inhibited by Net1 knockdown (Figure 8, E and F). We were unable to show whether Net1 expression was required for recruitment of unphosphorylated Pak2 to centrosomes, as this interaction is too transient to permit detection (Zhao et al., 2005).
Pak2 constitutively interacts with the Rac1 GEF βPIX and is recruited to the centrosome by the Pak-interacting exchange factor β (βPIX)–associated protein G protein-receptor–coupled kinase interactor 1 (GIT1). Once localized to the centrosome, Pak2 is activated by an unknown mechanism (Zhao et al., 2005). To determine whether Net1 is required for assembly of the Pak2-βPIX-GIT1 complex, we tested for the coimmunoprecipitation of endogenous βPIX and GIT1 with Pak2 in control and Net1-knockdown cells after synchronization in prometaphase. As shown in Figure 8G, βPIX and GIT1 efficiently coimmunoprecipitated with Pak2 in both control and Net1 siRNA–transfected cells, indicating that Net1 expression was not required for assembly of this complex. Of importance, endogenous Net1 did not coimmunoprecipitate with either Pak2 or Aurora A, suggesting that Net1 does not directly control their interaction (unpublished data).
Because only a portion of active Aurora A localizes to the spindle pole during mitosis (Carmena et al., 2009), we assessed the activity of Aurora A after immunoprecipitation from mitotic cells. HeLa cells were transfected with control or Net1 siRNAs and synchronized in prometaphase, and the kinase activity of immunoprecipitated, endogenous Aurora A toward serine 10 of histone H3 was examined. In these experiments we observed a significant decrease in the pS10-H3 kinase activity of Aurora A (Figure 8H). Net1 knockdown also clearly reduced the level of pT288-Aurora A in cell lysates, and to a lesser extent pPak2. Net1 knockdown also significantly reduced the phosphorylation of histone H3 on serine 10, further indicating that Aurora A activity was reduced (Figure 8I). To further validate that centrosomal Aurora A activity was reduced, we assessed the localization of TACC3 in Net1 siRNA–transfected cells. TACC3 is a spindle assembly factor that relocalizes from the spindle to the spindle pole after Aurora A phosphorylation (Kinoshita et al., 2005). We observed that TACC3 failed to properly localize to the spindle poles in Net1-knockdown cells (Figure 8J) and that this was accompanied by a significant reduction in S558 TACC3 phosphorylation in whole-cell lysates (Figure 8K). These findings indicate that Net1 expression is required for centrosomal activation of Pak2 and Aurora A by a mechanism that is likely independent of assembly of the Pak2-βPIX-GIT1 complex. Of importance, Net1 knockdown did not completely eliminate Aurora A activation, suggesting that other Aurora A regulatory mechanisms are still operative in Net1-knockdown cells.
DISCUSSION
In the present work we demonstrate that the RhoGEF Net1 is a critical regulator of mitotic progression. We observe that Net1 is required for the generation of a stable mitotic spindle and chromatin congression during prometaphase. We also observe that Net1 expression is necessary for centrosomal activation of Aurora A and its upstream activating kinase, Pak2. This is an entirely novel function for Net1, as Net1 was previously only implicated in regulating actin cytoskeletal organization, cell motility, and DNA-damage responses (Alberts and Treisman, 1998; Shen et al., 2001; Schmidt and Hall, 2002; Frisan et al., 2003; Qin et al., 2005; Leyden et al., 2006; Murray et al., 2008; Lee et al., 2010; Papadimitriou et al., 2011; Srougi and Burridge, 2011). Of importance, the ability of Net1 to control mitotic progression did not require activation of RhoA or RhoB, which is distinct from other known Net1-regulated functions. This also distinguishes Net1 from other RhoGEFs involved in mitosis or cell division, since they control these processes through activation of downstream Rho GTPases.
Our findings offer a mechanistic explanation for previous observations showing that Net1 expression is required for proliferation of cultured cancer cells (Leyden et al., 2006; Dutertre et al., 2010). Moreover, it may explain why elevated expression of Net1 rather than Net1A mRNA is correlated with reduced survival in estrogen receptor–positive breast cancer patients (Dutertre et al., 2010), as we did not find a significant role for Net1A in mitotic progression. Our findings indicating distinct roles for Net1 and Net1A are supported by recent studies showing that the Net1A isoform specifically controls TGFβ-stimulated cytoskeletal reorganization and is required for cell spreading and focal adhesion maturation (Papadimitriou et al., 2011; Carr et al., 2012). Thus we favor a model in which Net1 controls processes related to cell proliferation, whereas Net1A mainly contributes to actin cytoskeletal reorganization associated with cell motility. Unfortunately, previous studies demonstrating overexpression of Net1 in human cancers did not discriminate among Net1 isoforms (Leyden et al., 2006; Shen et al., 2008; Tu et al., 2010). Our work indicates that it may be important to distinguish between isoforms in future efforts to correlate Net1 expression with cancer phenotypes.
An unexpected finding of our work is that Net1 regulates mitotic progression without stimulating Rho GTPase activity. This conclusion is based on our observation that knockdown of the Net1 substrates RhoA and RhoB did not phenocopy the effects of Net1 knockdown on nuclear morphology and that expression of siRNA-resistant, catalytically inactive Net1 rescued nuclear morphology in Net1-knockdown cells. This is consistent with previous studies showing that RhoA mainly contributes to cortical retraction and rigidity during mitosis, as well as cleavage furrow specification and ingression during cytokinesis (Kishi et al., 1993; Drechsel et al., 1997; Maddox and Burridge, 2003; Bement et al., 2005; Kamijo et al., 2006). Thus Net1 most likely coordinates one or more protein–protein interactions to control mitotic progression. Our observation that either overexpression or siRNA knockdown of Net1 alters mitotic progression supports this idea, since the ability of Net1 to coordinate interaction between other proteins would be exquisitely sensitive to its level of expression. Net1 control of mitosis most likely requires its unique N-terminal domain, which is the only region within Net1 that is not identical to Net1A (Qin et al., 2005). This region contains two NLS sequences but otherwise does not contain any protein interaction motifs or posttranslational modification sites that have been described.
A significant finding of our study is that Net1 expression is necessary for centrosomal activation of Pak2 and its client kinase Aurora A. Because Aurora A activity is required for centrosome maturation, spindle assembly, and spindle stability, the ability of Net1 to control its activation may account for much of Net1 function during mitosis. Net1 may also contribute to mitotic progression by regulating Pak-dependent activation of Plk1 (Maroto et al., 2008), although we have not tested this possibility. In this regard, we have not observed Net1 interaction with Aurora A, Pak2, or the Pak2-interacting proteins GIT1 and βPIX. Nor have we found Net1 localized to the centrosome in mitotic cells. Thus it is likely that Net1 controls Pak2 activation indirectly by interaction with one or more of its mitotic regulators. Mitotic activation of Pak2 is independent of its canonical regulators Rac and Cdc42, and mechanisms controlling the mitotic Pak2 activation have not been elucidated (Zhao et al., 2005; Maroto et al., 2008).
In summary, we identified Net1 as a novel regulator of mitotic progression. The mitotic function of Net1 does not require Rho GTPase activation and directly affects Aurora A and Pak2 activation. These results offer a molecular explanation for the requirement for Net1 isoform expression in cell proliferation (Leyden et al., 2006; Dutertre et al., 2010) and may explain why Net1 overexpression is associated with human cancer and poor prognostic outlook in breast cancer patients (Leyden et al., 2006; Shen et al., 2008; Gilcrease et al., 2009; Tu et al., 2010; Papadimitriou et al., 2011). Future work is required to elucidate the molecular mechanism by which Net1 controls mitotic Pak2 and Aurora A activation and to identify regulatory paradigms that control mitotic Net1 function.
MATERIALS AND METHODS
Cell culture and plasmid transfections
HeLa and U2OS cells and primary human foreskin fibroblasts were maintained in DMEM with high glucose supplemented with 10% fetal bovine serum (Invitrogen, Carlsbad, CA) and 100 U/ml penicillin and 100 μg/ml streptomycin (Invitrogen). For plasmid transfections cells were seeded in 6-cm culture dishes 1 d before transfection. A 2-μg amount of DNA was incubated with 0.15 M NaCl and 16 μl of deacylated polyethylenimine (PEI) 2200 reagent (provided by Guangwei Du, University of Texas Health Science Center at Houston) for 10 min at room temperature and added to the monolayer. Cells were cultured for an additional 48 h before being analyzed.
Antibodies and reagents
Mouse anti-Net1 (sc-50392), mouse anti-HA (sc-7392), mouse anti–glyceraldehyde-3-phosphate dehydrogenase (GAPDH; sc-27724), mouse anti-RhoB (sc-21322), and anti-γPAK (sc-37340) were from Santa Cruz Biotechnology (Santa Cruz, CA). Mouse anti-RhoA (ARHO3) was from Cytoskeleton (Denver, CO). Mouse anti–α-tubulin and mouse anti-BUBR1 (SAB1400031) were from Sigma-Aldrich (St. Louis, MO). Rabbit anti-MAD2 (4636S), rabbit anti–phospho Pak1 (Thr-423)/Pak2 (Thr-402), rabbit anti–phospho Aurora A (3079), mouse anti-RhoB (2098), mouse anti–phospho H3 (Ser10) (9706), rabbit anti-H3 (4499), rabbit anti-pSer558 TACC3 (8842), and rabbit anti-TACC3 (8069) were from Cell Signaling Technology (Beverly, MA). Rabbit anti–Aurora A, rabbit anti-βPix, and rabbit anti-GIT1 were from GeneTex (Irvine, CA). Rabbit anti-Pak2 was from Bethyl Laboratories (Montgomery, TX). For immunofluorescence, secondary antibodies conjugated to Cy2, Cy3, and Dylight 649 were purchased from Jackson ImmunoResearch Laboratories (West Grove, PA) and 4′,6-diamidino-2-phenylindole (DAPI) was from Sigma-Aldrich. Anti-human CREST antibodies were kindly provided by William Brinkley (Baylor College of Medicine, Houston, TX). HA-Net1, HA-Net1A, and HA-Net1ΔN plasmids were as previously described (Qin et al., 2005).
RNA interference
For shRNA-mediated knockdown of Net1 isoforms, oligonucleotides were cloned into Geneclip U1 Hairpin cloning vectors containing puromycin or hMGFP selection markers according to the manufacturer's directions (Promega, Madison, WI). DNA sequences used were as follows: control, 5′-ATTGTATGCGATCGCAGAC-3′; Net1 (nucleotides [nt] 344–362), 5′-GCAGAGAGAAAGATGATGAT-3′; Net1A (nt 206–224), 5′- GAGGTCTCCTACCTATTAAT-3′; and both Net1 isoforms, 5′- CAAAGCTCTTCTTGATCAAT-3′. Plasmids containing the shRNAs were transfected into HeLa cells using deacylated PEI 2200 reagent as described. For puromycin vectors 4 μg of DNA was transfected into cells in 10-cm culture dishes. Twenty-four hours after transfection, puromycin (2 μg/ml) was added, and the cells were collected 48 or 72 h later for real-time PCR and Western blot analysis. For hMGFP-expressing shRNA plasmids, 2 μg of DNA was transfected into cells in 6-cm culture dishes, and the cells were fixed for immunofluorescence 72–96 h later.
For siRNA-mediated knockdown of the Net1 isoform, the sequence 5′-GAAAACGCAGAGAGAAAGA-3′ was used at a final concentration of 5 nM. Knockdown of RhoA was achieved using 5 nM of validated siRNA sequence 5′-CAGAUACCGAUGUUAUACU-3′ (Sigma-Aldrich), and endogenous RhoB was depleted using the validated target sequence 5′-CCCAGAACGGCUGCAUCAA-3′ (Sigma-Aldrich). A nontargeting sequence, 5′-GAUCAUACGUGCGAUCAGA-3′ (Sigma-Aldrich), was used as a control in all siRNA experiments. Transfections were performed using Interferin reagent (Polyplus-transfection SA, Illkirch, France) following the manufacturer's instructions.
Real-time qPCR
Total RNA was extracted from asynchronously growing HeLa cells using TriReagent (Sigma-Aldrich) and reverse transcribed into cDNA using a Superscript II Reverse Transcriptase Kit (Invitrogen). The cDNA was amplified with SYBR Green JumpStart Taq ReadyMix (Sigma-Aldrich) in a LightCycler 480 system (Roche, Indianapolis, IN). For detection of amplified Net1 transcripts the primer sequences 5′-GCAGAGAGAAAGATGATGATGTTG-3′ (forward) and 5′-TAAATCCTGTTCACCTCGGGAC-3′ were used. For detection of Net1A transcripts the primer pair 5′-GCTGACTCGGTGTGGATTGATTGG-3′ (forward) and 5′-CGAAGGGTAAATGACTGTATTGTTTGACC-3′ (reverse) was used. Human GAPDH transcripts were measured as an internal control using the primers 5′-GGAAGGTGAAGGTCGGAGTC-3′ (forward) and 5′-GCTCCTGGAAGATGGTGATG-3′ (reverse). The mRNA levels of Net1 isoforms were calculated using the standard curve method and represented relative to GAPDH mRNA levels.
Western blot and immunoprecipitation
For whole-cell lysates cells were rinsed with cold phosphate-buffered saline (PBS) and then lysed in 2% SDS lysis buffer (20 mM Tris-HCl, pH 8.0, 100 mM NaCl, 1 mM EDTA, 2% SDS, 50 mM NaF, 80 mM β-glycerophosphate, 1 mM sodium orthovanadate, 10 μg/ml aprotinin, 10 μg/ml pepstatin A, 2 μg/ml aprotinin, and 1 mM phenylmethylsulfonyl fluoride [PMSF]). Lysates were sonicated, and insoluble material was pelleted by centrifugation (18,000 × g, 10 min, room temperature). Protein concentrations were determined using bicinchoninic acid (BCA) protein assay (Pierce, Rockford, IL), and equal concentrations of lysates were resolved by SDS–PAGE. Prestained molecular weight markers were from Sigma-Aldrich or Bio-Rad (Hercules, CA). Proteins were then transferred to polyvinylidene fluoride (PVDF) membranes and blocked in 5% nonfat milk or 1% bovine serum albumin (BSA) in Tris-buffered saline (20 mM Tris-HCl, pH 7.4, 100 mM NaCl) containing 0.1% Tween 20 (TBST). Membranes were incubated with the appropriate primary antibody overnight at 4°C in 5% milk or 1% BSA in TBST, washed three times in TBST, and incubated with the corresponding secondary antibody for 30 min at room temperature. Immunoreactive bands were visualized using enhanced chemiluminescence reagent. GAPDH protein levels were measured as internal loading controls.
For immunoprecipitation of endogenous Pak2 and associated proteins, cells were synchronized in prometaphase by overnight nocodazole (Sigma-Aldrich) treatment (100 ng/ml). Mitotic cells were collected by shake-off, pelleted by centrifugation (500 × g, 5 min, room temperature), and washed with PBS (Krek and DeCaprio, 1995). Cells were lysed in RIPA buffer without SDS (1% Triton X-100, 0.5% deoxycholate, 50 mM Tris-HCl, pH 7.5, 150 mM NaCl, 1 mM EDTA, 50 mM NaF, 80 mM β-glycerophosphate, 1 mM sodium orthovanadate, 10 μg/ml aprotinin, 10 μg/ml pepstatin A, 2 μg/ml aprotinin, and 1 mM PMSF), and insoluble material was pelleted by centrifugation (16,200 × g, 10 min, 4°C). Lysates were incubated with 2 μg of nonspecific mouse immunoglobulin G (IgG) or mouse anti-γPak plus 40 μl of a 50% slurry of protein A–Sepharose (Rockland Immunochemicals, Gilbertsville, PA) for 2 h at 4°C. Protein A–Sepharose complexes were pelleted by centrifugation and washed three times with lysis buffer. Pellets were resuspended in 2× SDS loading buffer (100 mM Tris-HCl, pH 6.8, 200 mM dithiothreitol (DTT), 4% SDS, 20% glycerol, and 0.04% bromophenol blue), resolved by 10% SDS–PAGE, and transferred to PVDF membrane for Western blotting.
Aurora A immunoprecipitation kinase assay
Cells were synchronized in prometaphase with nocodazole, and mitotic cells were harvested by shake-off. Cells were washed once with PBS and lysed in RIPA buffer without SDS, and lysates were clarified by centrifugation (16,200 × g, 10 min, 4°C). Equal amounts of lysate were incubated with 2 μg of control IgG or Aurora A antibody plus 40 μl of a 50% slurry of protein G–Sepharose (Invitrogen) for 2 h, 4°C with mixing. Immunoprecipitates were washed three times with 1 ml of 20 mM Tris-HCl, pH 8.0, and 500 mM NaCl and once with 1 ml of 20 mM Tris-HCl, pH 8.0, and 10 mM MgCl2. Supernatants were completely removed from immunoprecipitates, and kinase reactions were carried out in 40-μl reactions in 20 mM Tris-HCl, pH 8.0, 10 mM MgCl2, 1 mM DTT, 100 µM ATP, and 2 μg of recombinant histone H3 (10263; Cayman Chemical Company, Ann Arbor, MI) for 30 min at 30°C and stopped by addition of 5× LSB. Supernatants were removed and resolved by SDS–PAGE, transferred to PVDF membrane, and analyzed by Western blotting for pS10-H3 and total H3. Immunoprecipitates were solubilized in 1× LSB and tested for Aurora A by Western blotting.
Immunofluorescence analysis
For indirect immunofluorescence, cells were grown on acid-washed glass coverslips and fixed in 4% formaldehyde in PEM buffer (80 mM K–1,4-piperazinediethanesulfonic acid, pH 7.6, 5 mM ethylene glycol tetraacetic acid, and 2 mM MgCl2) for 20 min at room temperature. Cells were then permeabilized in 0.5% Triton X-100 in PEM buffer for 10 min at room temperature and blocked in 1% BSA in PEM buffer for 30 min at room temperature. Samples were incubated with the appropriate primary antibodies diluted in PEM buffer for 1 h at 37°C, or overnight at 4°C (for TACC3 staining). The coverslips were washed three times in PBS containing 0.1% Tween 20 (PBST) and incubated with secondary antibodies and DAPI (1 μg/ml) diluted in PEM for 1 h at 37°C. The coverslips were washed three times in PBST and mounted on glass slides using FluorSave Reagent (Calbiochem, La Jolla, CA). Cells were visualized by epifluorescence or confocal microscopy. For epifluorescence, cells were visualized with a Zeiss Axiophot microscope equipped with a Zeiss AxioCam MRm MC100 SPOT digital camera and 40× Plan-Neofluar/numerical aperture (NA) 0.75 air or 63× Plan-Apochromat/NA 1.40 oil objectives. Images were captured using Zeiss AxioVision software (Carl Zeiss, Jena, Germany). For confocal analysis images were captured with a Nikon A1R fluorescence microscope using a 60× Plan-Fluor/NA 0.75 air objective (Nikon, Melville, NY). Z-stack images were acquired in 0.25-μm or 0.4-μm steps using the 60× Apo TIRF/NA 1.49 oil objective lens. Images were visualized and analyzed with Nikon NIS software and deconvolved with AutoQuant software (Media Cybernetics, Rockville, MD).
Live cell imaging
HeLa cells were grown in 35-mm glass-bottom culture dishes (MatTek Corporation, Ashland, MA) and transfected with 5 nM nontargeting or Net1-specific siRNAs. After 24 h cells were transfected with H2B-mCherry using PEI 2200 to visualize chromatin. Cells were placed in a 37°C heated microscope chamber with 5% CO2. Images were captured with a Nikon TiE wide-field fluorescence microscope using a 40× Plan-Fluor/NA 0.75 air objective. Images were acquired at 2-min intervals for 4 h. Data were visualized and analyzed with the Nikon NIS Elements software.
Net1 activity assays
Net1 activity was measured using GST-A17RhoA pull-down assays, as previously described (Garcia-Mata et al., 2006). Briefly, cells were washed with cold HBS (20 mM 4-(2-hydroxyethyl)-1-piperazineethanesulfonic acid [HEPES], pH 7.5, 150 mM NaCl) and lysed in HBS lysis buffer (20 mM HEPES, pH 7.5, 150 mM NaCl, 5 mM MgCl2, 1% Triton X-100, 1 mM DTT, 1 mM PMSF, 10 μg/ml aprotonin, 10 μg/ml pepstatin, 10 μg/ml leupeptin). Whole-cell lysates were clarified by centrifugation (18,000 × g, 5 min, 4°C), and lysate concentrations were determined by BCA assay. Equal concentrations of lysates were precleared with 20 μg of glutathione S-transferase (GST) beads for 30 min at 4°C. Precleared lysates were transferred to fresh tubes and incubated with 20 μg of GST or GST–A17RhoA beads for 45–60 min at 4°C. The beads were then washed three times with lysis buffer, resuspended in 1× SDS sample loading buffer, and resolved by 10% SDS–PAGE. The proteins were transferred to PVDF membranes and probed with the appropriate antibodies.
RhoA activity assays
HeLa cells were transfected with 10 nM of control or Net1 siRNAs. Three days later mitotic cells were enriched by overnight incubation with 100 ng/ml nocodazole and collected by shake-off, pelleted by centrifugation (500 × g, 5 min, room temperature), and washed with PBS (Krek and DeCaprio, 1995). Interphase cells were scraped into PBS, pelleted by centrifugation (500 × g, 5 min, room temperature), and washed with PBS. RhoA activity of collected cells was measured using a G-LISA assay kit (Cytoskeleton) according to the manufacturer's instructions.
Acknowledgments
We give special thanks to Carmen Dessauer for helpful suggestions and Rebecca Berdeaux for critical reading of the manuscript. This work was supported by grants from the National Cancer Institute (5R01CA116356) and the Cancer Prevention and Research Institute of Texas (RP100502).
Abbreviations used:
- βPIX
Pak-interacting exchange factor β
- CREST
calcium-responsive transactivator
- GIT1
G protein-receptor–coupled kinase interactor 1
- Net1
neuroepithelial transforming gene 1
- Pak2
p21-activated kinase
- SAC
spindle assembly checkpoint
Footnotes
This article was published online ahead of print in MBoC in Press (http://www.molbiolcell.org/cgi/doi/10.1091/mbc.E13-01-0061) on July 17, 2013.
REFERENCES
- Alberts AS, Qin H, Carr HS, Frost JA. PAK1 negatively regulates the activity of the Rho exchange factor NET1. J Biol Chem. 2005;280:12152–12161. doi: 10.1074/jbc.M405073200. [DOI] [PubMed] [Google Scholar]
- Alberts AS, Treisman R. Activation of RhoA and SAPK/JNK signalling pathways by the RhoA-specific exchange factor mNET1. EMBO J. 1998;17:4075–4085. doi: 10.1093/emboj/17.14.4075. [DOI] [PMC free article] [PubMed] [Google Scholar]
- Aoki T, Ueda S, Kataoka T, Satoh T. Regulation of mitotic spindle formation by the RhoA guanine nucleotide exchange factor ARHGEF10. BMC Cell Biol. 2009;10:56. doi: 10.1186/1471-2121-10-56. [DOI] [PMC free article] [PubMed] [Google Scholar]
- Asiedu M, Wu D, Matsumura F, Wei Q. Centrosome/spindle pole-associated protein regulates cytokinesis via promoting the recruitment of MyoGEF to the central spindle. Mol Biol Cell. 2009;20:1428–1440. doi: 10.1091/mbc.E08-01-0001. [DOI] [PMC free article] [PubMed] [Google Scholar]
- Bakal CJ, Finan D, LaRose J, Wells CD, Gish G, Kulkarni S, DeSepulveda P, Wilde A, Rottapel R. The Rho GTP exchange factor Lfc promotes spindle assembly in early mitosis. Proc Natl Acad Sci USA. 2005;102:9529–9534. doi: 10.1073/pnas.0504190102. [DOI] [PMC free article] [PubMed] [Google Scholar]
- Bement WM, Benink HA, von Dassow G. A microtubule-dependent zone of active RhoA during cleavage plane specification. J Cell Biol. 2005;170:91–101. doi: 10.1083/jcb.200501131. [DOI] [PMC free article] [PubMed] [Google Scholar]
- Bird AW, Hyman AA. Building a spindle of the correct length in human cells requires the interaction between TPX2 and Aurora A. J Cell Biol. 2008;182:289–300. doi: 10.1083/jcb.200802005. [DOI] [PMC free article] [PubMed] [Google Scholar]
- Birkenfeld J, Nalbant P, Bohl BP, Pertz O, Hahn KM, Bokoch GM. GEF-H1 modulates localized RhoA activation during cytokinesis under the control of mitotic kinases. Dev Cell. 2007;12:699–712. doi: 10.1016/j.devcel.2007.03.014. [DOI] [PMC free article] [PubMed] [Google Scholar]
- Carmena M, Ruchaud S, Earnshaw WC. Making the Auroras glow: regulation of Aurora A and B kinase function by interacting proteins. Curr Opin Cell Biol. 2009;21:796–805. doi: 10.1016/j.ceb.2009.09.008. [DOI] [PMC free article] [PubMed] [Google Scholar]
- Carr HS, Morris CA, Menon S, Song EH, Frost JA. Rac1 controls the subcellular localization of the RhoGEF Net1A to regulate focal adhesion formation and cell spreading. Mol Cell Biol. 2012;33:622–634. doi: 10.1128/MCB.00980-12. [DOI] [PMC free article] [PubMed] [Google Scholar]
- Chalamalasetty RB, Hummer S, Nigg EA, Sillje HH. Influence of human Ect2 depletion and overexpression on cleavage furrow formation and abscission. J Cell Sci. 2006;119:3008–3019. doi: 10.1242/jcs.03032. [DOI] [PubMed] [Google Scholar]
- Chan AM, Takai S, Yamada K, Miki T. Isolation of a novel oncogene, NET1, from neuroepithelioma cells by expression cDNA cloning. Oncogene. 1996;12:1259–1266. [PubMed] [Google Scholar]
- Chevrier V, Piel M, Collomb N, Saoudi Y, Frank R, Paintrand M, Narumiya S, Bornens M, Job D. The Rho-associated protein kinase p160ROCK is required for centrosome positioning. J Cell Biol. 2002;157:807–817. doi: 10.1083/jcb.200203034. [DOI] [PMC free article] [PubMed] [Google Scholar]
- Draviam VM, Shapiro I, Aldridge B, Sorger PK. Misorientation and reduced stretching of aligned sister kinetochores promote chromosome missegregation in EB1- or APC-depleted cells. EMBO J. 2006;25:2814–2827. doi: 10.1038/sj.emboj.7601168. [DOI] [PMC free article] [PubMed] [Google Scholar]
- Drechsel DN, Hyman AA, Hall A, Glotzer M. A requirement for Rho and Cdc42 during cytokinesis in Xenopus embryos. Curr Biol. 1997;7:12–23. doi: 10.1016/s0960-9822(06)00023-6. [DOI] [PubMed] [Google Scholar]
- Dutertre M, Gratadou L, Dardenne E, Germann S, Samaan S, Lidereau R, Driouch K, de la Grange P, Auboeuf D. Estrogen regulation and physiopathologic significance of alternative promoters in breast cancer. Cancer Res. 2010;70:3760–3770. doi: 10.1158/0008-5472.CAN-09-3988. [DOI] [PubMed] [Google Scholar]
- Dutertre S, et al. Phosphorylation of CDC25B by Aurora-A at the centrosome contributes to the G2-M transition. J Cell Sci. 2004;117:2523–2531. doi: 10.1242/jcs.01108. [DOI] [PubMed] [Google Scholar]
- Frisan T, Cortes-Bratti X, Chaves-Olarte E, Stenerlow B, Thelestam M. The Haemophilus ducreyi cytolethal distending toxin induces DNA double-strand breaks and promotes ATM-dependent activation of RhoA. Cell Microbiol. 2003;5:695–707. doi: 10.1046/j.1462-5822.2003.00311.x. [DOI] [PubMed] [Google Scholar]
- Garcia-Mata R, Dubash AD, Sharek L, Carr HS, Frost JA, Burridge K. The nuclear RhoA exchange factor Net1 interacts with proteins of the Dlg family, affects their localization, and influences their tumor suppressor activity. Mol Cell Biol. 2007;27:8683–8697. doi: 10.1128/MCB.00157-07. [DOI] [PMC free article] [PubMed] [Google Scholar]
- Garcia-Mata R, Wennerberg K, Arthur WT, Noren NK, Ellerbroek SM, Burridge K. Analysis of activated GAPs and GEFs in cell lysates. Methods Enzymol. 2006;406:425–437. doi: 10.1016/S0076-6879(06)06031-9. [DOI] [PubMed] [Google Scholar]
- Giet R, Prigent C. The Xenopus laevis aurora/Ip11p-related kinase pEg2 participates in the stability of the bipolar mitotic spindle. Exp Cell Res. 2000;258:145–151. doi: 10.1006/excr.2000.4903. [DOI] [PubMed] [Google Scholar]
- Gilcrease MZ, et al. Coexpressionof alpha6beta4 integrin and guanine nucleotide exchange factor Net1 identifies node-positive breast cancer patients at high risk for distant metastasis. Cancer Epidemiol Biomarkers Prev. 2009;18:80–86. doi: 10.1158/1055-9965.EPI-08-0842. [DOI] [PMC free article] [PubMed] [Google Scholar]
- Hirota T, Kunitoku N, Sasayama T, Marumoto T, Zhang D, Nitta M, Hatakeyama K, Saya H. Aurora-A and an interacting activator, the LIM protein Ajuba, are required for mitotic commitment in human cells. Cell. 2003;114:585–598. doi: 10.1016/s0092-8674(03)00642-1. [DOI] [PubMed] [Google Scholar]
- Holland AJ, Cleveland DW. Losing balance: the origin and impact of aneuploidy in cancer. EMBO Rep. 2012;13:501–514. doi: 10.1038/embor.2012.55. [DOI] [PMC free article] [PubMed] [Google Scholar]
- Jaffe AB, Hall A. Rho GTPases: biochemistry and biology. Annu Rev Cell Dev Biol. 2005;21:247–269. doi: 10.1146/annurev.cellbio.21.020604.150721. [DOI] [PubMed] [Google Scholar]
- Kamijo K, Ohara N, Abe M, Uchimura T, Hosoya H, Lee JS, Miki T. Dissecting the role of Rho-mediated signaling in contractile ring formation. Mol Biol Cell. 2006;17:43–55. doi: 10.1091/mbc.E05-06-0569. [DOI] [PMC free article] [PubMed] [Google Scholar]
- Kimura K, Tsuji T, Takada Y, Miki T, Narumiya S. Accumulation of GTP-bound RhoA during cytokinesis and a critical role of ECT2 in this accumulation. J Biol Chem. 2000;275:17233–17236. doi: 10.1074/jbc.C000212200. [DOI] [PubMed] [Google Scholar]
- Kinoshita K, Noetzel TL, Pelletier L, Mechtler K, Drechsel DN, Schwager A, Lee M, Raff JW, Hyman AA. Aurora A phosphorylation of TACC3/maskin is required for centrosome-dependent microtubule assembly in mitosis. J Cell Biol. 2005;170:1047–1055. doi: 10.1083/jcb.200503023. [DOI] [PMC free article] [PubMed] [Google Scholar]
- Kishi K, Sasaki T, Kuroda S, Itoh T, Takai Y. Regulation of cytoplasmic division of Xenopus embryo by rho p21 and its inhibitory GDP/GTP exchange protein (rho GDI) J Cell Biol. 1993;120:1187–1195. doi: 10.1083/jcb.120.5.1187. [DOI] [PMC free article] [PubMed] [Google Scholar]
- Krek W, DeCaprio JA. Cell synchronization. Methods Enzymol. 1995;254:114–124. doi: 10.1016/0076-6879(95)54009-1. [DOI] [PubMed] [Google Scholar]
- Lampson MA, Kapoor TM. The human mitotic checkpoint protein BubR1 regulates chromosome-spindle attachments. Nat Cell Biol. 2005;7:93–98. doi: 10.1038/ncb1208. [DOI] [PubMed] [Google Scholar]
- Lee J, Moon HJ, Lee JM, Joo CK. Smad3 regulates Rho signaling via NET1 in the transforming growth factor-beta-induced epithelial-mesenchymal transition of human retinal pigment epithelial cells. J Biol Chem. 2010;285:26618–26627. doi: 10.1074/jbc.M109.073155. [DOI] [PMC free article] [PubMed] [Google Scholar]
- Leyden J, Murray D, Moss A, Arumuguma M, Doyle E, McEntee G, O'Keane C, Doran P, MacMathuna P. Net1 and Myeov: computationally identified mediators of gastric cancer. Br J Cancer. 2006;94:1204–1212. doi: 10.1038/sj.bjc.6603054. [DOI] [PMC free article] [PubMed] [Google Scholar]
- Lu LY, Wood JL, Ye L, Minter-Dykhouse K, Saunders TL, Yu X, Chen J. Aurora A is essential for early embryonic development and tumor suppression. J Biol Chem. 2008;283:31785–31790. doi: 10.1074/jbc.M805880200. [DOI] [PMC free article] [PubMed] [Google Scholar]
- Ma N, Titus J, Gable A, Ross JL, Wadsworth P. TPX2 regulates the localization and activity of Eg5 in the mammalian mitotic spindle. J Cell Biol. 2011;195:87–98. doi: 10.1083/jcb.201106149. [DOI] [PMC free article] [PubMed] [Google Scholar]
- Ma Z, Kanai M, Kawamura K, Kaibuchi K, Ye K, Fukasawa K. Interaction between ROCK II and nucleophosmin/B23 in the regulation of centrosome duplication. Mol Cell Biol. 2006;26:9016–9034. doi: 10.1128/MCB.01383-06. [DOI] [PMC free article] [PubMed] [Google Scholar]
- Maddox AS, Burridge K. RhoA is required for cortical retraction and rigidity during mitotic cell rounding. J Cell Biol. 2003;160:255–265. doi: 10.1083/jcb.200207130. [DOI] [PMC free article] [PubMed] [Google Scholar]
- Maroto B, Ye MB, von LK, Schnelzer A, Knaus UG. P21-activated kinase is required for mitotic progression and regulates Plk1. Oncogene. 2008;27:4900–4908. doi: 10.1038/onc.2008.131. [DOI] [PubMed] [Google Scholar]
- Molli PR, et al. Arpc1b, a centrosomal protein, is both an activator and substrate of Aurora A. J Cell Biol. 2010;190:101–114. doi: 10.1083/jcb.200908050. [DOI] [PMC free article] [PubMed] [Google Scholar]
- Mori D, et al. NDEL1 phosphorylation by Aurora-A kinase is essential for centrosomal maturation, separation, and TACC3 recruitment. Mol Cell Biol. 2007;27:352–367. doi: 10.1128/MCB.00878-06. [DOI] [PMC free article] [PubMed] [Google Scholar]
- Morin P, Flors C, Olson MF. Constitutively active RhoA inhibits proliferation by retarding G(1) to S phase cell cycle progression and impairing cytokinesis. Eur J Cell Biol. 2009;88:495–507. doi: 10.1016/j.ejcb.2009.04.005. [DOI] [PMC free article] [PubMed] [Google Scholar]
- Murray D, Horgan G, MacMathuna P, Doran P. NET1-mediated RhoA activation facilitates lysophosphatidic acid-induced cell migration and invasion in gastric cancer. Br J Cancer. 2008;99:1322–1329. doi: 10.1038/sj.bjc.6604688. [DOI] [PMC free article] [PubMed] [Google Scholar]
- Musacchio A, Salmon ED. The spindle-assembly checkpoint in space and time. Nat Rev Mol Cell Biol. 2007;8:379–393. doi: 10.1038/nrm2163. [DOI] [PubMed] [Google Scholar]
- Narumiya S, Yasuda S. Rho GTPases in animal cell mitosis. Curr Opin Cell Biol. 2006;18:199–205. doi: 10.1016/j.ceb.2006.02.002. [DOI] [PubMed] [Google Scholar]
- Oceguera-Yanez F, Kimura K, Yasuda S, Higashida C, Kitamura T, Hiraoka Y, Haraguchi T, Narumiya S. Ect2 and MgcRacGAP regulate the activation and function of Cdc42 in mitosis. J Cell Biol. 2005;168:221–232. doi: 10.1083/jcb.200408085. [DOI] [PMC free article] [PubMed] [Google Scholar]
- Papadimitriou E, Vasilaki E, Vorvis C, Iliopoulos D, Moustakas A, Kardassis D, Stournaras C. Differential regulation of the two RhoA-specific GEF isoforms Net1/Net1A by TGF-beta and miR-24: role in epithelial-to-mesenchymal transition. Oncogene. 2011;31:2862–2875. doi: 10.1038/onc.2011.457. [DOI] [PubMed] [Google Scholar]
- Qin H, Carr HS, Wu X, Muallem D, Tran NH, Frost JA. Characterization of the biochemical and transforming properties of the neuroepithelial transforming protein 1. J Biol Chem. 2005;280:7603–7613. doi: 10.1074/jbc.M412141200. [DOI] [PubMed] [Google Scholar]
- Rieder CL. The structure of the cold-stable kinetochore fiber in metaphase PtK1 cells. Chromosoma. 1981;84:145–158. doi: 10.1007/BF00293368. [DOI] [PubMed] [Google Scholar]
- Rossman KL, Der CJ, Sondek J. GEF means go: turning on RHO GTPases with guanine nucleotide-exchange factors. Nat Rev Mol Cell Biol. 2005;6:167–180. doi: 10.1038/nrm1587. [DOI] [PubMed] [Google Scholar]
- Sander EE, ten Klooster JP, van Delft S, van der Kammen RA, Collard JG. Rac downregulates Rho activity: reciprocal balance between both GTPases determines cellular morphology and migratory behavior. J Cell Biol. 1999;147:1009–1022. doi: 10.1083/jcb.147.5.1009. [DOI] [PMC free article] [PubMed] [Google Scholar]
- Sasai K, Parant JM, Brandt ME, Carter J, Adams HP, Stass SA, Killary AM, Katayama H, Sen S. Targeted disruption of Aurora A causes abnormal mitotic spindle assembly, chromosome misalignment and embryonic lethality. Oncogene. 2008;27:4122–4127. doi: 10.1038/onc.2008.47. [DOI] [PubMed] [Google Scholar]
- Schmidt A, Durgan J, Magalhaes A, Hall A. Rho GTPases regulate PRK2/PKN2 to control entry into mitosis and exit from cytokinesis. EMBO J. 2007;26:1624–1636. doi: 10.1038/sj.emboj.7601637. [DOI] [PMC free article] [PubMed] [Google Scholar]
- Schmidt A, Hall A. The Rho exchange factor Net1 is regulated by nuclear sequestration. J Biol Chem. 2002;277:14581–14588. doi: 10.1074/jbc.M111108200. [DOI] [PubMed] [Google Scholar]
- Shen SQ, Li K, Zhu N, Nakao A. Expression and clinical significance of NET-1 and PCNA in hepatocellular carcinoma. Med Oncol. 2008;25:341–345. doi: 10.1007/s12032-008-9042-6. [DOI] [PubMed] [Google Scholar]
- Shen X, Li J, Hu PP, Waddell D, Zhang J, Wang XF. The activity of guanine exchange factor NET1 is essential for transforming growth factor-beta-mediated stress fiber formation. J Biol Chem. 2001;276:15362–15368. doi: 10.1074/jbc.M009534200. [DOI] [PubMed] [Google Scholar]
- Srougi MC, Burridge K. The nuclear guanine nucleotide exchange factors Ect2 and Net1 regulate RhoB-mediated cell death after DNA damage. PLoS One. 2011;6:e17108. doi: 10.1371/journal.pone.0017108. [DOI] [PMC free article] [PubMed] [Google Scholar]
- Tanenbaum ME, Macurek L, van dV, Galli M, Akhmanova A, Medema RH. A complex of Kif18b and MCAK promotes microtubule depolymerization and is negatively regulated by Aurora kinases. Curr Biol. 2011;21:1356–1365. doi: 10.1016/j.cub.2011.07.017. [DOI] [PubMed] [Google Scholar]
- Tatsumoto T, Sakata H, Dasso M, Miki T. Potential roles of the nucleotide exchange factor ECT2 and Cdc42 GTPase in spindle assembly in Xenopus egg cell-free extracts. J Cell Biochem. 2003;90:892–900. doi: 10.1002/jcb.10750. [DOI] [PubMed] [Google Scholar]
- Tatsumoto T, Xie X, Blumenthal R, Okamoto I, Miki T. Human Ect2 is an exchange factor for Rho GTPases, phosphorylated in G2/M phases, and involved in cytokinesis. J Cell Biol. 1999;147:921–927. doi: 10.1083/jcb.147.5.921. [DOI] [PMC free article] [PubMed] [Google Scholar]
- Tu Y, Lu J, Fu J, Cao Y, Fu G, Kang R, Tian X, Wang B. Over-expression of neuroepithelial-transforming protein 1 confers poor prognosis of patients with gliomas. Jpn J Clin Oncol. 2010;40:388–394. doi: 10.1093/jjco/hyp186. [DOI] [PubMed] [Google Scholar]
- Venoux M, Basbous J, Berthenet C, Prigent C, Fernandez A, Lamb NJ, Rouquier S. ASAP is a novel substrate of the oncogenic mitotic kinase Aurora-A: phosphorylation on Ser625 is essential to spindle formation and mitosis. Hum Mol Genet. 2008;17:215–224. doi: 10.1093/hmg/ddm298. [DOI] [PubMed] [Google Scholar]
- Wu D, Asiedu M, Adelstein RS, Wei Q. A novel guanine nucleotide exchange factor MyoGEF is required for cytokinesis. Cell Cycle. 2006;5:1234–1239. doi: 10.4161/cc.5.11.2815. [DOI] [PMC free article] [PubMed] [Google Scholar]
- Yasuda S, Oceguera-Yanez F, Kato T, Okamoto M, Yonemura S, Terada Y, Ishizaki T, Narumiya S. Cdc42 and mDia3 regulate microtubule attachment to kinetochores. Nature. 2004;428:767–771. doi: 10.1038/nature02452. [DOI] [PubMed] [Google Scholar]
- Yoshizaki H, Ohba Y, Kurokawa K, Itoh RE, Nakamura T, Mochizuki N, Nagashima K, Matsuda M. Activity of Rho-family GTPases during cell division as visualized with FRET-based probes. J Cell Biol. 2003;162:223–232. doi: 10.1083/jcb.200212049. [DOI] [PMC free article] [PubMed] [Google Scholar]
- Yuce O, Piekny A, Glotzer M. An ECT2-centralspindlin complex regulates the localization and function of RhoA. J Cell Biol. 2005;170:571–582. doi: 10.1083/jcb.200501097. [DOI] [PMC free article] [PubMed] [Google Scholar]
- Zhang X, Ems-McClung SC, Walczak CE. Aurora A phosphorylates MCAK to control ran-dependent spindle bipolarity. Mol Biol Cell. 2008;19:2752–2765. doi: 10.1091/mbc.E08-02-0198. [DOI] [PMC free article] [PubMed] [Google Scholar]
- Zhao ZS, Lim JP, Ng YW, Lim L, Manser E. The GIT-associated kinase PAK targets to the centrosome and regulates Aurora-A. Mol Cell. 2005;20:237–249. doi: 10.1016/j.molcel.2005.08.035. [DOI] [PubMed] [Google Scholar]