

Abstract
We have used a new approach to study the neural decoding function that converts the population response in extrastriate area MT into estimates of target motion to drive smooth pursuit eye movement. Experiments reveal significant trial-by-trial correlations between the responses of MT neurons and the initiation of pursuit. The preponderance of significant correlations and the relatively low reduction in noise between MT and the behavioral output support the hypothesis of a sensory origin for at least some of the trial-by-trial variation in pursuit initiation. The finding of mainly positive MT-pursuit correlations, whether the target speed is faster or slower than the neuron’s preferred speed, places strong constraints on the neural decoding computation. We propose that decoding is based on normalizing a weighted population vector of opponent motion responses; normalization comes from neurons uncorrelated with those used to compute the weighted population vector.
Keywords: MT, visual motion, noise correlations, neuron-behavior correlations, vector averaging, maximum likelihood
Introduction
Sensory-motor behavior requires a transformation between two very different representations of the desired movement. The sensory cortex contains “topographic” organizations of stimulus parameters such as the orientation of a visual stimulus or the frequency of a sound. Thus, different stimuli cause different groups of neurons to be highly active. For example, smooth motion of a small object causes responses in a population of neurons in extrastriate area MT; the largest responses occur in neurons that have receptive fields in the stimulated location and that prefer the speed and direction of the object’s motion. Target motions at different speeds or directions cause peak responses in different MT neurons. MT provides the sensory drive for the system we study, smooth pursuit eye movements (Newsome et al., 1985; Groh et al., 1997; Born et al., 2000).
In the motor pathways for pursuit, the representation of the desired eye motion is quite different from that in MT. In cerebellar neurons that are two synapses removed from the extraocular motoneurons, eye direction is determined by the relative firing of neurons that prefer horizontal versus vertical eye motion; eye speed is determined by the absolute firing rate of all neurons (Krauzlis and Lisberger, 1996). Thus, one of the major challenges faced by the pursuit circuit, and all sensory-motor behaviors, is to “read-out” or “decode” the sensory population response in a way that transforms sensory representations into the coordinate system of the muscles. The readout is continuous in the sense that it attempts to match eye velocity to whatever target velocity is present, rather than making a forced-choice decision among a small number of speeds and/or directions (Lisberger and Westbrook, 1985; Osborne et al., 2005).
The initiation of pursuit uses the population response in area MT to estimate target velocity: T⃑ = f(rMT). The estimate of target velocity then is converted to commands for pursuit, possibly with some added noise: E⃑ = T⃑ + ξ. Our previous work has led to the hypothesis of a sensory origin for most of the variation in the initiation of pursuit (Osborne et al., 2005, 2007; Medina and Lisberger, 2007), with little or no noise, ξ, added after sensory estimation. Sensory noise exists because correlations between the responses of individual MT neurons limit noise reduction by pooling across the population (Shadlen et al., 1996; Huang and Lisberger, 2008).
One goal of the present paper was to provide a critical test of the hypothesis of a sensory origin to motor noise. If the hypothesis is true, then the trial-by-trial variation in responses of individual MT neurons should be correlated with the variation in the initiation of pursuit: there should be strong “MT-pursuit” correlations. The hypothesis also predicts that the trial-by-trial variance of pursuit initiation should be only modestly smaller than the trial-by-trial variance of the responses of MT neurons, because of the limits on noise reduction. Our data satisfy both of these predictions, providing strong, direct support for the hypothesis of a sensory origin for at least some of the variation in pursuit initiation. Our findings in pursuit initiation imply generality for the suggestion that much of the variation in arm movements (Churchland et al., 2006) or saccadic eye movements (van Beers, 2007) arises in the brain, rather than in the motor effectors (Wolpert and Harris, 1998).
The other goal in the present paper was to constrain the function f that decodes the population response in MT to estimate target velocity, T⃑ = f(rMT). Given that the responses of MT neurons show trial-by-trial correlations with the initial eye velocity of pursuit, the details of the MT-pursuit correlations should probe the exact mechanisms used by pursuit for population decoding. We find positive MT-pursuit correlations in almost all neurons with statistically significant correlations, without regard for whether the target speed is faster or slower than the neuron’s preferred speed. Computational analysis shows that this “structure” of MT-pursuit correlations would result from a specific version of vector averaging decoding computations. Importantly, the data contradict the predictions of other popular decoding computations, including traditional vector averaging and maximum likelihood estimation.
Results
We recorded responses of 104 neurons in visual area MT of two monkeys (52 neurons each in monkeys Y and J). The same population of neurons contributed to a prior paper (Hohl and Lisberger, 2011) that analyzed the responses of MT neurons to the small image motions present during the eye movements of fixation. We now report on a conceptually different issue, namely the trial-by-trial correlations between the responses of MT neurons to imposed target motion and the subsequent initiation of smooth pursuit eye movements.
We used a modified step-ramp pursuit task (Osborne et al., 2007; Rashbass, 1961) with three distinct epochs of visual stimulation (Figure 1). First, the dots appeared in the receptive field of the neuron under study and remained stationary for a variable amount of time (300–800 ms). The delay between dot appearance and dot motion allowed us to isolate the response to target motion by separating it in time from the transient caused in many neurons by the onset of a visual stimulus; the variable duration prevented the monkey from anticipating the time of onset of target motion. Next, the dots moved locally across the receptive field within a stationary virtual aperture for 100 ms to causes the monkey to initiate pursuit. This approach keeps the moving stimulus positioned on the receptive field of the neuron under study for the interval of stimulus presentation that drives the responses we measure. Dot motion within a stationary virtual aperture causes pursuit initiation that is indistinguishable from that evoked by the en bloc motion of the dots and the aperture (Osborne et al., 2007). Lastly, we moved the virtual aperture at the same speed as the dots for 250 to 700 ms, to require the monkey to use the pursuit he has initiated to track a moving target as the basis for delivery of a fluid reward.
Figure 1.
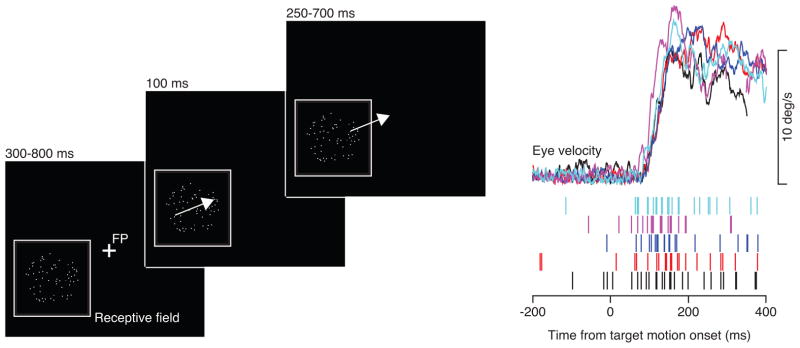
The pursuit task. The schematic on the left shows the 3 important intervals in stimulus presentation, described in the text. The traces on the right show simultaneous recordings of smooth eye velocity and rasters indicating spikes in a single MT neuron, plotted as a function of time. Colors indicate the correspondence between spike trains and eye movements.
Even though our task provided the same compelling visual motion on each trial and the monkeys performed the behavioral task diligently, the eye velocity at the initiation of pursuit (see traces in Figure 1) was somewhat variable from trial-to-trial (Osborne et al., 2005). As expected, neural responses in area MT also varied considerably from trial-to-trial (rasters in Figure 1). Our analysis leverages the naturally-occurring variation in both neural and behavioral responses.
MT-pursuit correlations
We observed clear trial-by-trial correlations between the firing rates in MT neurons and eye speed in the initiation of pursuit. The images in Figure 2 show the average MT-pursuit correlations separately for the two populations of neurons recorded in the two monkeys. Each pixel shows the MT-pursuit correlation across many trials for the pair of times indicated on the x- and y-axes; the full image shows MT-pursuit correlations for all combinations of times in the eye speed and firing rate. Zero on each axis indicates the time of onset of the motion of the dots within the stationary aperture.
Figure 2.

MT-pursuit correlations. Each pixel shows the trial-by-trial correlation between MT firing rate at the time on the y-axis and eye speed at the time on the x-axis. Data are averaged across data for all neurons and all target motions in directions that were within 90 degrees of preferred direction. The dashed and continuous diagonal lines indicate pixels for firing rates that precede eye velocity by 60 or 0 ms. A, C: Correlations calculated on original data. B, D: Correlations calculated after removal of temporal autocorrelation from the initiation of pursuit.
To obtain MT-pursuit correlations that were uncontaminated by small eye drifts during fixation (Hohl and Lisberger, 2011), we used the filtering procedure outlined in the Methods to remove autocorrelations in eye speed that could contaminate MT-pursuit correlations. In both monkeys, there was a strong patch of positive correlations both before (Figure 2A, B) and after (Figure 2C, D) filtering of eye velocity. Filtering attenuated the MT-pursuit correlations somewhat but did not change their pattern. The filtered MT-pursuit correlations were similar in monkey J (Figure 2C) and monkey Y (Figure 2D), and were large and positive for the correlation of MT responses from 20 to 60 ms after the onset of target motion with pursuit from 80 to 120 ms after the onset of target motion. Because the positive MT-pursuit correlations appeared for times when neural responses precede the eye movement by 60 ms (oblique dashed line), they are consistent with a causal influence of MT firing on eye speed. The remainder of the paper shows MT-pursuit correlations only after removal of temporal autocorrelations in eye velocity.
We have analyzed MT-pursuit correlations in three 40 ms intervals using firing rate from 20–140 ms, and the eye velocity from 80–200 ms, after the onset of target motion. These intervals represent the time when image motion precedes eye motion, and when pursuit is driven in an open-loop manner by the visual motion present before pursuit begins. In this interval, the image motion is the same on every trial; MT-pursuit correlations seem to arise because the fluctuations in MT responses are driving the fluctuations in eye velocity. Outside of the analysis interval, we found negative MT-pursuit correlations for time intervals when the neural response lagged the eye movements (Figure 2, blue pixels). The timing of the negative correlations is not consistent with a causal effect of firing rate on eye velocity. It suggests, instead, an effect of eye velocity on MT firing rate. Because image motion is equal to target motion minus eye motion, trial-by-trial differences in eye velocity during the initiation of pursuit will cause differences in image motion across the retina, leading to a correlated effect on the firing of MT neurons 60 ms later. The negative MT-pursuit correlations also could arise from temporal autocorrelation in eye velocity after the initiation of pursuit eye movements, possibly due to oscillations that can follow the initial rising phase of eye velocity (Goldreich et al., 1992).
Structure of MT-pursuit correlations
We address next the relationship among the stimulus speed and direction, the tuning parameters of an MT neuron, and the sign and magnitude of its MT-pursuit correlation. We show in a later section that this relationship sheds light on the nature of the decoding computation used to estimate target speed from the responses of the population of MT neurons.
We computed MT-pursuit correlations for stimulus speeds and directions at different places on the tuning curves of the neuron under study, always correlating MT firing with eye velocity 60 ms later. For each individual neuron, we were able to study only a few combinations of direction and speed, so we assembled a full picture of the “structure” of MT-pursuit correlations by combining the results across the full population of neurons. Overall, we obtained 540 estimates of MT-pursuit correlations for 104 MT neurons, with individual neurons contributing between 2 and 12 stimulus conditions. In Figure 3, each symbol shows the results for one stimulus speed and direction in one neuron.
Figure 3.

MT-pursuit correlations as a function of the tuning properties of MT neurons. Each symbol shows results for one target motion in one neuron. Open and filled symbols indicate significant or non-significant correlations. A–D: Correlation coefficients between MT firing rates and eye speed plotted as a function of the difference between target direction and preferred direction of the neuron under study. E–H: Correlation coefficients between MT firing rates and eye speed plotted as a function of target speed as a percentage of preferred speed of the neuron under study. The four columns of graphs show correlations for different intervals of eye velocity, where the lag between firing rate and eye speed was held constant at 60 ms. The 0–40 ms interval occurs before any effect of visual motion; the other intervals represent the first 120 ms of pursuit.
MT-pursuit correlations were largest and most likely to be statistically significant (open symbols) when we correlated MT firing in the interval from 20 to 60 ms after the onset of target motion with the eye velocity in the interval from 80 to 120 ms after the onset of target motion (Figure 3B, F). Significant positive or negative correlations appeared in 42.44% or 16.79% of the stimulus conditions. MT-pursuit correlations were more positive for target directions near the preferred direction of the neuron under study, and more negative for target directions nearly opposite to the preferred direction of the neuron under study (Figure 3B). In contrast to the findings for direction, the sign of MT-pursuit correlations depended little on the speed of the stimulus relative to the preferred speed of neurons (Figure 3F). Most of the statistically significant MT-pursuit correlations were positive; most of the negative MT-pursuit correlations represent data for stimulus motion near the non-preferred direction. The magnitude of the significant correlations in Figure 3F tended to get larger as stimulus speeds increased up to the preferred speed of the neuron under study.
We found fewer examples of significant MT-pursuit correlations for eye velocity in the intervals from 120 to 160 ms (Figure 3C, G) or from 160 ms to 200 ms (Figure 3D, H) after the onset of stimulus motion, even though we retained the 60 ms time difference between firing rate and eye velocity. Fewer than 10% of MT neurons showed significant MT-pursuit correlations for the interval that preceded the initiation of pursuit, incorporating eye velocity from 0–40 ms after the onset of stimulus motion (Figure 3A, E). In some experiments we used a different random seed and a different random dot pattern for each trial, and in others we used the same seed and the same dot pattern for all trials. We found significant MT-pursuit correlations under both conditions, with a surprising tendency toward larger correlations when we used the same dot pattern repeatedly.
Analysis of the distributions of MT-pursuit correlations revealed statistically significant positive or negative shifts in Figure 3B, depending on whether the direction of target motion was within 90 degrees of the preferred versus the non-preferred direction of the neuron under study. The mean correlations were 0.1 and −0.03, respectively. The mean values of MT-pursuit correlation were so close to zero in Figures 3A, C, and D that statistical evaluation seemed meaningless. The prevalence of statistically significant trial-by-trial MT-pursuit correlations during the initiation of pursuit supports the hypothesis of a sensory origin of the variation in the initiation of pursuit more strongly than did prior data, which were strictly inferential (Osborne et al., 2005).
To represent the structure of MT-pursuit correlations in a way that would be easy to compare with the results of computational analysis, we averaged the MT-pursuit correlations in bins according to the neuron’s preferred speed and direction, relative to target speed and direction. The red and yellow pixels on the left side of Figure 4A indicate positive MT-pursuit correlations for neurons with preferred directions within 90 degrees of target direction. As shown earlier (Figure 3F), the MT-pursuit correlation did not vary strongly along the y-axis, as a function of preferred speed. The blue and green pixels on the right side of Figure 4A indicate zero or small negative MT-pursuit correlations for neurons with preferred directions within 90 deg of opposite to the direction of target motion. White pixels indicate bins without data and provide a mask that also was used to present the MT-pursuit correlations for simulated population decoding in the other panels of Figure 4.
Figure 4.

Comparison of MT-pursuit correlation structure of the data (A) with the predictions of various decoding models (B–G). The color of each pixel indicates the mean value of the MT-pursuit correlation for real or model units. Data are for the earliest 40-ms analysis interval during pursuit.
Computational analysis of MT-pursuit correlations
We used equations given in the Methods to create populations of model MT neurons that had mean tuning curves, response variance, and noise correlations like those found in our recordings from area MT (Huang & Lisberger, 2009). Each unit’s response on each trial was a single number that was intended to represent the spike count within a 40-ms analysis interval. The model MT population consisted of 3600 units, with 60 preferred directions at a 6 degree spacing and 60 preferred speeds spaced uniformly in log2(speed) between 0.5 and 512 deg/s. We created 1000 simulated population responses (or trials) for target motion at 16 deg/s in one direction and applied several decoding computations to estimate the target direction and speed from the population response in each simulated trial. Finally, we computed each decoder’s predictions for MT-pursuit correlations with the same analysis procedures we had applied to our recordings from area MT.
Most of the decoding computations we used are structured as “vector averaging”, a family of decoding computations that can reproduce much of pursuit behavior, defined by S⃗ in Equation (1). Vector averaging computes the vector sum of MT responses (Ri) weighted by their preferred speed (si) and a unit vector in their preferred direction (θ⃗i) in the numerator; it divides by the sum of MT responses for normalization:
| (1) |
The equations for our decoders, by using the subscripts i versus j in the numerator and denominator, include the possibility of using different populations of model neurons for the numerator and denominator. This feature allows implementation of the principle that normalization might be based on an estimate rather than a calculation of total population activity (Chaisanguanthum and Lisberger, 2011). It also allows us to explore the new idea that there need not be neuron-neuron correlations between the populations of model units that contribute to the population vector sum and the normalization. In all models, however, we created neuron-neuron correlations within the numerator or denominator populations.
MT-pursuit correlations predicted by different population decoders
There were two important ingredients of decoding models that predicted our data successfully. One was an opponent computation in the numerator, to create different signs of MT-pursuit correlations for neurons with preferred directions near versus opposite to the direction of target motion. The other was the lack of correlation between the model neurons that contribute to the weighted population vector in the numerator versus the normalization in the denominator, to create mostly positive MT-pursuit correlations for neurons with preferred directions within 90 degrees of target direction.
Figure 4B provided a good qualitative match to the data in Figure 4A, for a form of vector averaging that used opponent motion signals in the numerator and the sum of activity in a different population of model neurons in the denominator (Churchland & Lisberger, 2001; Huang & Lisberger, 2009; Yang & Lisberger, 2009):
| (2) |
| (3) |
| (4) |
We created opponent motion signals by weighting responses by the sine and cosine of preferred direction (Equations 2 and 3), effectively computing: the response of a model unit with a given preferred direction minus the response of a model unit with the same preferred speed but the opposite preferred direction. Horizontal and vertical eye speeds sh and sv were decoded separately and combined to obtain the speed s (Equation 4). We achieved independence of the model populations for the numerator and denominator by creating two separate populations indexed by i and j, where the model units’ responses were correlated within but not between populations. We scaled the denominator by k to ensure that the estimate of target speed has the correct amplitude, on average. Although it provides the best fit to our data, even Figure 4B does not mimic the data perfectly. It shows a tendency for smaller MT-pursuit correlations for model neurons with lower preferred speeds, a tendency that was weak but visible in our data (Figure 3F and 4A).
We found somewhat worse agreement with the data when we decoded with “numerator-opponent vector averaging” (Equations 2–4) using the same, correlated, neurons in the numerator and denominator (Churchland & Lisberger, 2001). In broad strokes, the predicted MT-pursuit correlations (Figure 4C) were positive versus negative for model neurons with preferred directions within 90 degrees of target direction versus within 90 degrees of the opposite direction. However, the model predicted small negative MT-pursuit correlations that were not seen in our data for neurons with preferred directions from 22 to 90 degrees different from target direction and preferred speeds below target speed. Numerator-opponent vector averaging is more successful than some of our other decoders, because the use of opponent motion signals only in the numerator partially de-correlates the numerator and denominator even though the same population of model MT neurons contributes to both.
The three decoding computations used in Figures 4D–F failed qualitatively to predict the MT-pursuit correlations in our data. In each case, the predicted MT-pursuit correlations depended strongly on the difference between target speed and preferred speed when target direction was within 90 degrees of the preferred direction. Each graph has positive MT-pursuit correlations in the upper-left quadrant and negative MT-pursuit correlations in the lower-left quadrant. In our data, MT-pursuit correlations were positive in both of these quadrants. The decoding computation used in Figure 4D was standard vector averaging (Groh, 2001; Groh et al, 1997; Lisberger & Ferrera, 1997; Priebe & Lisberger, 2004; Salinas & Abbott, 1994):
| (8) |
where s is the estimate of speed, and Ri the response of the ith neuron. Standard vector averaging estimates only target speed, and not target direction. The decoding computation used in Figure 4E was fully-opponent vector averaging using the same model populations in the numerator and denominator:
| (2) |
| (3) |
| (4) |
where and . The decoding computation used in Figure 4F was the maximum likelihood computation of Deneve et al. (1999) under the assumption of a uniform prior:
| (9) |
Here, a is the vector of neural responses on a given trial, Rmean (s,θ) is a vector describing the mean response of the model population, and C is a matrix that describes the structure of the covariance among neurons in the model MT population. The neurally-plausible maximum likelihood decoder of Jazayeri and Movshon (2006) failed in the same ways shown in Figure 4F.
Because the maximum likelihood decoder in Equation (9) was designed to work with Gaussian noise in the model neurons, we verified that we obtained the same results with either Gaussian or Poisson noise. Also, we verified that MT-pursuit correlations from the maximum-likelihood decoder we used were smaller than those resulting from a maximum-likelihood decoder that ignores neuron-neuron correlations (data not shown). We think the maximum-likelihood decoding model fails to compensate fully for the correlated responses because it knows only the structure of the correlations but cannot fully anticipate the exact correlations in any given run of the model.
The properties of the decoder are the main determinant of the structure of the MT-pursuit correlations; de-correlation of the neural populations that contribute to the numerator and denominator is the key factor for reproducing our data qualitatively. The properties of the MT population affect the magnitude but not the structure of the model’s MT-pursuit correlations for all decoders. The magnitude increased with i) increases in the magnitude of neuron-neuron correlations in MT, ii) increases in the breadth of neuron-neuron correlations as a function of differences in preferred speed or direction of a pair of neurons, and iii) increases in the amplitude of the population response. MT-pursuit correlations effectively vanish for model MT populations with uniform, rather than structured, neuron-neuron correlations, or model MT populations without neuron-neuron correlations. We subtracted these residual correlations caused by the finite size of the model MT population from each bin in Figure 4B–F.
Predictions of linear decoders
At the suggestion of an anonymous reviewer, we also demonstrate that the structure of MT-pursuit correlations in our data was reproduced by an optimal linear decoder that computes the weighted sum of the responses of a population of model MT neurons. For the same MT population responses used to create Figure 4, we computed the weight matrix W that provided the best prediction of target velocity (S’) through linear decoding:
| (10) |
where R is a matrix of model neurons with different preferred speeds and directions. We then computed MT-pursuit correlations exactly as we did for our data, leading to the image in Figure 4G. The optimal linear decoder reproduces the pattern of MT-pursuit correlations in our data, with large positive correlations for neurons with preferred directions within 90 degrees of target direction, small negative correlations for neurons with preferred directions more than 90 degrees different from target direction, and very little modulation of MT-pursuit correlation as a function of the preferred speed of the model neuron. We note that the optimal linear decoder is a generalization of vector summation, which would decode target velocity effectively for a sufficiently regular population response, and also would yield a structure of MT-pursuit correlations like that in our data.
Even though optimal linear decoders reproduce the structure of the MT-pursuit correlations in our data, other publications present pursuit data that can be accounted for only by a non-linear decoder that employs divisive normalization. Because linear decoders lack normalization, we do not think that they can work for pursuit, and we favor the class of nonlinear decoders that also reproduce the structure of the MT-pursuit correlations in the data. We will treat this issue in greater detail in the Discussion.
Removal of eye velocity temporal correlations
We showed in a prior paper that there are small oscillations in eye velocity during fixation before the onset of pursuit and that these can drive changes in firing in some MT neurons (Hohl and Lisberger, 2011). If our filtering procedure failed to remove those oscillations completely, then we might have recorded artifactual MT-pursuit correlations. Therefore, we performed an essential control to test whether the variation in the filtered eye velocity at pursuit initiation was correlated with variation in eye velocity during fixation.
We illustrate the temporal autocorrelations in the unfiltered data (Figure 5A) to show the nature of the problem. We computed the residual eye velocity for each trial, defined as the actual eye velocity minus the mean for its particular stimulus. Next, we binned all individual trials from all MT neurons in 13 groups according to the eye velocity at the time the visual stimulus started to move. Then, we averaged time course of the residual eye velocity projected along the preferred direction of the neuron under study in each of the 13 bins. In the unfiltered data (Figure 5A), the presence of temporal correlations in eye velocity cause the ordering of eye velocity in the interval from 80 to 120 ms after the onset of stimulus motion to be almost exactly opposite to the order of the same eye velocity traces at the time the stimulus started to move (−50 to 50 ms). A strong inverse relationship appears in a graph of the average, unfiltered, eye velocity residual 100 ms after the onset of target motion as a function of that at target motion onset (Figure 5C, filled symbols).
Figure 5.
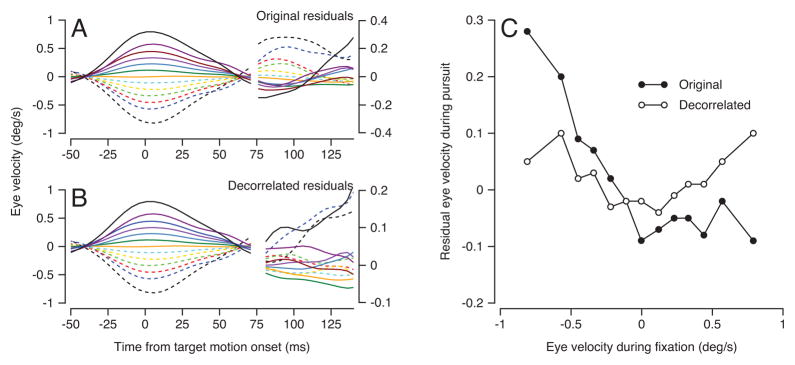
Effect of removing temporal autocorrelations in eye velocity. A, B: averages showing eye velocity projected onto the preferred direction of each neuron as a function of time before (A) and after (B) filtering to remove autocorrelations. Different colored traces show averages across trials in 13 bins according to the value of eye velocity at the time of target motion onset. The traces after the break are plotted at higher amplitudes to show the presence and absence of the autocorrelation more clearly. C: Graph of the residual eye velocity 100 ms after the onset of stimulus motion, during pursuit initiation, as a function of that during fixation, at the time of target motion onset. Open and filled symbols show data after versus before removal of the temporal autocorrelations in eye velocity.
The systematic temporal correlation in eye velocity was removed by the filtering procedure. In Figure 5B, the ordering persists during fixation because we derived the filters during fixation but applied them only during the initiation of pursuit. However, the filtered eye velocities in the interval from 80 to 120 ms after the onset of target motion have lost the systematic ordering seen before filtering. The weaker “U”-shaped relationship that appears instead in Figure 5C (open symbols) would not promote spurious MT-pursuit correlations. Therefore, the small eye movements of fixation do not cause the MT-pursuit correlations in our data.
Noise reduction
The eye speed at the initiation of pursuit shows “endpoint” variance of about 15% of the mean speed (Osborne et al., 2005). From the perspective of sensory processing, the endpoint variance could arise from correlated noise in the responses of MT neurons (Huang and Lisberger, 2009), or from downstream sources including noise added by the population decoders (e.g. Shadlen et al., 1996). These two potential sources trade off in a potentially informative way. Larger, structured neuron-neuron correlations in MT cause larger MT-pursuit correlations (Schoppik et al., 2008) and larger endpoint variance (Huang and Lisberger, 2009). Larger downstream noise causes smaller MT-pursuit correlations and larger endpoint variance (Medina and Lisberger, 2007). Thus, we might further our understanding of the source(s) of endpoint variation in pursuit initiation if we could quantify the amount of noise reduction between the responses of MT neurons and the motor output.
Given the large number of MT neurons that probably contribute to pursuit, one might expect noise reduction to be excellent. However, either sensory noise or downstream noise would limit noise reduction. To compare neural to behavioral noise, we transformed eye speed in each behavioral trial into the same units as the firing rate of the MT neuron recorded at the same time. First, we converted eye speed 100 ms after the onset of pursuit (Ėi(100) ) to an estimate of target speed (Ṫi) as:
| (11) |
Equation (11) normalizes the eye velocity from each trial so that the mean normalized eye velocity was equal to the actual target velocity. The dots over the symbols indicate speed, Ṫ and Ė refer to the target and the eye, i indexes the trials, and the denominator is the mean across all trials. We performed the analysis for eye velocity at t=100 ms because this time marks the end of the open-loop period when pursuit is driven purely by the target motion present before the onset of pursuit. Second, we converted the estimate of target speed for each trial to the units of spikes/s by projecting through the mean speed tuning curve for the neuron under study, as illustrated in Figure 6A. Finally, we characterized noise reduction by expressing the variance of eye velocity in units of spikes/s as a percentage of the variance of actual firing rate, and plotted the result as a function of preferred speed normalized to target speed (Figure 6B).
Figure 6.

Noise reduction between the firing of single neurons in MT and pursuit eye speed. A: Schematic showing how the speed tuning curve of an MT neuron is used to convert eye speed 200 ms after the onset of target motion into units of spikes/s. The speed-tuning curve was based on firing rates 25–140 ms after motion onset. B: Noise reduction is plotted as a function of the preferred speed of the real or model neuron, shown as a percentage of target speed. Open symbols show data for different MT neurons when the difference between preferred and target direction was less than 90 degrees. The red and blue curves show the range of predictions from the numerator-opponent vector-averaging model with different, uncorrelated populations used in the numerator and denominator versus the maximum likelihood computation of Deneve et al. (1999). Note that each decoding model produced a range of values of noise reduction at each value of preferred speed, because of the different response amplitudes and variances of neurons with different preferred directions.
The shape of the mean tuning curves leads to the “M” shaped functions in Figure 6B, for both the data (symbols) and the model MT neurons (red and blue traces). A given variance in degrees/s converts to different variances in spikes/s depending on the location of target velocity relative to the peak of the neuron’s tuning curve. Near the preferred speed of a neuron, variation in estimates of target velocity converts into small values of variance in spikes/s. On the flanks of the tuning curve, the same variation in eye velocity converts into a large variance in spikes/s. The M-shaped function for the data in Figure 6B (open symbols) clustered around an eye velocity variance that was 6.6% of firing rate variance, or a 15-fold variance reduction. The combination of low noise reduction and significant MT-pursuit correlations supports a sensory source for much of the variation in the initiation of pursuit.
Analysis of the predictions of the decoding models for variance reduction reveals that endpoint noise does not depend on the details of vector averaging, or on whether the neurons contributing to the numerator and denominator are correlated. We use the red curves in Figure 6B to show the range of predictions for the vector averaging decoder with uncorrelated numerator and denominator that provided MT-pursuit correlations closest to the data (Figure 4B). The maximum likelihood decoder of Jazayeri and Movshon (2006) predicts noise reduction in line with the vector averaging decoders. The maximum likelihood decoder of Deneve et al. (1999) predicts somewhat more noise reduction than does vector averaging (Figure 6B, blue curves versus red curves), as might be expected given that this decoder knows the structure of the neuron-neuron correlations. The curves for the maximum likelihood decoder (blue) bracket the bottom half of the data, but the data are quite variable from neuron-to-neuron and do not discriminate strongly among the different decoder models.
Discussion
We found reliable correlations between the trial-by-trial fluctuations in the activity of single neurons in visual area MT and the variation in eye speed in the visually-guided initiation of pursuit eye movements. These correlations allow two independent conclusions. First, the existence of MT-pursuit correlations implies that the correlated variation in MT responses provides a sensory source for motor variation (Osborne et al., 2005). Second, the nature of the decoding computation is constrained by the relationship between the sign of MT-pursuit correlations and the preferred speed and direction of the neuron under study.
Implications of MT-pursuit correlations for the origin of “motor” noise
MT-pursuit correlations probably arise from propagation of the correlated neural variation in MT to the motor output (Bair et al., 2001; Huang and Lisberger, 2009). Correlations do not prove causation, but we also know that the initiation of smooth pursuit eye movements relies on signals from MT (Newsome et al., 1985) and that microstimulation in MT can affect smooth eye velocity (Groh et al., 1997; Born et al., 2000) and drive learning in pursuit (Carey et al., 2005). MT-pursuit correlations are largest between the first 40 ms of MT firing rate and eye velocity, so that firing rate precedes eye velocity by ~60 ms. The MT-pursuit correlations probably cannot be attributed to parallel fluctuations in MT firing and pursuit strength driven by the attentional state of the monkey, because attentional effects emerge in MT only after the first 100 ms of the neural response (Treue & Maunsell, 1996; Cook & Maunsell, 2004).
The existence of MT-pursuit correlations provides direct evidence in support of prior suggestions of a sensory origin for at least some of the variation in the initiation of pursuit. The prior suggestions were based on three observations. 1) More than 90% of the variation of pursuit can be accounted for by errors in estimating the sensory parameters of target speed, target direction, and the time of target motion onset (Osborne et al., 2005). 2) Pursuit and perception show similar amounts of variation, suggesting a common source of noise in the sensory representation (Osborne et al., 2005). 3) The magnitude of the neuron-pursuit correlations in both the floccular complex of the cerebellum and the smooth eye movement region of the frontal eye fields imply that all the variation in the visual guidance of pursuit arises upstream from those structures (Medina & Lisberger, 2007; Schoppik et al., 2008). Studies of saccadic eye movements agree that much of motor variation may originate in sensory processing (van Beers, 2007; Hu et al., 2007).
Given that signals must propagate across multiple synapses from MT to reach the motor neurons, we find it remarkable that fluctuations in the responses of many individual sensory neurons co-vary with the motor behavior. We take refuge in the observation of Schoppik et al. (2008) that two conditions must be satisfied for trial-by-trial correlations to emerge between neural responses and pursuit eye velocity. There must be relatively little noise added downstream and the causal neural population must be either very small or correlated sufficiently to behave as if it contains a small number of neurons (Bair et al., 2001; Shadlen et al., 1996; Huang & Lisberger, 2009). One interpretation of the 15-fold reduction in variance between the discharge of single MT neurons and pursuit eye velocity is that the neuron-neuron correlations in MT make the population behave as if it has only 15 neurons. An alternate interpretation is that the neuron-neuron correlations make the population behave as if it has 100 neurons, as concluded by Shadlen et al. (1996), and modest noise is added to the estimates of target velocity downstream from MT. However, the presence of MT-pursuit correlations makes it likely that at least some of the variation in pursuit arises from correlated noise in MT.
We think that only modest noise can be added downstream from MT. If a large amount of noise were added downstream from MT, then we would not expect to see MT-pursuit correlations at all without positing neuron-neuron correlations much larger than reported by Huang and Lisberger (2009). If noise is added downstream from MT, it must be added between MT and the Purkinje cells of the floccular complex, as no additional noise seems to be added downstream from the Purkinje cells (Medina and Lisberger, 2007).
Linear versus non-linear population decoders
Prior research focused our attention on non-linear rather than linear decoders to convert the population response in MT into estimates of the speed and direction of target motion. Our reasoning is that estimates of the parameters of sensory events should be reasonably resilient against large changes in the magnitude of neural responses. Decoders should estimate the preferred stimuli of the most active neurons, in this instance the speed and direction of the most active neurons in the MT population. Vector averaging is one example of a decoder that finds the peak of the population response independent of the overall magnitude of neural responses. Vector averaging is non-linear in the sense that it relies on divisive normalization by the total amplitude of the population response. Divisive normalization has been a major feature of the conversation about cortical processing and population decoding since the earliest papers on the topics (Heeger, 1993; Groh, 2001).
Considerable prior research suggests that pursuit relies on divisive normalization to estimate the speed and direction of target motion. Lisberger and Ferrera (1997) showed that the pursuit evoked by two targets is very close to the vector average of the pursuit evoked by each target singly. Both Niu and Lisberger (2011) and Fallah and Reynolds (2012) used stimuli comprised of multiple moving targets to provide additional evidence that divisive normalization is a fundamental component of the decoding computation. Churchland and Lisberger (2001) found that apparent motion increases the estimate of target speed by pursuit and perception at the same time as the magnitude of the MT population response decreases. Only a specific form of vector averaging, requiring normalization, could account for their data. Finally, in saccadic eye movements, Lee et al. (1998) used reversible inactivation of the superior colliculus to provide strong evidence in favor of a non-linear vector averaging decoder for programming saccadic eye movements, and equally strong evidence against the linear, vector summation decoder. Thus, much of what we know supports a need for divisive normalization in a non-linear decoder for converting sensory population responses into commands for eye movement.
Even though a linear decoder predicts the structure of the MT-pursuit correlations in our data, we favor the non-linear decoders that also reproduce the literature outlined above. That said, full disclosure dictates a comment on the fact that reduction of the contrast of pursuit targets moves the peak of the MT population response toward neurons with higher preferred speeds while reducing the eye speed in pursuit initiation (Krekelberg et al., 2006, Yang et al., 2012). Taken at face value, the effect of stimulus contrast appears to be more consistent with linear decoders that estimate the magnitude of the population response versus non-linear decoders that find the peak of the population response. However, we can use the Bayesian framework pioneered for speed perception (Weiss et al., 2002) to account for the effects of stimulus contrast within the context of non-linear, vector averaging decoders (Yang et al., 2012). The effect of contrast on pursuit initiation emerges from a prior for low target speeds that dominates when the sensory evidence is weak because of low contrast.
Constraints on population decoding for pursuit
Vector averaging defines a family of decoding computations based on a ratio: the numerator of the ratio computes the vector sum of MT responses weighted by their preferred speed and a unit vector in their preferred direction; the denominator provides normalization based on the magnitude of the sum of MT responses (Equation 1). In the present paper, our computational analysis showed that the observed sign of MT-pursuit correlations emerged when we used forms of vector averaging in which two separate populations of model MT neurons contribute to the numerator and denominator: each population had neuron-neuron correlations internally, but neurons were uncorrelated across the two populations. In contrast, other forms of vector averaging predicted patterns of MT-pursuit correlations that were inconsistent with our data, as did the maximum likelihood estimators developed by Deneve et al. (1999) and Jazayeri & Movshon (2006). Importantly, the structure of MT-pursuit correlations depended on the properties of the decoder while the magnitude of the correlations depended on the properties of the model MT population response.
We understand that vector averaging is a metaphor for the biological mechanisms of population decoding and that the neural decoding circuit will not look like the equations we have used. Thus, our paper leads mainly to three principles that must be contained in the biological decoding mechanism. First, decoding must implement a normalized population vector summation, as implied by vector averaging. Second, decoding should use opponent motion signals to create the population vector sum, so that neurons with preferred directions opposite to the direction of target motion show either zero or negative MT-pursuit correlations. Third, either the neurons that contribute to normalization have responses uncorrelated with neurons that contribute to the population vector sum, or the normalization mechanism itself must somehow erase those correlations.
It would be possible to derive a useful normalization signal even from neurons in the primary visual cortex that are not direction selective, as long as they estimate the magnitude of the population response in MT. As an alternative, Chaisanguanthum and Lisberger (2011) suggested that the normalization step represented by the denominator of our equations could reside in the cellular mechanisms of decoding neurons. They did not consider the potential impact of neuron-neuron correlations, but their formulation of the decoding implementation would account for our data if the cellular mechanism of normalization were immune to correlated sensory noise. If a neuron has a preferred direction close to target direction, contributes only to the numerator of a vector-averaging decoder, and lacks neuron-neuron correlations with neurons that contribute to the denominator, then it will contribute positively to the estimate of eye velocity for pursuit and its MT-pursuit correlations should be positive. This is the situation we created in the decoder that does the best job of predicting the MT-pursuit correlations in our data.
Visual inputs for perception versus action
It is tempting to draw parallels between the initiation of pursuit eye movements and motion perception. Their similar direction and speed discrimination thresholds suggest that they share the correlated noise source represented by the population response in MT (Osborne et al., 2005). MT-pursuit correlations are related to the finding that the activity of many individual MT neurons is weakly predictive of the perceptual decision a monkey will make (Britten et al., 1996) even when the stimulus lacks correlated motion. The limited noise reduction between MT neurons and pursuit eye movements may be related to the similarity between neurometric thresholds of MT neurons and psychometric thresholds of monkeys for direction discriminations near threshold (Newsome et al., 1989), and to the temporally-causal correlation between MT firing and perceptual decisions (Smith et al., 2011). Both pursuit and perception operate as if only a handful of MT neurons are contributing signals for the behavior, even though it seems likely that tens of thousands of correlated neurons are involved (Shadlen et al., 1996).
At the same time, pursuit and perception behave differently in a number of ways. Pursuit attempts to estimate target motion and program a pursuit eye movement that matches any arbitrary estimate of motion (Lisberger and Westbrook, 1985; Osborne et al., 2005), while perception is normally trying to discriminate among two or a few possibilities. Further, pursuit must estimate target parameters quickly, on the basis of only a few spikes in each MT neuron (Osborne et al., 2004). We think that pursuit’s estimates of sensory parameters are the result of a machine-like neural circuit that draws from all MT neurons. Perception may be able to use optimal decoding schemes (Jazayeri & Movshon, 2006), or take the time needed to select the neurons that provide the most important signals. For example, the most responsive neurons appear to contribute most strongly for coarse discriminations, while fine discriminations seem to depend on neurons that are stimulated on the flanks of their tuning curves (Britten et al., 1996; Cohen & Newsome, 2009; Jazayeri & Movshon, 2006; Purushothaman & Bradley, 2005). These differences would not prevent pursuit and perception from having similar noise levels (Osborne et al., 2005).
Population decoding is the main conceptual operation that lies between the sensory representation of visual motion and the initiation of pursuit. The ease of quantifying pursuit and the accessibility of the pursuit circuit offer a unique opportunity to understand how sensory decoding is implemented in the brain. We have shown here that MT-pursuit correlations are a powerful probe for understanding the operation of the decoding circuits. The existence and structure of MT-pursuit correlations establish principles that guide our search for the brain’s implementations of sensory population decoding.
Methods
Subjects
We obtained eye movement traces and neural recordings from two adult male rhesus monkeys (Macaca mulatta, 7 and 13 kg). After behavioral training, monkeys were implanted with titanium head holders for head fixation and scleral search coils for recording eye movements using methods that have been described previously (Ramachandran & Lisberger, 2005). Titanium or cilux recording chambers (Crist instruments, Hagerstown, MD) were mounted over a 20 mm circular opening in the skull to allow access to MT for neural recordings. For each experimental session, monkeys sat in a primate chair and received fluid rewards for accurately fixating or tracking visual targets presented on a screen in front of them. All experiments were conducted at UCSF. All surgical and experimental procedures had been approved in advance by the Institutional Animal Care and Use Committee of the University of California, San Francisco and were in compliance with the NIH Guide for the Care and Use of Laboratory Animals.
Visual stimuli
All experiments were conducted in a nearly dark room. Visual stimuli were presented on an analog oscilloscope (Hewlett Packard 1304A) with a refresh rate of 250 Hz. We drove the oscilloscope from 16-bit digital-to-analog converters on a digital signal processing board in a PC. The screen was 20.5 cm from the monkey and subtended visual angles of 67° horizontally and 54° vertically.
We began each recording by mapping the receptive field of the MT neuron under study and assessing its speed and direction tuning. To study pursuit, we required the monkey to track patches of 100% correlated random dots that moved with carefully contrived speeds and directions. Each trial presented a single pursuit stimulus. To initiate a trial, monkeys fixated a 0.3° square target in the center of the screen for a randomized interval of 500 to 900 ms. Then, a 5×5° or 8×8° patch of stationary random dots appeared in the receptive field of the neuron for another randomized interval of 300 to 800 ms. Next, the fixation point disappeared and the dots began to move behind the stationary, virtual aperture for 100 ms, creating motion without taking the stimulus off the receptive field. Finally, the aperture began to move along with the dots for 250 to 700 ms depending on the speed of stimulus motion.
We adjusted the exact parameters of target motion to match the receptive field location and direction and speed preferences of the neuron under study. Different trials provided stimulus motion that corresponded to the peaks or the flanks of the direction- and speed-tuning curves. One of our main goals was to obtain saccade-free initiation of pursuit. Therefore, we aimed our electrodes at the representation of the central visual field and recorded mainly from neurons with receptive field centers within 5 degrees of the fovea. Because our data analysis was limited to the first 200 ms after the onset of target motion, we were not concerned about the exact position of the eye relative to the moving patch of dots during steady-state pursuit.
In a typical experiment, trials that presented 4 to 6 different directions or speeds of stimulus motion were interleaved randomly in a block of trials. To prevent anticipatory pursuit responses, each stimulus motion was balanced by a companion trial that delivered stimulus motion at the same speed in the opposite direction. Monkeys received fluid rewards for keeping their eyes within 3–5° of target position throughout the pursuit portion of the trial. The exact fixation requirement depended on the speed and the size of the pursuit target as well as the starting location of the patch relative to the fixation target. Monkeys usually completed 2000–3600 pursuit trials in each daily experiment.
Data acquisition
We used a Mini-Matrix 05 microdrive (Thomas Recording, Giessen, Germany) to lower up to 5 quartz-shielded tungsten electrodes into the brain. Extrastriate area MT was identified based on stereotaxic coordinates, directional and speed response properties of neurons, receptive field sizes, retinotopic organization, and surrounding cortical areas (Desimone & Ungerleider, 1986; Maunsell & Van Essen, 1983).
Neural signals were amplified and digitized for on-line spike sorting and spikes were initially assigned to single neurons by a template-matching algorithm (Plexon MAP, Plexon Inc., Dallas, TX). After the experiment, we used a combination of visual inspection of waveforms, projection onto principal components, template-matching, and refractory period violations in Offline Sorter (Plexon Inc, Dallas, TX) to assign spikes to well-isolated single units. Waveforms were time-stamped with 1 ms precision and firing rates were obtained by convolving spike trains with a Gaussian window with a standard deviation of 10 ms. Eye velocity signals were created with an analog differentiator circuit, and eye position and velocity signals were sampled and stored at 1000 Hz. Velocity traces were smoothed with a zero-phase, 25 Hz, 2-pole digital Butterworth filter.
Data analysis
To allow study of the speed and direction tuning of each cell, the monkey fixated a stationary spot and stimuli moved across the receptive field in 300 ms intervals. We averaged the firing rate across multiple presentations of the same motion, fitted the averages as functions of speed or direction using the approach of Lisberger and Movshon (1999):
| (12) |
| (13) |
Here, the parameters are: s, stimulus speed; θ, stimulus direction; R0, baseline firing rate; a, amplitude of the speed tuning curve; A, amplitude of the direction tuning curve; ps, preferred speed; pθ, preferred direction; σs, width of the speed tuning curve; σθ, width of the direction tuning curve; and d, skew of the speed tuning curve. The angle θ-pθ was restricted to be within [−180, 180] degrees.
To evaluate the trial-by-trial correlations between the firing of MT neurons and the initiation of pursuit, we recorded data sets with at least 80 and typically 300 repetitions of each target motion. Experiments contained a small number of interleaved target motions, and we computed the MT-pursuit correlations for each target motion separately. We inspected the data for every pursuit trial and rejected it for further analysis if a saccade occurred within the time window chosen for analysis. We also rejected trials that contained saccades or microsaccades during fixation.
Filters to remove temporal autocorrelations in eye velocity
To prevent small fluctuations in eye velocity during fixation from contributing to neuron-behavior correlations, we developed a filtering procedure to remove temporal autocorrelations in eye speed. Our strategy was to create a linear filter based on the eye speed during fixation, in the interval from 40 ms before to 40 ms after the onset of stimulus motion. We then used the filter to predict the contribution of eye speed during fixation to eye speed during the initial pursuit response, in the interval from 80 to 120 ms after motion onset. We subtracted the predictions based on the filter from the eye velocity during the initiation of pursuit to obtain a “decorrelated” eye speed that was used to calculate MT-pursuit correlations.
The linear filter we constructed is the analytical solution to a multilinear regression between fixation and eye speed, and is optimal in the least squared sense (Warland et al., 1997). One assumption of this method is that the independent variables, in our case eye velocity at different times during fixation, are uncorrelated with each other. To minimize the correlation between sequential time points in eye velocity, we down-sampled our data by calculating the mean over 20 ms time bins. To confirm that this was sufficient, we calculated filters based on ridge regression and the predictions were virtually identical.
We defined Vfix as the matrix describing residual eye velocity (actual eye velocity for each trial minus the mean across all trials with the same target motion) during fixation with trials in rows and time points in columns, and Vpurs as a matrix describing residual eye velocity during the interval from 80 to 120 ms after stimulus motion onset. We then computed the filter f:
| (14) |
We obtained the decorrelated eye velocity Vpursdecorr by subtracting the predicted eye velocity Vpurspred from the raw eye velocity Vpurs:
| (15) |
| (16) |
Finally, to calculate MT-pursuit correlations, we converted the horizontal and vertical components of Vpursdecorr into decorrelated eye speed.
Simulations of MT population responses
We simulated a population of correlated, noisy MT neurons with 60 preferred speeds that uniformly tiled the log space between 0.5 and 512 deg/sec and 60 preferred directions evenly distributed between −180 and 180 degrees. Each model unit took on a scalar mean response Rmean determined by the sum of the baseline activity R0 and the product of the direction and speed tuning curves:
| (17) |
Here, s and θ are stimulus speed and direction, and ps and pθ are preferred speed and direction. We set amplitude g=4, R0=1, bandwidth of the speed tuning σs =1.5, and bandwidth of the direction tuning σθ =40. The angle θ-pθ ranged from −180 to +180. The magnitude of the MT-pursuit correlations depended strongly on the value of g, and we selected the value 4 to reflect our expectation of a mean response of 4 spikes in the 40 ms intervals used to analyze our data for MT neurons with preferred speed and direction near the parameters of target motion.
We followed the methods of Shadlen et al. (1996) to add to each neuron’s mean response correlated noise drawn from a normal distribution with the variance scaled to the mean response. The expected correlation structure rij between neurons i and j was:
| (18) |
We set the peak correlation rmax=0.18, and the widths of the correlation structure for speed and direction τs=1.35 and τθ=45. These values are slightly different from those suggested by our prior report of neuron-neuron correlations in MT (Huang and Lisberger, 2009). The values were chosen so that the amplitude of the best model’s MT-pursuit correlations matched those in the data and the neuron-neuron correlations in the model MT populations provided good matches to the data from Huang and Lisberger (2009) for analysis intervals of durations 150 and 300 ms. Given that noise correlations are similar in those two windows, and MT responses are highly correlated across time (Osborne et al., 2004), we see no reason to think that the noise correlations would be very different in the analysis window of 40 ms used here. We also do not think our conclusions are affected by our assumption that higher-order correlations in the MT population are small and would play little role in the structure of MT-pursuit correlations. We do realize that the exact parameter values for the neuron-neuron correlations are under-constrained by available data, and we take this uncertainty into account in interpreting our results.
Highlights.
The responses of single MT neurons predict trial-to-trial variation in eye movement
The correlations imply that variation in pursuit initiation arises in sensory noise
Noise reduction between MT and pursuit initiation is relatively small
Sensory decoding normalizes with an uncorrelated estimate of MT population response
Acknowledgments
We thank Mehrdad Jazayeri for insightful comments on an earlier version of the manuscript and Mark Churchland for clarity on issues of population decoding. We are grateful to Lisberger lab members, as well as Jonathan Pillow, Peter Latham, Surya Ganguli, and Valerio Mante for valuable discussions. We also thank Drs. Allison Doupe, Philip Sabes, Christoph Schreiner, and Yang Dan for helpful comments on the PhD thesis that turned into this paper. We thank Stefanie Tokiyama, Elizabeth Montgomery, Karen MacLeod, Dirk Kleinhesselink, Scott Ruffner, David Wolfgang-Kimball, Darrell Floyd, and Ken McGary for technical assistance. Research supported by the Howard Hughes Medical Institute, the Swartz Foundation, NIH grant EY03878, and T32 EY007120.
Footnotes
Contributions of authors: SSH and SGL designed experiments and wrote the paper. SSH performed experiments and data analysis. KSC contributed ideas about population decoding. SSH, KSC, and SGL performed modeling.
The authors declare no competing financial interests.
Publisher's Disclaimer: This is a PDF file of an unedited manuscript that has been accepted for publication. As a service to our customers we are providing this early version of the manuscript. The manuscript will undergo copyediting, typesetting, and review of the resulting proof before it is published in its final citable form. Please note that during the production process errors may be discovered which could affect the content, and all legal disclaimers that apply to the journal pertain.
References
- Bair W, Zohary E, Newsome WT. Correlated firing in macaque visual area MT: time scales and relationship to behavior. J Neurosci. 2001;21(5):1676–1697. doi: 10.1523/JNEUROSCI.21-05-01676.2001. [DOI] [PMC free article] [PubMed] [Google Scholar]
- Born RT, Groh JM, Zhao R, Lukasewycz SJ. Segregation of object and background motion in visual area MT: effects of microstimulation on eye movements. Neuron. 2000;26:725–734. doi: 10.1016/s0896-6273(00)81208-8. [DOI] [PubMed] [Google Scholar]
- Britten KH, Newsome WT, Shadlen MN, Celebrini S, Movshon JA. A relationship between behavioral choice and the visual responses of neurons in macaque MT. Vis Neurosci. 1996;13(1):87–100. doi: 10.1017/s095252380000715x. [DOI] [PubMed] [Google Scholar]
- Britten KH, Shadlen MN, Newsome WT, Movshon JA. The analysis of visual motion: a comparison of neuronal and psychophysical performance. J Neurosci. 1992;12(12):4745–4765. doi: 10.1523/JNEUROSCI.12-12-04745.1992. [DOI] [PMC free article] [PubMed] [Google Scholar]
- Carey MR, Medina JM, Lisberger SG. Instructive signals for motor learning from cortical area MT. Nat Neurosci. 2005;8:813–819. doi: 10.1038/nn1470. [DOI] [PMC free article] [PubMed] [Google Scholar]
- Chaisanguanthum K, Lisberger SG. A neurally-efficient implementation of sensory population decoding. J Neurosci. 2011;31:4868–4877. doi: 10.1523/JNEUROSCI.6776-10.2011. [DOI] [PMC free article] [PubMed] [Google Scholar]
- Churchland MM, Afshar A, Shenoy KV. A central source of movement variability. Neuron. 2006;52(6):1085–1096. doi: 10.1016/j.neuron.2006.10.034. [DOI] [PMC free article] [PubMed] [Google Scholar]
- Churchland MM, Lisberger SG. Shifts in the population response in the middle temporal visual area parallel perceptual and motor illusions produced by apparent motion. J Neurosci. 2001;21(23):9387–9402. doi: 10.1523/JNEUROSCI.21-23-09387.2001. [DOI] [PMC free article] [PubMed] [Google Scholar]
- Churchland MM, Yu BM, Cunningham JP, Sugrue LP, Cohen MR, Corrado GS, et al. Stimulus onset quenches neural variability: a widespread cortical phenomenon. Nat Neurosci. 2010;13(3):369–378. doi: 10.1038/nn.2501. [DOI] [PMC free article] [PubMed] [Google Scholar]
- Cohen MR, Newsome WT. Estimates of the contribution of single neurons to perception depend on timescale and noise correlation. J Neurosci. 2009;29(20):6635–6648. doi: 10.1523/JNEUROSCI.5179-08.2009. [DOI] [PMC free article] [PubMed] [Google Scholar]
- Cook EP, Maunsell JH. Attentional modulation of motion integration of individual neurons in the middle temporal visual area. J Neurosci. 2004;24(36):7964–7977. doi: 10.1523/JNEUROSCI.5102-03.2004. [DOI] [PMC free article] [PubMed] [Google Scholar]
- Deneve S, Latham PE, Pouget A. Reading population codes: a neural implementation of ideal observers. Nat Neurosci. 1999;2(8):740–745. doi: 10.1038/11205. [DOI] [PubMed] [Google Scholar]
- Desimone R, Ungerleider LG. Multiple visual areas in the caudal superior temporal sulcus of the macaque. J Comp Neurol. 1986;248(2):164–189. doi: 10.1002/cne.902480203. [DOI] [PMC free article] [PubMed] [Google Scholar]
- Faisal AA, Selen LP, Wolpert DM. Noise in the nervous system. Nat Rev Neurosci. 2008;9(4):292–303. doi: 10.1038/nrn2258. [DOI] [PMC free article] [PubMed] [Google Scholar]
- Fallah M, Reynolds JH. Contrast dependence of smooth pursuit eye movements following a saccade to superimposed targets. PLoS One. 2012;7:e37888. doi: 10.1371/journal.pone.0037888. [DOI] [PMC free article] [PubMed] [Google Scholar]
- Goldreich D, Krauzlis RJ, Lisberger SG. Effect of changing feedback delay on spontaneous oscillations in smooth pursuit eye movements of monkeys. J Neurophysiol. 1992;67:625–638. doi: 10.1152/jn.1992.67.3.625. [DOI] [PubMed] [Google Scholar]
- Groh JM. Converting neural signals from place codes to rate codes. Biol Cybern. 2001;85(3):159–165. doi: 10.1007/s004220100249. [DOI] [PubMed] [Google Scholar]
- Groh JM, Born RT, Newsome WT. How is a sensory map read Out? Effects of microstimulation in visual area MT on saccades and smooth pursuit eye movements. J Neurosci. 1997;17(11):4312–4330. doi: 10.1523/JNEUROSCI.17-11-04312.1997. [DOI] [PMC free article] [PubMed] [Google Scholar]
- Harris CM, Wolpert DM. Signal-dependent noise determines motor planning. Nature. 1998;394(6695):780–784. doi: 10.1038/29528. [DOI] [PubMed] [Google Scholar]
- Heeger DJ. Modeling simple-cell direction selectivity with normalized, half-squared, linear operators. J Neurophysiol. 1993;70:1885–1898. doi: 10.1152/jn.1993.70.5.1885. [DOI] [PubMed] [Google Scholar]
- Hohl SS, Lisberger SG. Representation of perceptually invisible image motionin extrastriate visual area MT of macaque monkeys. J Neurosci. 2011;31:16561–16569. doi: 10.1523/JNEUROSCI.3166-11.2011. [DOI] [PMC free article] [PubMed] [Google Scholar]
- Hu X, Jiang H, Gu C, Li C, Sparks DL. Reliability of oculomotor command signals carried by individual neurons. Proc Natl Acad Sci. 2007;104:8137–8142. doi: 10.1073/pnas.0702799104. [DOI] [PMC free article] [PubMed] [Google Scholar]
- Huang X, Lisberger SG. Noise correlations in cortical area MT and their potential impact on trial-by-trial variation in the direction and speed of smooth-pursuit eye movements. J Neurophysiol. 2009;101:3012–3030. doi: 10.1152/jn.00010.2009. [DOI] [PMC free article] [PubMed] [Google Scholar]
- Jazayeri M, Movshon JA. Optimal representation of sensory information by neural populations. Nat Neurosci. 2006;9:690–696. doi: 10.1038/nn1691. [DOI] [PubMed] [Google Scholar]
- Krauzlis RJ, Lisberger SG. Directional organization of eye movement and visual signals in the floccular lobe of the monkey cerebellum. Exp Brain Res. 1996;109:289–302. doi: 10.1007/BF00231788. [DOI] [PubMed] [Google Scholar]
- Krekelberg B, van Wezel RJ, Albright TD. Interactions between speed and contrast tuning in the middle temporal area: implications for the neural code for speed. J Neurosci. 2006;26:8988–8998. doi: 10.1523/JNEUROSCI.1983-06.2006. [DOI] [PMC free article] [PubMed] [Google Scholar]
- Lee C, Rohrer WH, Sparks DL. Population coding of saccadic eye movements by neurons in the superior colliculus. Nature. 1988;332:357–360. doi: 10.1038/332357a0. [DOI] [PubMed] [Google Scholar]
- Lisberger SG, Ferrera VP. Vector averaging for smooth pursuit eye movements initiated by two moving targets in monkeys. J Neurosci. 1997;17(19):7490–7502. doi: 10.1523/JNEUROSCI.17-19-07490.1997. [DOI] [PMC free article] [PubMed] [Google Scholar]
- Lisberger SG, Movshon JA. Visual motion analysis for pursuit eye movements in area MT of macaque monkeys. J Neurosci. 1999;19(6):2224–2246. doi: 10.1523/JNEUROSCI.19-06-02224.1999. [DOI] [PMC free article] [PubMed] [Google Scholar]
- Maunsell JH, Van Essen DC. Functional properties of neurons in middle temporal visual area of the macaque monkey. I Selectivity for stimulus direction, speed, and orientation. J Neurophysiol. 1983;49(5):1127–1147. doi: 10.1152/jn.1983.49.5.1127. [DOI] [PubMed] [Google Scholar]
- Medina JF, Lisberger SG. Variation, signal, and noise in cerebellar sensory-motor processing for smooth-pursuit eye movements. J Neurosci. 2007;27(25):6832–6842. doi: 10.1523/JNEUROSCI.1323-07.2007. [DOI] [PMC free article] [PubMed] [Google Scholar]
- Newsome WT, Britten KH, Movshon JA. Neuronal correlates of a perceptual decision. Nature. 1989;341(6237):52–54. doi: 10.1038/341052a0. [DOI] [PubMed] [Google Scholar]
- Newsome WT, Wurtz RH, Dursteler MR, Wurtz RH. Deficits in visual motion processing following ibotenic acid lesions of the middle temporal visual area of the macaque monkey. J Neurosci. 1985;5:825–840. doi: 10.1523/JNEUROSCI.05-03-00825.1985. [DOI] [PMC free article] [PubMed] [Google Scholar]
- Newsome WT, Pare EB. A selective impairment of motion perception following lesions of the middle temporal visual area (MT) J Neurosci. 1988;8:2201–2211. doi: 10.1523/JNEUROSCI.08-06-02201.1988. [DOI] [PMC free article] [PubMed] [Google Scholar]
- Niu Y, Lisberger SG. Sensory versus motor loci for integration of multiple motion signals in smooth pursuit eye movements and human motion perception. J Neurophysiol. 2011;106:741–753. doi: 10.1152/jn.01025.2010. [DOI] [PMC free article] [PubMed] [Google Scholar]
- Osborne LC, Bialek WB, Lisberger SG. Time course of information about motion direction in visual area MT of macaque monkeys. J Neurosci. 2004;24:3210–3222. doi: 10.1523/JNEUROSCI.5305-03.2004. [DOI] [PMC free article] [PubMed] [Google Scholar]
- Osborne LC, Hohl SS, Bialek W, Lisberger SG. Time course of precision in smooth-pursuit eye movements of monkeys. J Neurosci. 2007;27(11):2987–2998. doi: 10.1523/JNEUROSCI.5072-06.2007. [DOI] [PMC free article] [PubMed] [Google Scholar]
- Osborne LC, Lisberger SG, Bialek W. A sensory source for motor variation. Nature. 2005;437(7057):412–416. doi: 10.1038/nature03961. [DOI] [PMC free article] [PubMed] [Google Scholar]
- Priebe NJ, Lisberger SG. Estimating target speed from the population response in visual area MT. J Neurosci. 2004;24(8):1907–1916. doi: 10.1523/JNEUROSCI.4233-03.2004. [DOI] [PMC free article] [PubMed] [Google Scholar]
- Purushothaman G, Bradley DC. Neural population code for fine perceptual decisions in area MT. Nat Neurosci. 2005;8(1):99–106. doi: 10.1038/nn1373. [DOI] [PubMed] [Google Scholar]
- Ramachandran R, Lisberger SG. Normal performance and expression of learning in the vestibulo-ocular reflex (VOR) at high frequencies. J Neurophysiol. 2005;93(4):2028–2038. doi: 10.1152/jn.00832.2004. [DOI] [PMC free article] [PubMed] [Google Scholar]
- Rashbass C. The relationship between saccadic and smooth tracking eye movements. J Physiol. 1961;159:326–338. doi: 10.1113/jphysiol.1961.sp006811. [DOI] [PMC free article] [PubMed] [Google Scholar]
- Salinas E, Abbott LF. Vector reconstruction from firing rates. J Comput Neurosci. 1994;1(1–2):89–107. doi: 10.1007/BF00962720. [DOI] [PubMed] [Google Scholar]
- Schoppik D, Nagel KI, Lisberger SG. Cortical mechanisms of smooth eye movements revealed by dynamic covariations of neural and behavioral responses. Neuron. 2008;58(2):248–260. doi: 10.1016/j.neuron.2008.02.015. [DOI] [PMC free article] [PubMed] [Google Scholar]
- Shadlen MN, Britten KH, Newsome WT, Movshon JA. A computational analysis of the relationship between neuronal and behavioral responses to visual motion. J Neurosci. 1996;16(4):1486–1510. doi: 10.1523/JNEUROSCI.16-04-01486.1996. [DOI] [PMC free article] [PubMed] [Google Scholar]
- Smith JET, Zhan CA, Cook EP. The functional link between area MT neural fluctuations and detection of a brief motion stimulus. J Neurosci. 2011;31:13458–13468. doi: 10.1523/JNEUROSCI.1347-11.2011. [DOI] [PMC free article] [PubMed] [Google Scholar]
- Treue S, Maunsell JH. Attentional modulation of visual motion processing in cortical areas MT and MST. Nature. 1996;382:539–541. doi: 10.1038/382539a0. [DOI] [PubMed] [Google Scholar]
- van Beers RJ. The sources of variability in saccadic eye movements. J Neurosci. 2007;27:8757–8770. doi: 10.1523/JNEUROSCI.2311-07.2007. [DOI] [PMC free article] [PubMed] [Google Scholar]
- van Beers RJ, Haggard P, Wolpert DM. The role of execution noise in movement variability. J Neurophysiol. 2004;91(2):1050–1063. doi: 10.1152/jn.00652.2003. [DOI] [PubMed] [Google Scholar]
- Warland DK, Reinagel P, Meister M. Decoding visual information from a population of retinal ganglion cells. J Neurophysiol. 1997;78(5):2336–2350. doi: 10.1152/jn.1997.78.5.2336. [DOI] [PubMed] [Google Scholar]
- Weiss Y, Simoncelli EP, Adelson EH. Motion illusions as optimal percepts. Nat Neurosci. 2002;5:598–604. doi: 10.1038/nn0602-858. [DOI] [PubMed] [Google Scholar]
- Yang J, Lee J, Lisberger SG. The interaction of Bayesian priors and sensory data and its neural circuit implementation in visually-guided movement. J Neurosci. 2012;32:17632–45. doi: 10.1523/JNEUROSCI.1163-12.2012. [DOI] [PMC free article] [PubMed] [Google Scholar]
- Yang J, Lisberger SG. Relationship between adapted neural population responses in MT and motion adaptation in speed and direction of smooth-pursuit eye movements. J Neurophysiol. 2009;101(5):2693–2707. doi: 10.1152/jn.00061.2009. [DOI] [PMC free article] [PubMed] [Google Scholar]