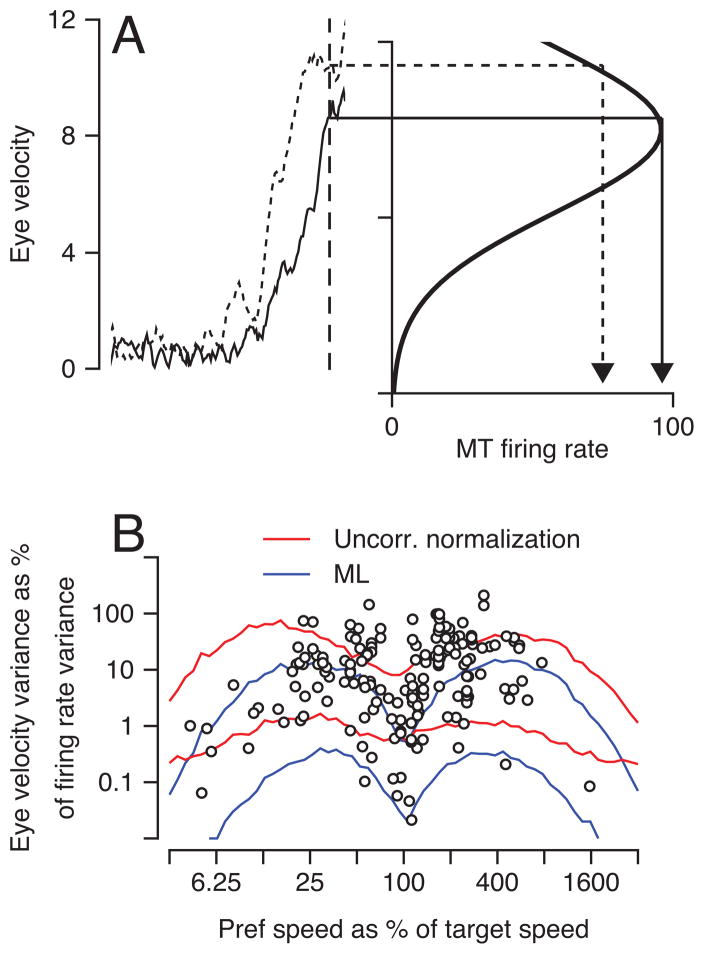
Figure 6.
Noise reduction between the firing of single neurons in MT and pursuit eye speed. A: Schematic showing how the speed tuning curve of an MT neuron is used to convert eye speed 200 ms after the onset of target motion into units of spikes/s. The speed-tuning curve was based on firing rates 25–140 ms after motion onset. B: Noise reduction is plotted as a function of the preferred speed of the real or model neuron, shown as a percentage of target speed. Open symbols show data for different MT neurons when the difference between preferred and target direction was less than 90 degrees. The red and blue curves show the range of predictions from the numerator-opponent vector-averaging model with different, uncorrelated populations used in the numerator and denominator versus the maximum likelihood computation of Deneve et al. (1999). Note that each decoding model produced a range of values of noise reduction at each value of preferred speed, because of the different response amplitudes and variances of neurons with different preferred directions.

