Abstract
The glomerular filtration rate in the kidney is controlled, in part, by the tubuloglomerular feedback (TGF) system, which is a negative feedback loop that mediates oscillations in tubular fluid flow and in fluid NaCl concentration of the loop of Henle. In this study, we developed a mathematical model of the TGF system that represents NaCl transport along a short loop of Henle with compliant walls. The proximal tubule and the outer-stripe segment of the descending limb are assumed to be highly water permeable; the thick ascending limb (TAL) is assumed to be water impermeable and have active NaCl transport. A bifurcation analysis of the TGF model equations was performed by computing parameter boundaries, as functions of TGF gain and delay, that separate differing model behaviors. The analysis revealed a complex parameter region that allows a variety of qualitatively different model equations: a regime having one stable, time-independent steady-state solution and regimes having stable oscillatory solutions of different frequencies. A comparison with a previous model, which represents only the TAL explicitly and other segments using phenomenological relations, indicates that explicit representation of the proximal tubule and descending limb of the loop of Henle lowers the stability of the TGF system. Model simulations also suggest that the onset of limit-cycle oscillations (LCO) results in increases in the time-averaged distal NaCl delivery, whereas distal fluid delivery is not much affected.
Keywords: kidney, renal hemodynamics control, autoregulation, negative feedback loop, nonlinear dynamics
1 Introduction
The kidney plays a vital role by maintaining whole-organism chemical and physical stability. In particular, the kidney maintains the electrolyte concentrations, osmolality, and acid-base balance of blood plasma within the narrow limits that are compatible with effective cellular function; and the kidney participates in blood pressure regulation and in the maintenance of steady whole-organism water volume [5].
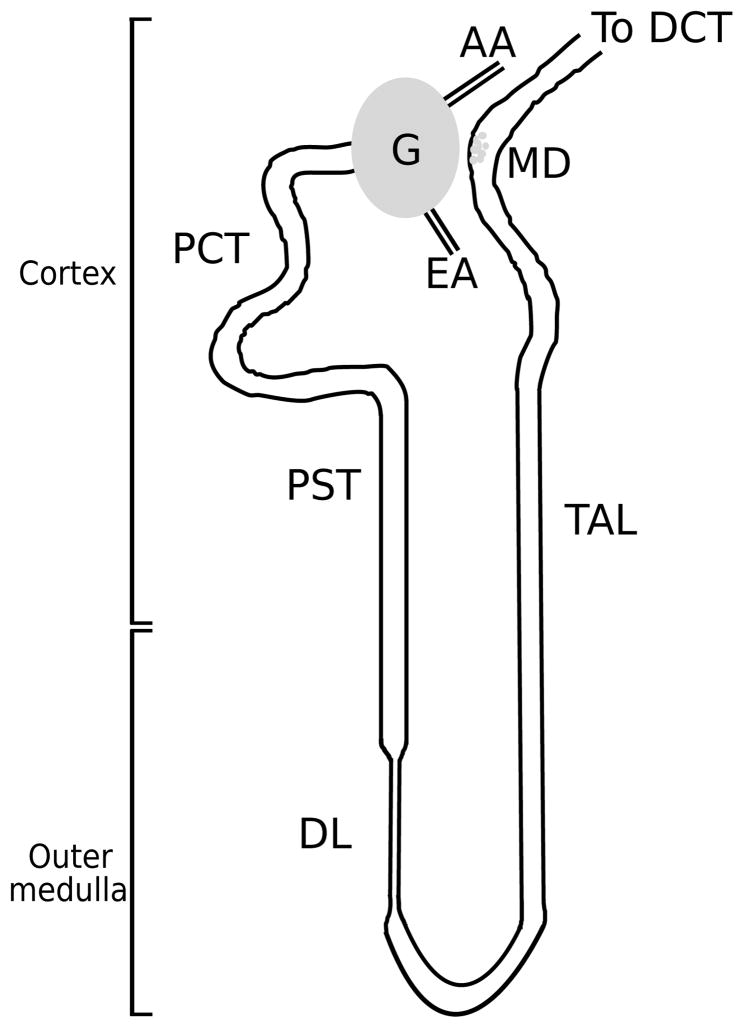
The functional unit of the kidney is the nephron; a schematic diagram of a short-looped nephron is shown in Fig. 1. Each rat kidney is populated by about 38,000 nephrons [11]; each human kidney consists of about a million nephrons. Each nephron consists of an initial filtering component called the renal corpuscle and a renal tubule specialized for reabsorption and secretion. The renal corpuscle is the site of formation of the glomerular filtrate, and is composed of a glomerulus and Bowman’s capsule. A glomerulus, labeled ‘G’ in Fig. 1, is a ball-shaped structure composed of capillary blood vessels actively involved in the filtration of the blood and is surrounded by Bowman’s capsule. A glomerulus receives its blood supply from an afferent arteriole (AA) and normally only about 20 percent of the water and solutes in the blood are driven by pressure gradient into the space formed by Bowman’s capsule. The remainder of the blood leaves each glomerulus through the efferent arteriole.
Fig. 1.
A schematic diagram of a short-looped nephron and its renal corpuscle, afferent arteriole (AA), and efferent arteriole (EA). Each nephron consists of a spherical filtering component, the glomerulus (G), and a tubule extending from the renal corpuscle into the proximal convoluted tubule (PCT), proximal straight tubule (PST), and descending limb (DL). Following the loop bend, the thick ascending limb (TAL) rises back into the cortex, then turns into the distal convoluted tubule (DCT). The macula densa (MD) cells at the end of the TAL walls are adjacent to the AA and specialize in sensing the chloride concentration in the downstream fluid. DCT fluid enters the collecting duct system (not shown), where the formation of urine occurs.
Normal renal functions require that fluid flow through the nephron be kept within a narrow range. When tubular flow rate falls outside of that range, the ability of the nephron to maintain salt and water balance may be compromised. Tubular flow rate depends, in large part, on glomerular filtration rate (GFR), which is regulated by several mechanisms. One of these mechanisms is the tubuloglomerular feedback (TGF), in which changes in GFR can be detected and rapidly corrected for on a minute-to-minute basis as well as over sustained periods. Thick ascending limb (TAL) cells vigorously pump out NaCl from luminal fluid into the surrounding interstitium by means of active transepithelial transport. Because the TAL walls are nearly water-impermeable, the active reabsorption of NaCl is not accompanied by water loss, thereby diluting the tubular fluid. Thus, the TAL is an important segment of the TGF system, and its transport properties allow it to act as a key operator of the TGF system.
The TGF mechanism is a negative feedback loop in which the chloride ion concentration is sensed downstream in the nephron by a specialized cluster of cells, the macula densa (MD), that are in the tubular wall near the end of TAL and also near the glomerulus. Then, based on the difference between the sensed concentration at the MD and a target concentration, the muscle tension in the AA is modified. Specifically, if the chloride concentration is below a target value, MD cells induce vasodilation, which reduces the AA resistance. Consequently, this increases glomerular filtration pressure and tubular fluid flow. In particular, this leads to higher fluid flow rate in the TAL, which allows less time for dilution of the tubular fluid so that MD chloride concentration increases. Conversely, if the chloride concentration exceeds the target value, the TGF system decreases glomerular flow by constricting the smooth muscle cells in the AA, resulting in a reduced concentration at the MD. By these mechanisms, TGF stabilizes the fluid and solute delivery into the distal portion of the loop of Henle and maintains the rate of filtration near its ideal value.
In a previous TGF model [33], only the TAL was explicitly represented; the proximal tubule and the descending limb were represented by means of phenomenological relations. In this present study, we extend that model to include an explicit representation of the entire short loop of Henle and we use the resulting model to better understand factors that impact the stability of the TGF system. Specifically, we investigate how tubular fluid and chloride delivery are affected or mediated by the TGF system. Results of this model indicate that TGF-mediated oscillations arise from a Hopf bifurcation: if feedback-loop gain is sufficiently large, then the stable state of the system is a regular oscillation and not a time-independent steady state, i.e., a limit-cycle oscillation (LCO) [17,26,33]. One factor that impacts the stability of the TGF system is the explicit representation of the proximal tubule and descending limb of the loop of Henle, which renders the system more prone to oscillate. Model results also suggest that LCO limits the regulatory ability of the TGF system and may enhance time-averaged distal sodium delivery.
2 Mathematical Model
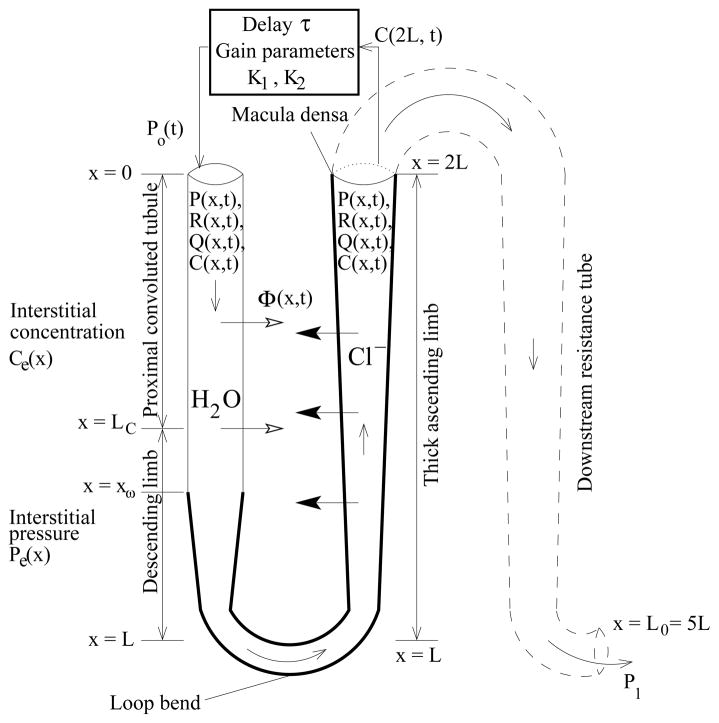
We describe a mathematical model of a TGF system that represents the proximal tubule, the descending limb, and the TAL of a short loop of Henle. The model, which is formulated as a boundary value problem, predicts tubular fluid rate, fluid pressure, and tubular radius as functions of time and space. At the entrance of the proximal tubule, pressure is given by the TGF response. At the end of the TAL, pressure is assumed to be known a priori. However, since tubular fluid pressure at the MD is not well-known, we model a longer tubule to avoid this uncertainty: the model represents a short loop of Henle that extends in space from x = 0 at the entrance to the proximal tubule to x = L0 at the end of collecting duct, where fluid pressure in rat can be inferred to be 1–3 mmHg, based on measurements in the interstitium, vessels, and the pelvic space [1,7,8]. The tubular walls are assumed to be compliant, with a radius that depends on transmural pressure difference. We represent chloride ion (Cl−), the concentration of which alongside the MD is believed to be the principal tubular fluid signaling agent for TGF activation. Cl− concentration is represented only along the loop, from x = 0 at the entrance to the proximal tubule, to x = 2L at the MD (L0 = 5L). A schematic diagram for the model TGF system is given in Fig. 2.
Fig. 2.
Schematic representation of model TGF system. Hydrodynamic pressure Po(t) = P(0, t) drives flow into loop entrance (x = 0) at time t. Oscillations in inflow pressure result in oscillations in loop pressure P(x, t), flow rate Q(x, t), water flux Φ(x, t), radius R(x, t), and tubular fluid chloride concentration C(x, t).
The model equations are
| (1) |
| (2) |
| (3) |
| (4) |
| (5) |
Equations 1 and 2 describe intratubular fluid pressure and fluid flow rate, where x is axial position along the nephron (0 ≤ x ≤ L0), t is time, P (x, t) is the tubular fluid pressure, Q(x, t) is the tubular flow rate, R(P(x, t)) is the tubular radius, which is a function of the fluid pressure (see below), and Φ(x, t) is the transmural water flux per unit length, taken to be positive out of the tubule (see below). Equation 1 represents Poiseuille flow, which is driven by the axial pressure gradient. Equation 2 represents fluid incompressibility and conservation. Inflow pressure Po(t) = P (0, t) is given by the TGF response, and outflow pressure P1 = P (L0, t) at the end of the model nephron is considered fixed.
Equation 3 represents solute concentration in the tubular fluid by mass conservation, where 0 ≤ x ≤ 2L corresponds to the loop segment only up to the MD, C(x, t) is the tubular fluid chloride concentration, Ce(x) is the time-independent extratubular (interstitial) chloride concentration which is assumed to be fixed, and Rss(x) is the steady-state tubular radius. The first component on the right-hand side represents axial advective chloride transport at the intratubular volumetric flow rate Q(x, t). The two terms inside the large pair of parentheses corresponds to outward-directed active solute transport characterized by Michaelis-Menten-like kinetics (with maximum Cl− transport rate Vmax and Michaelis constant KM ) and transepithelial Cl− diffusion (with backleak permeability κ). We assume that chloride channels are insensitive to the stretch of the tubular walls, and that such stretch does not render accessible parts of the membrane that might be previously folded. Thus, solute transport is not affected by changes in tubular radius, which implied that the solute flux term in Eq. (3) is proportional to Rss(x) instead of R(x, t) [25]. The boundary condition C(0, t) = Co is considered to be fixed so that fluid entering the proximal tubule has a constant chloride concentration.
Equation 4 represents a compliant tube, such that the tubular luminal radius is a function of transmural pressure difference. Pe is the extratubular (interstitial) pressure, α specifies the degree of tubular compliance, and β(x) is the unpressurized tubular radius (see below).
Equation 5 defines the feedback-mediated inflow pressure to the entrance of the proximal tubule. K1 denotes half of the range of pressure variation around its reference value P̄o; K2 quantifies TGF sensitivity (see below); the target concentration Cop is the time-independent steady-state chloride concentration alongside the MD, when P(0, t) = P̄o (i.e., when Cop = C(2L, t − τ)); and C(2L, t − τ) is the chloride concentration alongside the MD at the time t − τ, where τ represents the TGF delay. The TGF response in Eq. (5) defines a sigmoidal relationship between inflow pressure and time-delayed MD chloride concentration that is consistent with experimental data [2,34].
Model parameters
Model parameter values are given in Table 1. The descending portion of the short loop of Henle is structurally and functionally divided into four segments. The first segment extends through the cortex and corresponds to the proximal convoluted tubule. The second segment, which corresponds to the proximal straight tubule, terminates at the boundary between the outer and inner stripe (approximately 0.6 mm from the cortico-medullary boundary). For simplicity, we sometimes assume the proximal straight tubule as a part of the short descending limb, although strictly speaking it is not. The third segment, which corresponds to the water-permeable segment of the short descending limb, spans the first 60% of the inner stripe. The fourth segment, which corresponds to the water-impermeable segment of the short descending limb, spans the remainder of the inner stripe.
Table 1.
Model Parameters
| Symbol | Description | Dimensional value |
|---|---|---|
| aDL | Proximal tubule and descending limb compliance | 0.45 × 10⁻⁵ cm·mmHg−1 [28,33,42] |
| aTAL | TAL compliance | 0.266 × 10⁻⁵cm·mmHg−1 [28,33,42] |
| β0 | Initial boundary value for β0,1(x) | 8.843 μm |
| β1 | End boundary value for β0,1(x) | 5.43 μm |
| β2 | End boundary value for β1,2(x) | 9.98 μm |
| β3 | End boundary value for β2,3(x) | 6.55 μm |
| Ce,o | Interstitial Cl− concentration at the upper cortex | 150 mM [26] |
| Ce,1 | Interstitial Cl− concentration at the loop bend | 275 mM [10] |
| Co | Cl− concentration at proximal tubule entrance | 160 mM |
| Cop | Steady-state Cl− concentration at MD | 32 mM [34] |
| KM | Michaelis constant | 70 mM [9] |
| L0 | Total length of model nephron | 2.5 cm |
| L | Length of TAL or proximal tubule and descending limb | 0.5 cm [37] |
| LC | Length of the proximal convoluted tubule or the cortical TAL | 0.3 cm |
| LD | Length of the short descending limb or the medullary TAL | 0.2 cm |
| xω | Position where the water-impermeable segment of the descending limb starts | 0.42 cm [36] |
| ad | Position where the unpressurized radius begins to decrease after the MD | 1.25 cm |
| Pe | Extratubular (steady-state) pressure | 5.0 mmHg [17,29] |
| P̄o | Steady-state inflow pressure at the proximal tubule | 13.0 mmHg [42] |
| P1 | Pressure at end of nephron | 2.0 mmHg [1,7,8] |
| κPCT | Proximal convoluted tubule Cl− permeability for 0 ≤ x ≤ LC | 20.0 × 10⁻⁵ cm·s−1 [38] |
| κPST | Proximal straight tubule Cl− permeability for LC ≤ x ≤ xω | 10.0 × 10⁻⁵ cm·s−1 [39] |
| κDL | Descending limb Cl− permeability for xω ≤ x ≤ L | 1.5 × 10⁻⁵ cm·s−1 [31] |
| κTAL | TAL Cl− permeability for L ≤ x ≤ 2L | 1.5 × 10⁻⁵ cm·s−1 [31] |
| Vmax, PCT | Proximal convoluted tubule maximum active Cl− transport rate | 28.0 nmole·cm−2s−1 |
| Vmax, PST | Proximal straight tubule maximum active Cl− transport rate | 2.5 nmole·cm−2s−1 [6] |
| Vmax, DL | Descending limb maximum active Cl− transport rate | 0.0 nmole·cm−2s−1 |
| Vmax, TAL | TAL maximum active Cl− transport rate | 19.18 nmole·cm−2s− 1 [6] |
| μ | Fluid dynamic viscosity | 7.2 ×10⁻³ g·cm−1s− 1 [42] |
| τ | Base-case TGF delay | 3.5 s [3] |
| K1 | Half of the range of pressure variation around P̄o | 6 mmHg |
| K2 | TGF sensitivity, | – |
The lengths of the proximal convoluted tubule and the cortical TAL are each assumed to be LC = 3 mm. The total length of the short descending limb, including the proximal straight tubule, is assumed to be LD = 2 mm; the length of the medullary TAL is also assumed to be LD = 2 mm. Note that the length of the TAL (both medullary and cortical) is L = LC + LD = 5 mm [37], and the total length of the proximal tubule, descending limb, and TAL is 2L. Note that the fluid dynamics equations (Eq. (1)–(2), (4)) are solved for 0 ≤ x ≤ L0 (= 5L), corresponding to the entire model nephron, whereas the chloride conservation equation (Eq. (3)) is solved for 0 ≤ x ≤ 2L, corresponding to the tubule up to the MD.
The unpressurized tubular radius parameter β(x) is given (in μm) by the piecewise function:
| (6) |
where βi,j(x) denotes a cubic polynomial defined in x0 ≤ x ≤ x1 such that βi,j(x0) = βi and βi,j(x1) = βj, and β′(x0) = β′(x1) = 0. The parameters β0, β1, β2, and β3 (8.8, 5.4, 9.9, and 6.6 μm, respectively) were chosen such that in the time-independent steady state (when Q is a constant in time and space), the tubular radius was ~5.5 at the loop bend and ~10 μm at the MD [19], and so that the tubular fluid pressure was ~8 mmHg at the MD (i.e., x = 2L) and ~2 mmHg at the end of the model tubule (i.e., x = L0). xw denotes the position at which the water-impermeable segment of the descending limb begins; xw is taken to be LC + 0.6LD. ad denotes the position past the MD at which the tubular radius begins to decrease and is set to 2.5 × L.
Extratubular concentration is specified by
| (7) |
where A1 = (1 − Ce,1/Ce,o)/(1 − exp(A3)), A2 = 1 − A1, and A3 = 2, and where Ce,o denotes a cortical interstitial concentration of 150 mM and Ce,1 denotes an interstitial loop bend concentration of 275 mM. At a given axial level, the descending limb and TAL interact with extratubular fluids having the same Cl− concentration; thus, Ce(x) is assumed to be symmetric around x = L. Because interstitial chloride concentration is not well-characterized within the medulla, the parameters A1 and A3 were chosen to yield a profile consistent with previous studies [21,22].
We assume a single-nephron glomerular filtration rate (SNGFR) of 30 nl/min at steady state. Micropunture experiments have shown that approximately two-thirds of the water and NaCl are reabsorbed along the proximal convoluted tubules [42]; thus, the water flow rate into the proximal straight tubule is ~10 nl/min. As previously noted, anatomical findings have indicated that a terminal segment of the short descending limb is water impermeable [36]. The TAL is known to be water impermeable. Given these considerations, the trans-mural water flux term Φ(x, t) is assumed to be a piecewise constant function, depending only on the flow rate to the entrance of the proximal tubule, Q(0, t), at time t. Together with appropriate inflow pressure and luminal radius, the model predicts a steady-state water flow rate that is consistent with the above measurements and that is ~7.0 nl/min at the loop bend (i.e., x = L):
| (8) |
Recall that LC and xω are the positions where the proximal straight tubule (or, descending limb) and the water-impermeable segment of the descending limb begin, respectively (see Fig. 2).
The proximal convoluted tubule is assumed to have a moderate Cl− permeability of 20 ×10−5 cm·s−1 [38].The proximal straight tubule is assumed to be moderately NaCl permeable; the descending limb and TAL are assumed to have a low Cl− permeability of 1.5 × 10⁻⁵ cm·s−1 [31].
The base-case tubular wall compliance is set to αDL = 0.45×10⁻⁵ cm·mmHg−1 for the proximal tubule and the descending limb, and to αTAL = 0.266 × 10⁻⁵ cm·mmHg−1 for the TAL. These values are 1/5 of measured compliance in isolated tubule studies [42]. This choice of the TAL compliance is based on the consideration that the effective compliance of the TAL tubular walls may be lowered in vivo by the stiffness of the interstitial matrix, and by the resistance exerted by neighboring TALs whose tubular fluid may be oscillating in synchronization [28].
3 Results
3.1 Steady-state model predictions
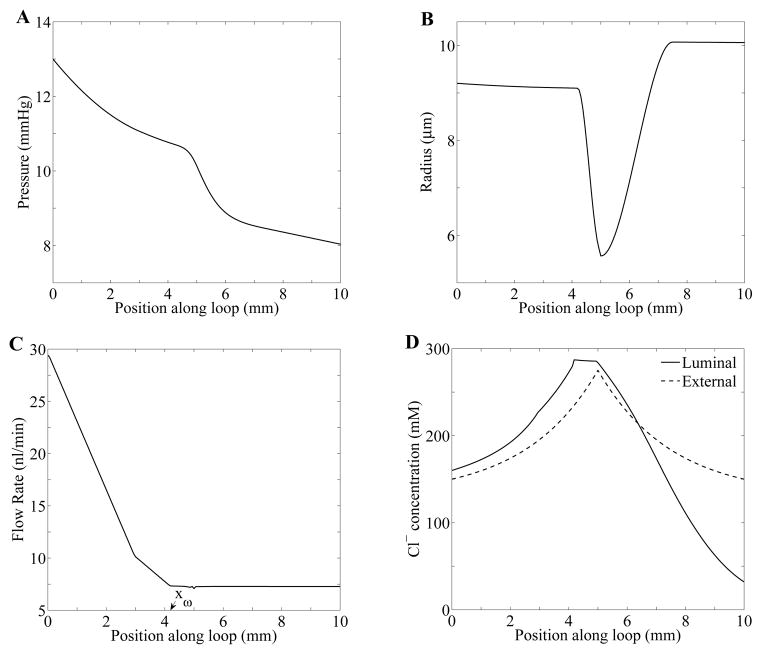
The model equations (Eqs. 1–4) were solved, using parameters displayed in Table 1, by means of the numerical method described in Ref. [24]. Steady-state spatial profiles of pressure, radius, flow, and chloride concentration along the loop are shown in Fig. 3. At steady-state, tubular fluid pressure decreases along the tube (panel A), to ~10 mmHg at the loop bend and ~8 mmHg at the MD. The steady state water flux term Φ(x) determines the volumetric flow rate (panel C). Along the proximal convoluted tubule (0 ≤ x ≤ LC = 3 mm), tubular fluid rate decreases from 30 to 10 nl/min; then, along the proximal straight tubule and the water-permeable descending limb segment (LC < x ≤ xw = 4.2 mm) from 10 to 7 nl/min. The remainder of the loop (x > xw), which includes a terminal segment of the short descending limb and the TAL, is assumed to be water-impermeable; thus, tubular fluid flow remains constant at ~ 7 nl/min. Steady-state tubular radius, exhibited in panel B, is a function of transmural pressure (Eq. 4).
Fig. 3.
Steady state tubular fluid pressure (panel A), luminal radius (panel B), tubular flow rate (panel C), Cl− concentration (panel D) as functions of position. xω in panel C denotes the position at which the water-impermeable segment of the descending limb starts.
Steady-state tubular fluid Cl− concentration profile is shown in Fig. 3D. As water is reabsorbed from the proximal convoluted tubule and the water-permeable segment of the short descending limb, tubular fluid Cl− concentration rises. However, at xω = 4.2 mm where the water-impermeable segment starts, Cl− concentration stops increasing and instead remains almost constant. At the loop bend (x = 5 mm), chloride permeability, κ, and maximum active Cl− transport rate, Vmax, change. Along the TAL, chloride concentration decreases owing to that active reabsorption of NaCl.
3.2 Tubular wall compliance lowers the stability of the TGF system
By solving the nonlinear model equations (Eqs. (1)–(4)) numerically, we computed parameter boundaries, as functions of gain γ and delay τ, that separate differing model behaviors. The TGF gain γ is a measure of the closed feedback loop sensitivity at steady state. This value depends on two derivatives (slopes), and , given by
| (9) |
where CMD = C(2L, t − τ), Cop is the target chloride concentration at the MD, and Css is the steady-state chloride concentration profile shown in Fig. 3D (solid curve). The dependence of Po on CMD is given in Eq. (5). The first derivative comes from the TGF response to a deviation of CMD from Cop. In other words, this quantifies the sensitivity of the TGF system to deviations from the target MD concentration [16]. This derivative can be obtained by differentiating the right-hand side of Eq. (5) with respect to CMD and setting CMD to Cop, i.e., . The other derivative is the slope of the chloride concentration at the MD when the system is at steady state. Note that γ is positive since is negative as shown in Fig. 3D.
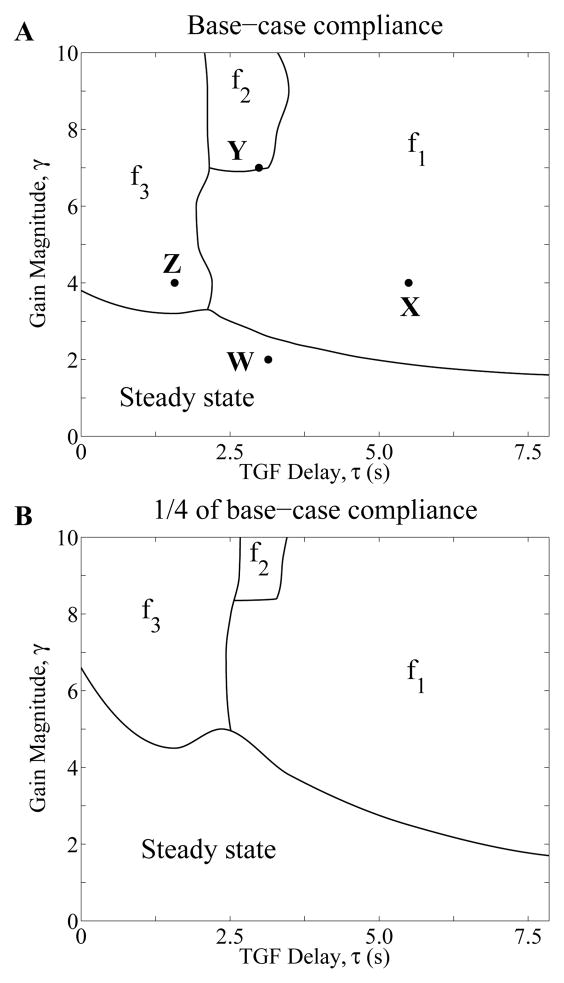
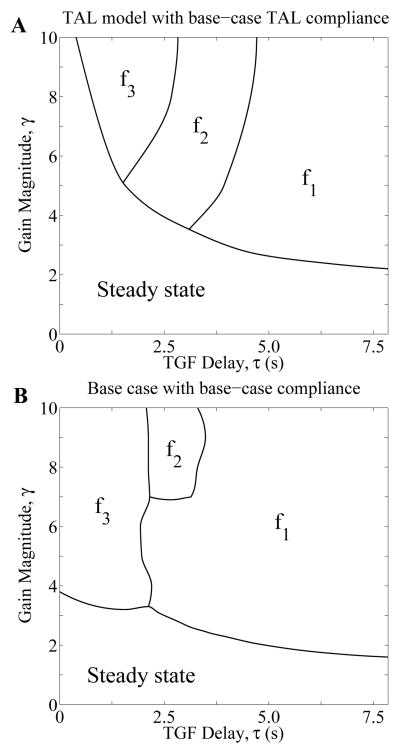
In the regions marked “Steady state” in Fig. 4, the only stable solution is the time-independent steady state. The change in behavior of solutions across the curves between “Steady state” and the above regions arises from a Hopf bifurcation. Across the boundaries, a stable time-independent steady-state solution bifurcates into a regular oscillatory solution. In particular, “fn” (n = 1, 2, 3) labels a region that supports stable LCO-solutions with the nth frequency, with f1 being the natural frequency. The model predicts that for sufficiently small values of γ, i.e. for points (γ, τ) within the region “Steady state”, any initial solution, or any transient perturbation of a steady-state solution, results in the convergence to the time-independent steady-state solution; this is the only stable solution. But for points (γ, τ) in the regions marked “fn” above the “Steady state” region, a perturbation of the steady-state solution results in a LCO with its corresponding frequency fn. Thus, within different regions in the bifurcation diagram, a transient perturbation results in qualitatively different solutions, either the steady-state or LCO, and if LCO, solutions with different frequencies. The emergence of LCO at zero TGF delay (τ = 0) with sufficiently high gain values (> 3.8) can be attributed to the spatial inhomogeneity of the TAL radius shown in Fig. 3B, a result that was previously discussed in [33].
Fig. 4.
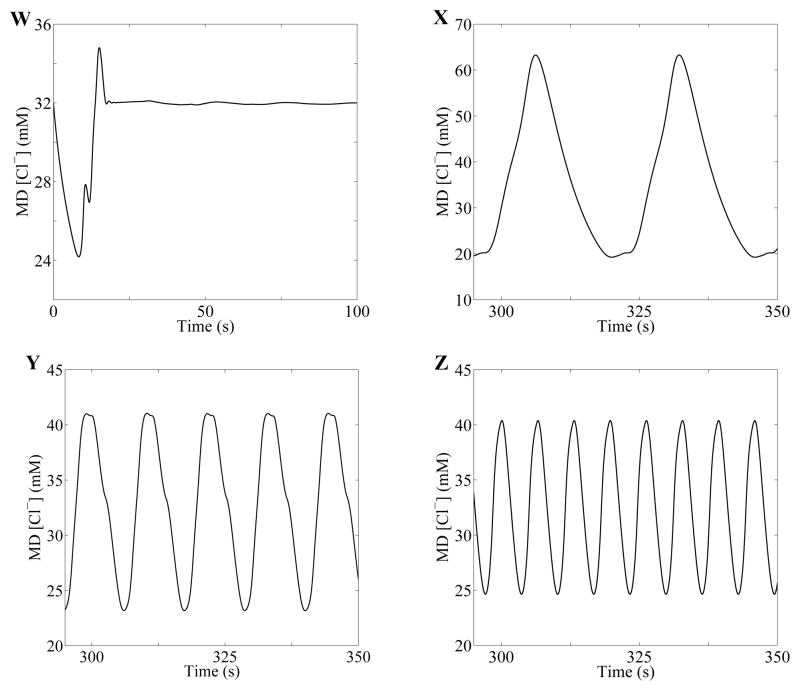
Behaviors of model solutions, based on numerical simulations using base-case compliance (A) and 1/4 of base-case compliance (B). MD chloride concentration oscillations corresponding to the points W, X, Y, and Z are given in Fig. 5.
Simulated oscillations in tubular fluid Cl− concentration at the MD were computed for four points, labeled W, X, Y, and Z in Fig. 4A. These points correspond to the following pairs of delays (in second) and gains: (τW, γW) = (3.14, 2), (τX, γX) = (3.93, 4), (τY, γY) = (2.98, 7), and (τZ, γZ) = (1.57, 4). The time-profiles of the MD [Cl−] following a transient perturbation are shown in Figure 5. Point W, which lies within the “Steady state” regime, corresponds to a time-independent steady state. Points X, Y, and Z, which lie in the f1, f2, and f3 regions, respectively, correspond to oscillatory solutions, with LCO frequencies f1 = 37.68, f2 = 88.66, and f3 = 152.2 mHz, respectively.
Fig. 5.
Sample solutions for points (W: τ = 3.14 s, γ = 2), (X: τ = 3.93 s, γ = 4), (Y: τ = 2.98 s, γ = 7), and (Z: τ = 1.57 s, γ = 4) from Fig. 4A. Oscillation frequencies for X, Y, and Z are estimated to be 37.68, 88.66, and 152.2 mHz, respectively.
Next, to assess the impact of tubular wall compliance on TGF-mediated dynamics, we computed model solutions using tubular wall compliance values that are 1/4 of base-case compliance, i.e., we set αDL = 0.11×10⁻⁵ cm·mmHg−1 and αTAL = 0.066 × 10⁻⁵ cm·mmHg−1. The resulting bifurcation diagram is shown in Fig. 4B. By comparing Figs. 4A and 4B, one notes that the lower tubular wall compliance increases the stability of the TGF system. For instance, for TGF delay τ = 3.5 s, LCO can be obtained using the base-case compliance for a gain value of as low as γ = 2.45, whereas with the reduced compliance, LCOs are predicted above γ = 3.8. In contrast, if wall compliance is increased to 5/2 of base-case value (or 1/2 of the measured values, i.e., αDL = 1.125 × 10⁻⁵ cm·mmHg−1 and αTAL = 0.665 × 10⁻⁵ cm·mmHg−1), the steady-state regime becomes smaller, indicating that the increased compliance further reduces the stability of the TGF system (results not shown).
3.3 Explicit representation of proximal tubule and descending limb lowers the stability of the TGF system
To better understand the impact of the explicit representation of the proximal tubule and descending limb on model dynamics, we compared base-case dynamics with a model that explicitly represents the TAL only. That model is referred to as the “TAL model”. Loop-bend inflow pressure was set to ~10 mmHg and the base-case TAL compliance was applied in the TAL model. Bifurcation curves were computed and are shown in Fig. 6A. A comparison with base-case curves (Fig. 6B) shows that bifurcation curves are noticeably lower in the base case. For a TGF delay of 3.5 s, the base case predicts oscillations above a critical gain value of γ = 2.45, whereas the TAL model predicts a substantially higher critical gain value of γ = 3.27. These results suggest that explicit representation of the proximal tubule and descending limb of the loop of Henle lowers the stability of the system.
Fig. 6.
Behaviors of model solutions for the TAL model (A) using base-case TAL compliance and for the base-case whole-loop model (B) from Fig. 4A.
3.4 LCO increases distal NaCl delivery but fluid delivery remains relatively stable
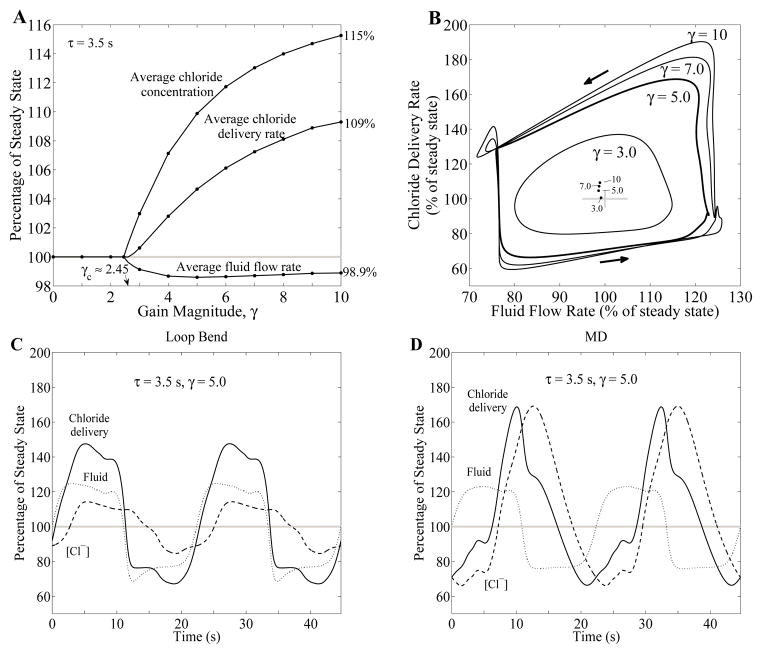
We studied the effects, in the context of distal fluid and NaCl delivery, of LCO that arises from transient pressure perturbations. To that end, we computed and compared fluid and chloride delivery rates at the MD in the steady state with corresponding time-averaged rates during LCO. Results for gain values from 0 to 10 with TGF delay τ = 3.5 s, are summarized in Fig. 7A, where the time-averaged variables are normalized by their corresponding steady-state base-case values. Dimensional results for selected γ values are given in Table 2. As shown in Fig. 4A, for a TGF delay of 3.5 s, LCO emerges at the critical gain value γc ≈ 2.45. As γ exceeds γc, fluid delivery is lowered by LCO, to a maximum of −1.41% at γ ≈ 5. In contrast, time-averaged MD chloride concentration progressively rises with increasing γ. The result of these two competing factors is that, for sufficiently large γ values, distal chloride delivery increases with γ, to +9.3% at γ = 10.
Fig. 7.
Effect of TGF gain γ on chloride delivery, with TGF delay τ = 3.5 s. A: Time-average MD fluid flow rate, chloride concentration, and chloride fluid delivery rate as functions of gain magnitude γ. These variables are expressed as percentages of their corresponding steady-state base-case values. Gray bar indicates 100% of steady-state base-case values for comparison. B: phase plots, showing MD chloride delivery as a function of TAL fluid flow rate, for selected gain values γ. Arrows indicate direction of time evolution. Maxima of fluid flow and chloride delivery rates increase significantly as γ increases while minima are restricted. Inset: time-averaged fluid flow rate and chloride delivery. C and D: oscillations profiles in fluid flow rate (dotted curve), chloride concentration (dashed curve), and chloride delivery rate (solid curve) at the loop bend (panel C) and at the MD (panel D), for γ = 5. Variables are expressed as percentages of corresponding steady-state base-case values. Chloride delivery rate is the product of fluid flow rate and chloride concentration.
Table 2.
Base-case time-averaged MD variables for selected gain values with TGF delay τ = 3.5 s
| Gain Magnitude, γ | Fluid Flow Rate, nl/min | [Cl−], mM | Cl− Delivery Rate, pmol/min |
|---|---|---|---|
| Steady State | |||
| γ ≤ γc | 7.273 | 31.96 | 232.5 |
| LCO | |||
| 3 | 7.210 | 32.91 | 233.9 |
| 5 | 7.170 | 35.12 | 243.3 |
| 7 | 7.179 | 36.13 | 249.3 |
| 10 | 7.192 | 36.84 | 254.1 |
Figure 7B shows a phase plot, where the values of chloride delivery are plotted as a function of TAL fluid flow rate determined at the MD, for γ = 3, 5, 7, and 10. As γ increases, the peak chloride delivery rate increases substantially, to a maximum of ~90% for γ = 10. In contrast, the decrease in the minimum is restricted to ~40%. The dots in center of the plot show time-averaged values for fluid flow and chloride delivery rates for different gain values.
To understand why distal chloride delivery is increased by LCO, whereas distal fluid delivery remains relatively stable, we study the time-profiles in the fluid flow, chloride concentration, and chloride delivery at the loop bend and at the MD, obtained for γ = 5 and τ = 3.5 s. Figures 7C and D show these variables at the loop bend and at the MD, respectively, normalized by the corresponding steady-state base-case values. As shown in Fig. 7C, the oscillations of loop-bend variables are symmetric around respective steady-state values. However, while MD oscillations in fluid flow are approximately symmetric around its steady-state value, chloride concentration oscillations exhibit sharp crests, relative to their troughs (Fig. 7D), and are shifted upwards relative to those of fluid delivery. The upward shift and sharp crests relative to their troughs can be explained by the Michaelis-Menten-like kinetics that characterize the active NaCl transport of the TAL, which limits the extent to which MD [Cl−] can be lowered as the NaCl reabsorption approaches static head, where the luminal [Cl−] is sufficiently low that active NaCl reabsorption is balanced by passive backleak. Furthermore, because of the dependence of MD chloride concentration and other related variables on TAL transit time, the chloride concentration waveform is phase-shifted relative to the fluid flow waveform, a prediction that is consistent with experimental recordings [16]. As a result, the chloride delivery rate, given by the instantaneous product of fluid flow rate and chloride concentration, exhibits phase and upwards shifts as well. The competing effects of the sharp crests and upward-shifted waveform result in the increase in the time-averaged distal chloride delivery rate shown in Fig. 7A for γ > γc. A comparison of Fig. 7C and Fig. 7D indicates that the waveform distortion, specifically in the chloride concentration, that increases distal chloride delivery happens mostly along the TAL: time-averaged fluid flow rates are approximately equal, 98.5 and 98.6% of respective steady-state values, at the loop bend and MD, respectively. But while at the loop bend chloride concentration and flow rate remain almost at steady-state values (101 and 100% of steady state), MD values exhibit significant increases over steady-state values (110 and 105% for chloride concentration and delivery rate, respectively).
3.5 High-frequency oscillations reduces the effect of LCO on distal NaCl delivery
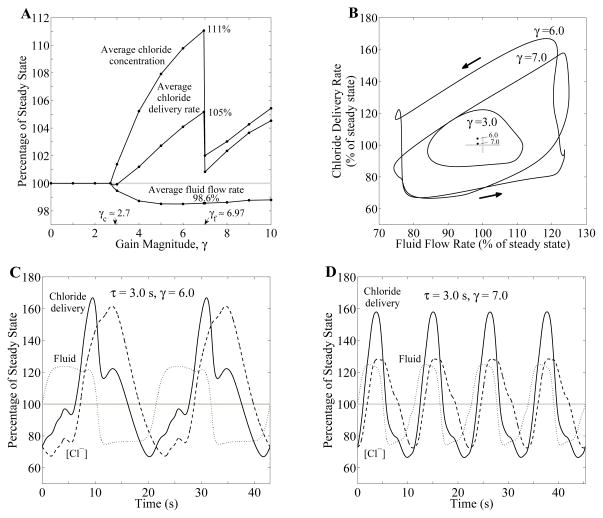
As results in Fig. 5 suggest, oscillations of different frequencies can be excited at different TGF gain and delay values. To study how the oscillation frequency impacts distal NaCl delivery to the MD, we computed time-averaged MD fluid flow rate, chloride concentration, and chloride fluid delivery for gain values from 0 to 10, and for TGF delay τ = 3 s. Key variables are normalized by their corresponding steady-state values and summarized in Fig. 8A. Model solution behaviors are similar to the previous simulation results in Fig. 7A for γ < 6.97. When γ exceeds 6.97, model parameters cross a bifurcation curve and enter a f2-LCO regime (see Fig. 4A). Owing to its shorter period and smaller amplitude, relative to f1-LCO, f2-LCO exhibits a drop in time-averaged chloride concentration and delivery rate. Indeed, for γ = 7, the time-averaged chloride delivery rate is predicted to be only 0.8% higher than steady-state value.
Fig. 8.
Effect of TGF gain γ on chloride delivery, with TGF delay τ = 3 s. A: Time-average MD fluid flow rate, chloride concentration, and chloride fluid delivery rate as functions of gain magnitude γ. B: phase plots, showing MD chloride delivery rate as a function of TAL fluid flow rate determined at the MD, for selected gain values γ. Arrows indicate direction of time evolution. The phase curve corresponding to higher frequency oscillation (γ = 7) is much smaller compared to the curve for γ = 6. Inset: time-averaged fluid flow and chloride delivery rates for selective gain values. C and D: oscillations in TAL fluid flow rate (dotted curve), chloride concentration at the MD (dashed curve), and chloride delivery rate to the MD (solid curve), for γ = 6 and γ = 7, respectively. Variables are expressed as percentages of steady-state base-case values.
Model results, shown in Fig. 8B as a phase plot of chloride delivery versus fluid flow rate, further illustrate the frequency-dependency of LCO-mediated distal chloride delivery. The area enclosed by the phase curve corresponding to γ = 7 is noticeably smaller compared to γ = 6, which indicates a reduction in the oscillation amplitude. The oscillation profiles in Figs. 8C and 8D show that the γ = 7 profiles are also more nearly sinusoidal compared to the γ = 6 profiles and to Fig. 7D. The more sinusoidal waveforms result in smaller deviations from steady-state delivery rates. Thus, the time-averaged chloride delivery rate is decreased for higher-frequency oscillations as indicated in Fig. 8B, inset.
3.6 Mean TAL flow affects TGF waveform distortion and distal NaCl delivery
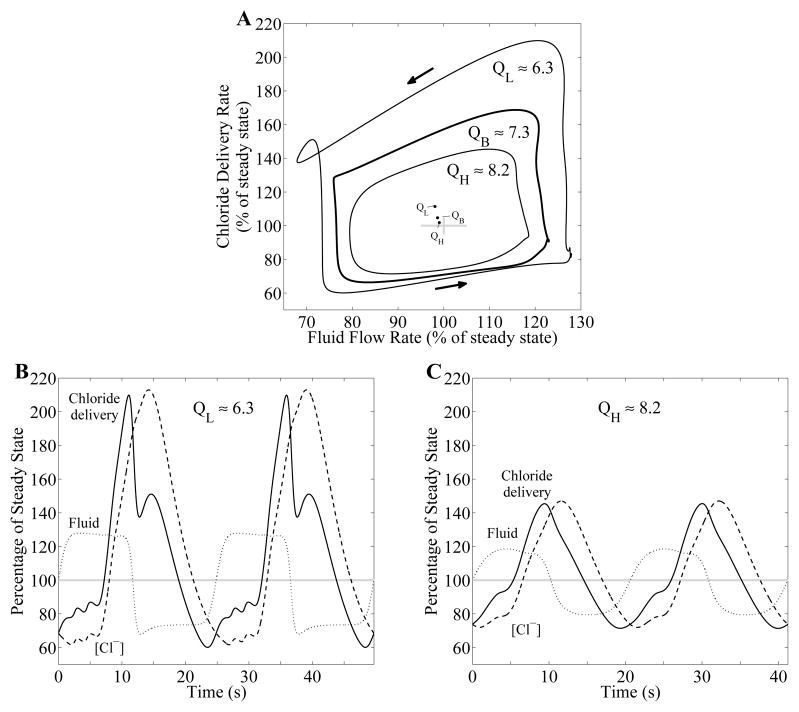
We then conducted simulations designed to characterize the influence of mean TAL flow on the strength of the nonlinearities in the transduction process that produces a nonlinear waveform in [Cl−] at the MD, and on distal chloride delivery. In separate simulations, we scaled water reabsorption rate along the proximal tubule and water-permeable descending limb segment to attain steady-state TAL fluid flow of QL ≈ 6.3 and QH ≈ 8.2 nl/min (base-case QB ≈ 7.3 nl/min) while keeping tubular fluid pressure ~2 mmHg at the end of the model tubule (i.e., x = L0). TAL maximum active transport rate Vmax was simultaneously adjusted so that steady-state MD [Cl−] is ~32 mM in all cases.
With γ and τ set to 5 and 3.5 s, respectively, all three cases predicted LCO. The model predicted that the TGF-mediated oscillations have larger amplitudes and are less sinusoidal at lower baseline flow rates (compare Fig. 9, panels B and C, and compare the areas of the three regions in Fig. 9A). These results can be attributed to the larger fractional change in flow during oscillations at a lower mean flow. Also, owing to the inverse relationship between flow and transit time (transit time becomes infinite as flow approaches zero), the case where the mean flow is lower should exhibit larger, more asymmetric, swings in transit time, leading to a stronger slope asymmetry. Taken together, the differences in waveform and oscillation amplitude yield a larger increase in distal chloride delivery at a lower mean TAL flow rate (+11.4% at QL compared to +1.82% at QH); see inset of Fig. 9A.
Fig. 9.
Effect of TAL fluid flow rate on chloride delivery with TGF delay τ = 3.5 s and gain γ = 5. A: phase plots, showing chloride delivery rate to MD as a function of TAL fluid flow rate, for selected TAL fluid flow rates (in nl/min), QL = 6.3, QB = 7.3 (base-case), and QH = 8.2 nl/min. Inset: time-averaged fluid flow and chloride delivery rates. As fluid flow rate in the TAL is increased, time-averaged chloride delivery rate is decreased while time-averaged flow rate is increased. B and C: oscillations in TAL fluid flow rate (dotted curve), chloride concentration at the MD (dashed curve), and chloride delivery rate to the MD (solid curve). Variables are expressed as percentages of corresponding steady-state base-case values.
3.7 In the presence of sustained perturbations, LCO significantly increases distal NaCl delivery
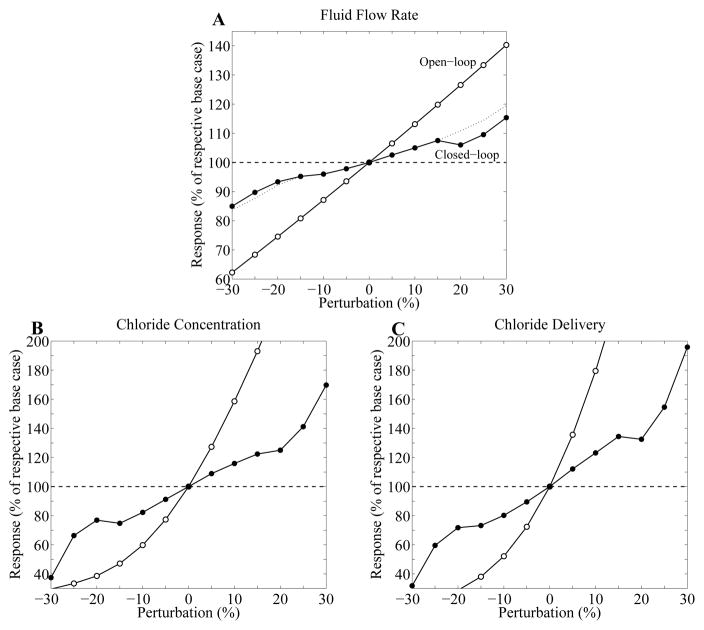
Next we simulated an experimental technique in which sustained perturbations are imposed on proximal tubule fluid flow in a nephron where the TGF feedback loop is closed and functional [13,15,16]. We computed the responses of MD variables for proximal tubule pressure perturbations of up to ±30% and for γ = 5. Model responses to the perturbations, illustrated in Fig. 10, are given as percentage deviations from base-case LCO values at zero perturbation. Analogous responses for the control case in which TGF was disabled were also computed. The deviations of MD variables from base-case steady-state values in response to sustained perturbations are summarized in Table 3.
Fig. 10.
Effect of sustained perturbations of inflow pressure on MD fluid flow rates, chloride concentrations, and chloride delivery rates, for TGF gain γ = 5 and delay τ = 3.5 s. Results were obtained for two cases: no TGF control (open-loop, open circle), TGF control with LCO (closed-loop, closed circle). For perturbations of ± 20%, 25%, and 30%, the LCO were suppressed by the perturbations. A: time-averaged flow rate at MD, given as a percentage of respective base-case values, in response to the sustained perturbations in inflow pressure. Dotted line is obtained via extrapolation. B: time-averaged chloride concentration at MD, as percentage of respective base-case values. C: time-averaged chloride delivery rate to MD, as a percentage of respective base-case values.
Table 3.
Deviations of MD variables from steady-state base-case, for gain γ = 5
| Perturbation, % | Fluid Flow, % | [Cl−], % | Cl− Delivery, % | |||
|---|---|---|---|---|---|---|
|
| ||||||
| OL | LCO | OL | LCO | OL | LCO | |
| −30 | −37.7 | −15.0 (*) | −70.4 | −62.6 (*) | −81.5 | −68.2 (*) |
| −25 | −31.6 | −10.3 (*) | −66.6 | −33.7 (*) | −77.1 | −40.4 (*) |
| −20 | −25.4 | −6.63 (*) | −61.4 | −23.1 (*) | −71.2 | −28.2 (*) |
| −15 | −19.2 | −6.13 | −52.9 | −17.8 | −62.0 | −23.3 |
| −10 | −12.9 | −5.35 | −40.2 | −9.58 | −47.9 | −16.0 |
| −5 | −6.46 | −3.54 | −22.6 | −0.230 | −27.6 | −6.30 |
| 0 | 0 | −1.40 | 0 | 9.87 | 0 | 4.69 |
| 5 | 6.53 | 1.11 | 19.7 | 19.6 | 35.6 | 17.3 |
| 10 | 13.1 | 3.53 | 27.3 | 28.2 | 79.4 | 28.9 |
| 15 | 19.8 | 6.01 | 34.5 | 36.0 | 131.2 | 40.7 |
| 20 | 26.6 | 6.01 (*) | 129.7 | 25.0 (*) | 190.6 | 32.5 (*) |
| 25 | 33.4 | 9.54 (*) | 167.8 | 41.2 (*) | 257.1 | 54.6 (*) |
| 30 | 40.3 | 15.4 (*) | 206.7 | 69.7 (*) | 330.1 | 95.8 (*) |
OL, open-loop without feedback;
LCO are suppressed by the perturbations.
When TGF was assumed absent, the open-loop case yielded large deviations from steady-state values. Deviations in MD fluid flow rates were similar to the proximal tubule pressure perturbations, whereas deviations in chloride concentrations and chloride flow rates were much larger.
Compared to the open-loop case, the closed-loop case predicted substantially smaller deviations from steady-state MD variables. When perturbations of ±15% were applied, fluid delivery varied by ~6%. Substantially larger variations were obtained for MD chloride concentration (up to 36%) and for chloride delivery (up to 41%). These results suggest that while TGF regulates chloride delivery, LCO results in larger deviation in distal NaCl delivery than in distal fluid delivery, which may lead to enhanced NaCl excretion. The reduced regulatory ability of TGF by LCO was previously observed with transient perturbations in Sec. 3.4. A comparison of the two types of perturbations indicates that transient perturbations yield relatively small deviations in time-averaged MD fluid delivery, chloride concentration, chloride delivery from steady-state values (1, 10, and 5%, respectively), whereas the sustained perturbations of ±15% result in much larger deviations (up to 6, 36, and 41%, respectively). The drop in MD chloride concentration (and thus chloride delivery rate) at ±20% perturbation is due to the suppression of LCO. When yet larger perturbations are applied, MD [Cl−] and Cl− flow continue to rise, despite the absence of LCO.
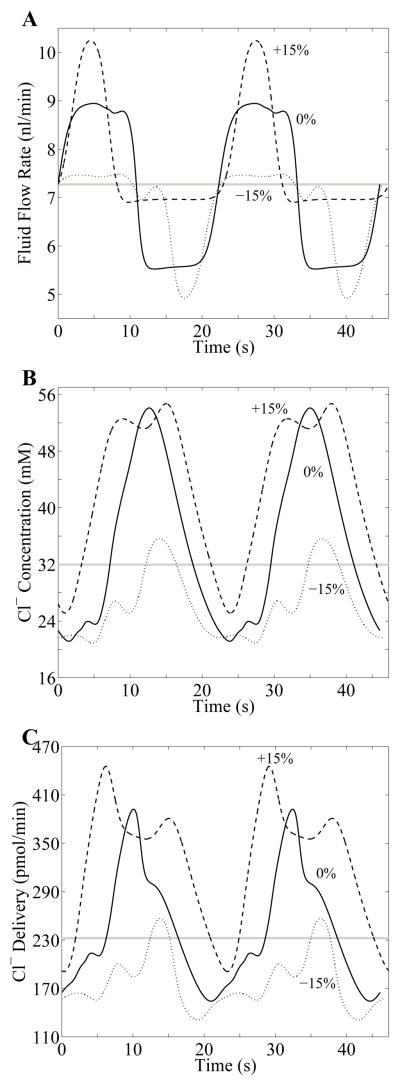
LCO waveforms for fluid flow, chloride concentration, and chloride flow at the MD are shown in Fig. 11 for three cases: sustained proximal tubule pressure perturbations of −15%, 0%, and +15%. Compared to the profiles obtained for transient perturbations (Figs. 7D and 8C), the marked nonlinearity of the TGF system is more evident in the distortion of the waveforms obtained in the cases with sustained perturbations. It is particularly noteworthy that the vertical shifts of the profiles were exaggerated, augmenting the deviations of delivery responses from steady state.
Fig. 11.
Waveforms in response to the sustained perturbations in inflow pressure of −15%, 0%, and +15% for TGF gain γ = 5 and delay τ = 3.5 s. For each perturbation, the waveforms of TAL fluid flow rate at the MD (panel A), chloride concentration at the MD (panel B), and chloride delivery rate to the MD (panel C) are in the appropriate relative phase relationship. Horizontal gray line in each panel corresponds to steady-state base-case value. Solid Curves labeled 0% in each panel represents the LCO for γ = 5 and τ = 3.5 s, for no perturbation; Dashed and dotted curves correspond to sustained perturbations of +15% and −15%, respectively.
3.8 Effect of distal tubule and collecting duct representation on the model behaviors is nearly negligible
Recall that to avoid specifying the poorly-characterized pressure at the end of the TAL, the model represents a downstream resistance tube that is loosely associated with the distal tubule and the contiguous collecting duct system. The downstream resistance tube is assumed water impermeable and its un-pressurized luminal radius β(x) was chosen so that the hydrostatic pressure at x = L0 is ~2 mmHg. In vivo, however, water is reabsorbed along the distal tubules and, in anti-diuresis, along the collecting duct. Also, the collecting ducts undergo a series of coalescences in the inner medulla.
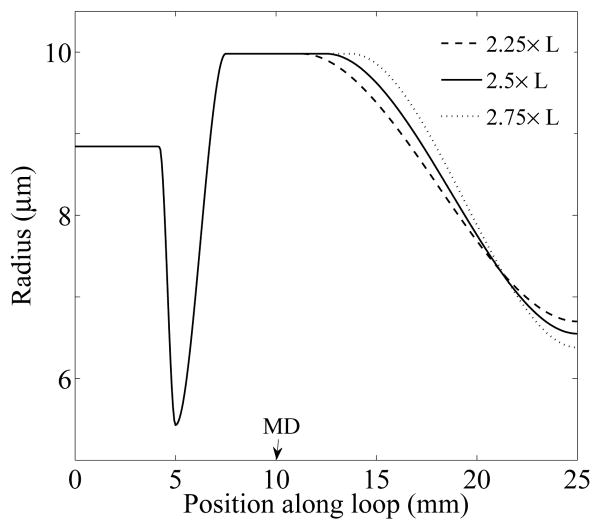
To assess the sensitivity of model results to the differences in physical and transport properties between the simple downstream resistance tube and the distal tubules and collecting duct system, we conducted sensitivity studies in which we varied the parameter ad, which is the location at which the unpressurized luminal radius β(x) begins to decrease after the MD (see Eq. (6)). We obtained model results for ad = 2.25 ×L, 2.5 ×L (base case), and 2.75 ×L. For all three cases, β0, β1, β2, were set to base-case values, so that the steady-state (pressurized) tubular radius remained unchanged up to the MD (as shown in Fig. 3B). β3 and Vmax,TAL were chosen for the three cases to produce MD chloride concentration of ~32 mM as well as P(L0) = 2 mmHg. These values are shown in Table 4.
Table 4.
Individual parameter values for three cases in the sensitivity study
| ad | 2.25 × L | 2.5 × L | 2.75 × L |
|---|---|---|---|
| β3 (μm) | 6.70 | 6.55 | 6.38 |
| Vmax,TAL (nmol·cm−2s−1) | 18.08 | 19.18 | 18.05 |
The three β(x) profiles are illustrated in Fig. 12. In all three cases, the TGF-mediated dynamic behaviors appear nearly insensitive to changes in downstream resistance tube representation. For instance, with the base-case compliance, the boundaries between different regions in the bifurcation diagram are qualitatively similar in all cases, with relative differences of < 0.1%. The impact on other model predictions, and on results obtained for the tubular compliance having 1/4 of the base-case, is similarly small, and all cases yielded the prediction that compliance in tubular walls increases the tendency for the TGF system to oscillate.
Fig. 12.
Profiles of the unpressurized luminal radius β(x) for three different cases: ad = 2.25 × L (dashed line), 2.5 × L (base-case, solid line), 2.75 × L (dotted line). x = 5 and x = 10 mm correspond to the loop bend and the MD, respectively.
4 Discussion
We have extended the TGF model developed in previous studies by us [20, 23, 33] and by other groups [26,27,32] to study the dynamic behaviors and regulatory functions of the TGF system. Our previous TGF models represent the TAL in detail because luminal chloride concentration changes substantially along the TAL, and because MD chloride concentration is believed to be the principal signal for the TGF response [34]. In contrast, those models represent the actions of the proximal tubule and descending limb of the short-looped nephron by means of simple, phenomenological representations, using a linear function that represents glomerular-tubular balance in the proximal tubule and water reabsorption from the descending limb [26]. The present model computes tubular fluid flow and chloride concentration along the proximal tubule and descending limb, with water reabsorption prescribed such that ~7/30 of the SNGFR reaches the loop bend. With the explicit representation of these segments, the model predicts a TGF system with dynamic behaviors that are qualitatively consistent with previous models.
Numerical simulations of model solutions revealed a complex parameter regime, consistent with TGF gain and delays in rat kidney, where qualitatively different model solutions are possible: a regime having one stable, time-independent steady-state solution, and regimes having stable oscillatory solutions with fundamental frequency f1 or with higher frequencies fn’s. Interestingly, the parameter regime corresponding to near physiological gain and delay values overlaps with the bifurcation boundaries that separate f1-, f2-, and f3-LCO. This implies that small changes in system parameters may give rise to switching between oscillatory modes. As a result, when a small group of nephrons with differing system parameters are coupled, through electro-tonic conduction along the pre-glomerular vasculature [12,18,41], the resulting LCO-mediated tubular flow oscillations may exhibit rather complex power spectra, as found in spontaneously hypertensive rats [14,40].
Another new feature of this TGF model is a representation of compliant tubular walls of the loop of Henle. In many of our previous TGF models [23,26,27,32], the TAL is represented by a rigid tube with plug flow that carries only the chloride ion. In vivo, however, the TAL likely expands and contracts as luminal fluid flow rate changes, although the wall movements may be hindered by surrounding TALs and connecting tissues. To assess the extent to which tubular flow oscillations may be attenuated by the compliant wall movement, we have recently developed a compliant TAL model that represents pressure-driven flow and compliant walls [20,24]. Model results in those studies suggest that TAL compliance amplifies the nonlinearity of chloride concentration oscillations at the MD [24] and increases the tendency of the TGF system to oscillate [20]. Similar results were obtained using the extended whole-loop model in the present study (see Fig. 4).
The tubular compliance of the loop was set to one-fifth of the measurements in isolated tubules. The reduced compliance is intended to account for the possible tethering of the loop to other tubules via the interstitial matrix; possible synchronization of the oscillations in tubular fluid pressure and flows, and thus of the distension of the tubular walls, among neighboring tubules; and the renal capsule, which contains the kidney and may limit the distension of tubules and vessels. However, because the extent to which the above factors lower in situ compliance of the loop has not been quantified, the reduction factor (one-fifth) used in this present study is a reasonable but ad hoc choice.
Our previous TGF modeling study [33] represents only the TAL in details, but the other tubular segments using phenomenological relations. By comparing the dynamics of that model and the present more inclusive model, we conclude that explicit representation of the proximal tubule and descending limb reduces the stability of the TGF system (see Fig. 6). The present study also supports an observation made in Ref. [33], in which we used a TAL model with spatially inhomogeneous radius and NaCl transport rate, and we found that the spatial dependence of TAL parameters is an important bifurcation parameter. Up until then, it was generally believed that a TGF system may generate a LCO solution for sufficiently long feedback delays and for sufficiently high gains. In contrast, results in Ref. [33] and in the present study indicate that, provided that the TAL radius is smaller or the maximum TAL NaCl re-absorption rate is higher near the loop bend, a nonzero (or, sufficiently long) delay is not necessary for the emergence of LCO. In particular, the present model predicts oscillatory solutions at zero TGF delay and TGF gains > 3.8 (see Fig. 4A).
We also used the model to better understand the effects of transient flow perturbations on the TGF system. The model predicts that the onset of LCO that arises from transient pressure perturbations results in increases in time-averaged distal NaCl delivery, whereas distal fluid delivery is not much affected (see Fig. 7A). The degree to which distal NaCl delivery is raised depends on whether nephron flow is steady or oscillatory, and if oscillatory, whether the LCO is at the fundamental or higher frequency. Despite the modest magnitude of the increment in distal NaCl delivery, this prediction indicates that the nonlinearity in the TGF system may result in dissociation of the regulation of fluid and salt delivery, and in the potential of LCO to differentially increase a time-averaged distal NaCl delivery and enhance sodium excretion.
Another goal of this study is to investigate the effects of sustained flow perturbation on the TGF system and on distal NaCl delivery. We found that TGF-mediated LCO in nephron flow can lead to reduced TGF regulation of chloride delivery to the distal nephron, a result that is consistent with previous modeling studies [32]. Indeed, the model results paint a complex picture of TGF regulation of distal NaCl delivery, inasmuch as the regulatory efficacy of TGF can vary immediately as the dynamic state of the nephron switches from steady state to LCO. For instance, the response to an increase in tubular fluid load exhibits an non-monotonic dependence on the amplitude of the perturbation. For finite perturbations that are sufficiently large to suppress LCO, deviations from the steady-state increase but likely remain smaller than deviations obtained in the presence of LCO (see Fig. 10A, dotted line which is computed via extrapolation). Thus, model results suggest that the system yields an enhanced TGF autoregulatory response in terms of glomerular filtration rate (see Fig. 10A): when large surges in blood flow and introvascular pressure are sensed, the AA constricts, thereby reducing blood flow, regulating glomerular filtration, and protecting the renal microcirculation.
The present TGF model can be used as an essential component in models of integrated renal hemodynamic regulation. By coupling a number of TGF models, one can investigate how internephron coupling may give rise to synchronization or irregular flow oscillations. And using an approach similar to Ref. [30], which studied the interactions between TGF and the myogenic response, the TGF model could then be combined with a model of glomerular filtration (e.g., Ref. [4]) and a model of the afferent arteriole (e.g., Ref. [35]), to study the interactions between the myogenic and TGF mechanisms in the context of renal autoregulation.
Acknowledgments
This research was supported by the National Institutes of Health: National Institute of Diabetes and Digestive and Kidney Diseases, Grant DK089066 to A.T. Layton, and by the National Science Foundation, through Grants DMS-0701412 to A.T. Layton and Research Training Grant DMS-0943760 to the Department of Mathematics at Duke University.
Footnotes
Portions of this work were presented at Experimental Biology 2012 (FASEB J 26:690.1, 2012)
Contributor Information
Hwayeon Ryu, Email: hwayeon@math.duke.edu, Department of Mathematics, Duke University, Box 90320, Durham, NC 27708-0320, Tel.: +919-660-2829, Fax: +919-660-2824.
Anita T. Layton, Department of Mathematics, Duke University, Box 90320, Durham, NC 27708-0320
References
- 1.Angell SK, Pruthi RS, Shortliffe LD. The urodynamic relationship of renal pelvic and bladder presures, and urinary flow rate in rats with congenital vesicoureteral reflux. J Urology. 1998;160:150–156. [PubMed] [Google Scholar]
- 2.Briggs JP. A simple steady-state model for feedback control of glomerular filtration rate. Kidney Int. 1982;22(Suppl 12):S143–S150. [PubMed] [Google Scholar]
- 3.Casellas D, Moore LC. Autoregulation and tubuloglomerular feedback in juxtamedullary glomerular arterioles. Am J Physiol (Renal Fluid Electrolyte Physiol 27) 1990;258:F660–F669. doi: 10.1152/ajprenal.1990.258.3.F660. [DOI] [PubMed] [Google Scholar]
- 4.Deen WM, Robertson CR, Brenner BM. A model of glomerular ultrafiltration in the rat. Am J Physiol. 1972;223(5):1178–1183. doi: 10.1152/ajplegacy.1972.223.5.1178. [DOI] [PubMed] [Google Scholar]
- 5.Eaton DC, Pooler JP. Vander’s Renal Physiology. 6. McGraw-Hill Medical; New York: 2004. [Google Scholar]
- 6.Garg LC, Mackie S, Tischer CC. Effects of low potassium diet on Na-K-ATPase in rat nephron segments. Pflügers Arch. 1982;394:113–117. doi: 10.1007/BF00582911. [DOI] [PubMed] [Google Scholar]
- 7.Gottschalk CW. A comparable study of renal interstitial pressure. Am J Physiol. 1952;169:180–187. doi: 10.1152/ajplegacy.1952.169.1.180. [DOI] [PubMed] [Google Scholar]
- 8.Gottschalk CW, Mylle M. Micropuncture study of pressures in proximal and distal tubules and peritubular capillaries of the rat kidney during osmotic diuresis. Am J Physiol. 1957;189:323–328. doi: 10.1152/ajplegacy.1957.189.2.323. [DOI] [PubMed] [Google Scholar]
- 9.Greger R, Schlatter E, Lang F. Evidence for electroneutral sodium chloride co-transport in the cortical thick ascending limb of henle’s loop of rabbit kidney. Pflügers Arch. 1983;396:308–314. doi: 10.1007/BF01063936. [DOI] [PubMed] [Google Scholar]
- 10.Hai MA, Thomas S. The time-course of changes in renal tissue composition during lysine vasopressin infusion in the rat. Pflügers Arch. 1969;310:297–319. doi: 10.1007/BF00587241. [DOI] [PubMed] [Google Scholar]
- 11.Han JS, Thompson KA, Chou C-L, Knepper MA. Experimental tests of three-dimensional model of urinary concentratning mechanism. J Am Soc Nephrol. 1992;2:1677–1688. doi: 10.1681/ASN.V2121677. [DOI] [PubMed] [Google Scholar]
- 12.Holstein-Rathlou N-H. Synchronization of proximal intratubular pressure oscillations: evidence for interaction between nephrons. Pflügers Arch. 1987;408:438–443. doi: 10.1007/BF00585066. [DOI] [PubMed] [Google Scholar]
- 13.Holstein-Rathlou N-H. A closed-loop analysis of the tubuloglomerular feedback mechanism. Am J Physiol (Renal Fluid Electrolyte Physiol 30) 1991;261:F880–F889. doi: 10.1152/ajprenal.1991.261.5.F880. [DOI] [PubMed] [Google Scholar]
- 14.Holstein-Rathlou N-H, Leyssac PP. TGF-mediated oscillations in the proximal intratubular pressure: Differences between spontaneously hypertensive rats and Wistar-Kyoto rats. Acta Physiol Scand. 1986;126:333–339. doi: 10.1111/j.1748-1716.1986.tb07824.x. [DOI] [PubMed] [Google Scholar]
- 15.Holstein-Rathlou N-H, Leyssac PP. Oscillations in the proximal intratubular pressure: a mathematical model. Am J Physiol (Renal Fluid Electrolyte Physiol 21) 1987;252:F560–F572. doi: 10.1152/ajprenal.1987.252.3.F560. [DOI] [PubMed] [Google Scholar]
- 16.Holstein-Rathlou N-H, Marsh DJ. Oscillations of tubular pressure, flow, and distal chloride concentration in rats. Am J Physiol (Renal Fluid Electrolyte Physiol 25) 1989;256:F1007–F1014. doi: 10.1152/ajprenal.1989.256.6.F1007. [DOI] [PubMed] [Google Scholar]
- 17.Holstein-Rathlou N-H, Marsh DJ. A dynamic model of the tubuloglomerular feedback mechanism. Am J Physiol (Renal Fluid Electrolyte Physiol 27) 1990;258:F1448–F1459. doi: 10.1152/ajprenal.1990.258.5.F1448. [DOI] [PubMed] [Google Scholar]
- 18.Källskog Ö, Marsh DJ. TGF-initiated vascular interactions between adjacent nephrons in the rat kidney. Am J Physiol (Renal Fluid Electrolyte Physiol 28) 1990;259:F60–F64. doi: 10.1152/ajprenal.1990.259.1.F60. [DOI] [PubMed] [Google Scholar]
- 19.Knepper MA, Danielson RA, Saidel GM, Post RS. Quantitative analysis of renal medullary anatomy in rats and rabbits. Kidney Int. 1977;12:313–323. doi: 10.1038/ki.1977.118. [DOI] [PubMed] [Google Scholar]
- 20.Layton AT. Feedback-mediated dynamics in a model of a compliant thick ascending limb. Math Biosci. 2010;228:185–194. doi: 10.1016/j.mbs.2010.10.002. [DOI] [PMC free article] [PubMed] [Google Scholar]
- 21.Layton AT, Edwards A. Tubuloglomerular feedback signal transduction in a short loop of Henle. Bull Math Biol. 2010;72(1):34–62. doi: 10.1007/s11538-009-9436-4. [DOI] [PubMed] [Google Scholar]
- 22.Layton AT, Layton HE. A region-based mathematical model of the urine concentrating mechanism in the rat outer medulla: I. Formulation and base-case results. Am J Physiol Renal Physiol. 2005;289:F1346–F1366. doi: 10.1152/ajprenal.00346.2003. [DOI] [PubMed] [Google Scholar]
- 23.Layton AT, Moore LC, Layton HE. Multistability in tubuloglomerular feedback and spectral complexity in spontaneously hypertensive rats. Am J Physiol Renal Physiol. 2006;291:F79–F97. doi: 10.1152/ajprenal.00048.2005. [DOI] [PubMed] [Google Scholar]
- 24.Layton AT, Moore LC, Layton HE. Signal transduction in a compliant thick ascending limb. Am J Physiol Renal Physiol. 2012;302:F1188–F1202. doi: 10.1152/ajprenal.00732.2010. [DOI] [PMC free article] [PubMed] [Google Scholar]
- 25.Layton HE. Mathematical models of the mammalian urine concentrating mechanism. In: Layton HE, Weinstein AM, editors. Membrane Transport and Renal Physiology, The IMA Volumes in Mathematics and Its Applications. New York: Springer; 2002. pp. 233–272. [Google Scholar]
- 26.Layton HE, Pitman EB, Moore LC. Bifurcation analysis of TGF-mediated oscillations in SNGFR. Am J Physiol (Renal Fluid Electrolyte Physiol 30) 1991;261:F904–F919. doi: 10.1152/ajprenal.1991.261.5.F904. [DOI] [PubMed] [Google Scholar]
- 27.Layton HE, Pitman EB, Moore LC. Limit-cycle oscillations and tubuloglomerular feedback regulation of distal sodium delivery. Am J Physiol Renal Physiol. 2000;278:F287–F301. doi: 10.1152/ajprenal.2000.278.2.F287. [DOI] [PubMed] [Google Scholar]
- 28.Leyssac PP, Baumbach L. An oscillating intratubular pressure response to alterations in Henle loop flow in the rat kidney. Acta Physiol Scand. 1983;117:415–419. doi: 10.1111/j.1748-1716.1983.tb00015.x. [DOI] [PubMed] [Google Scholar]
- 29.MacPhee PJ, Michel CC. Fluid uptake from the renal medulla into the ascending vasa recta in anaesthetized rats. J Physiol. 1995;487:169–183. doi: 10.1113/jphysiol.1995.sp020869. [DOI] [PMC free article] [PubMed] [Google Scholar]
- 30.Marsh DJ, Sosnovtseva OV, Chon KH, Holstein-Rathlou N-H. Nonlinear interactions in renal blood flow regulation. Am J Physiol Regul Integr Comp Physiol. 2005;288:R1143–R1159. doi: 10.1152/ajpregu.00539.2004. [DOI] [PubMed] [Google Scholar]
- 31.Mason J, Gutsche HU, Moore LC, Müller-Suur R. The early phase of experimental acute renal failure. IV. The diluting ability of the short loops of Henle. Pflügers Arch. 1979;379:11–18. doi: 10.1007/BF00622899. [DOI] [PubMed] [Google Scholar]
- 32.Oldson DR, Layton HE, Moore LC. Effect of sustained flow perturbations on stability and compensation of tubuloglomerular feedback. Am J Physiol Renal Physiol. 2003;285:F972–F989. doi: 10.1152/ajprenal.00377.2002. [DOI] [PubMed] [Google Scholar]
- 33.Ryu H, Layton AT. Effect of tubular inhomogeneities on feedback-mediated dynamics of a model of a thick ascending limb. Math Med Biol. 2012 doi: 10.1093/imammb/dqs020. in press. [DOI] [PMC free article] [PubMed] [Google Scholar]
- 34.Schnermann J, Briggs JP. Function of the juxtaglomerular apparatus: Control of glomerular hemodynamics and renin secretion. In: Alpern RJ, Hebert SC, editors. Seldin and Giebisch’s The Kidney: Physiology and Pathophysiology. 4. Amsterdam; Boston: Elsevier Academic Press; 2008. pp. 589–626. [Google Scholar]
- 35.Sgouralis I, Layton AT. Autoregulation and conduction of vasomotor responses in a mathematical model of the rat afferent arteriole. Am J Physiol Renal Physiol. 2012;303:F229–F239. doi: 10.1152/ajprenal.00589.2011. [DOI] [PMC free article] [PubMed] [Google Scholar]
- 36.Wade JB, Lee AJ, Ecelbarger CA, Mitchell C, Bradford AD, Terris J, Kim G-H, Knepper MA. UT-A2: a 55-kDa urea transporter in thin descending limb whose abundance is regulated by vasopressin. Am J Physiol Renal Physiol. 2000;278:F52–F62. doi: 10.1152/ajprenal.2000.278.1.F52. [DOI] [PubMed] [Google Scholar]
- 37.Wahl M, Schnermann J. Microdissection study of the length of different tubular segments of rat superficial nephrons. Z Anat Entwicklungsgeschichte. 1969;129:128–134. doi: 10.1007/BF00522242. [DOI] [PubMed] [Google Scholar]
- 38.Weinstein AM. An equation for flow in the renal proximal tubule. Bull Math Biol. 1986;48(1):29–57. doi: 10.1007/BF02460061. [DOI] [PubMed] [Google Scholar]
- 39.Weinstein AM. The Kidney: Physiology and Pathophysiology. 3. Philadelphia: Lippincott Williams & Wilkins; 2000. Sodium and chloride transport: proximal nephron; pp. 1287–1331. [Google Scholar]
- 40.Yip K-P, Holstein-Rathlou N-H, Marsh DJ. Chaos in blood flow control in genetic and renovascular hypertensive rats. Am J Physiol (Renal Fluid Electrolyte Physiol 30) 1991;261:F400–F408. doi: 10.1152/ajprenal.1991.261.3.F400. [DOI] [PubMed] [Google Scholar]
- 41.Yip K-P, Holstein-Rathlou N-H, Marsh DJ. Dynamics of TGF-initiated nephron-nephron interactions in normotensive rats and SHR. Am J Physiol (Renal Fluid Electrolyte Physiol 31) 1992;262:F980–F988. doi: 10.1152/ajprenal.1992.262.6.F980. [DOI] [PubMed] [Google Scholar]
- 42.Young DK, Marsh DJ. Pulse wave propagation in rat renal tubules: implications for GFR autoregulation. Am J Physiol (Renal Fluid Electrolyte Physiol 9) 1981;240:F446–F458. doi: 10.1152/ajprenal.1981.240.5.F446. [DOI] [PubMed] [Google Scholar]


