

Abstract
BACKGROUND
Cardiac magnetic resonance (CMR) T1 mapping is an emerging tool for objective quantification of myocardial fibrosis.
OBJECTIVES
To (a) establish the feasibility of left atrial (LA) T1 measurements, (b) determine the range of LA T1 values in patients with atrial fibrillation (AF) vs healthy volunteers, and (c) validate T1 mapping vs LA intracardiac electrogram voltage amplitude measures.
METHODS
CMR imaging at 1.5 T was performed in 51 consecutive patients before AF ablation and in 16 healthy volunteers. T1 measurements were obtained from the posterior LA myocardium by using the modified Look-Locker inversion-recovery sequence. Given the established association of reduced electrogram amplitude with fibrosis, intracardiac point-by-point bipolar LA voltage measures were recorded for the validation of T1 measurements.
RESULTS
The median LA T1 relaxation time was shorter in patients with AF (387 [interquartile range 364–428] ms) compared to healthy volunteers (459 [interquartile range 418–532] ms; P < .001) and was shorter in patients with AF with prior ablation compared to patients without prior ablation (P = .035). In a generalized estimating equations model, adjusting for data clusters per participant, age, rhythm during CMR, prior ablation, AF type, hypertension, and diabetes, each 100-ms increase in T1 relaxation time was associated with 0.1 mV increase in intracardiac bipolar LA voltage (P = .025).
CONCLUSIONS
Measurement of the LA myocardium T1 relaxation time is feasible and strongly associated with invasive voltage measures. This methodology may improve the quantification of fibrotic changes in thin-walled myocardial tissues.
Keywords: Atrial fibrillation, Cardiac magnetic resonance, T1 mapping, Left atrial fibrosis, Late gadolinium enhancement
Introduction
Atrial fibrillation (AF) is the most common arrhythmia, affects 1%–1.5% of the population and up to 10% of the elderly,1 and is associated with significant morbidity and mortality.2 Many studies highlight an association between atrial fibrosis and AF.3–5 Atrial fibrosis, an adaptive response to various insults, is mediated by excessive fibroblast proliferation resulting in the deposition of proteins within the cardiac interstitial space. Surgical biopsy and autopsy specimens from patients with AF have shown increased diffuse atrial fibrosis compared to those in sinus rhythm.6–8 Innovative studies of late gadolinium enhancement on cardiac magnetic resonance (LGE-CMR) have revealed the presence of focal/cohesive LA fibrosis before and after ablation procedures.5,9 However, the presence of global/diffuse LA fibrosis has not been noninvasively examined.
Cardiac magnetic resonance (CMR) T1 mapping is a recently introduced technique to quantify contrast-enhanced T1 relaxation time in tissues of interest. It has been shown that an inverse linear relationship exists between contrast-enhanced left ventricular (LV) myocardial T1 time and the burden of global myocardial fibrosis.10,11 LV T1 mapping has been used to identify reduced T1 times as a surrogate of increased fibrosis in patients with acute and chronic myocardial infarction,12 valvular disease,13 heart failure,10 non-ischemic dilated cardiomyopathy,14 and hypertrophic cardiomyopathy.15 However, left atrial (LA) T1 mapping has not been investigated as a potential noninvasive measure of diffuse atrial fibrosis. The purpose of the present study was to (a) establish the feasibility of LA T1 measurements, (b) determine the range of LA T1 values in patients with AF vs healthy volunteers, and (c) validate T1 mapping vs global LA intracardiac electrogram amplitude measures as a surrogate of diffuse atrial fibrosis.
Methods
Patients with AF
The study protocol was reviewed and approved by the Johns Hopkins Institutional Review Board. We recruited patients referred for pulmonary vein antral isolation (PVAI) for the treatment of symptomatic AF from January 2011 to April 2012. During the course of the study, CMR was performed in 57 patients before AF ablation. We excluded 6 patients with AF from this study because of respiratory motion artifacts on CMR images. Therefore, data from 51 patients (74% man; median age 55 [interquartile range (IQR) 51–65] years) were acquired and analyzed. The baseline AF type was categorized as paroxysmal (AF self-termination within 7 days), persistent (AF lasting >7 days or requiring cardioversion), or long-standing persistent (AF lasting >1 year). In addition, patients were defined as having lone AF if they were ≤60 years in age and free of hypertension, diabetes mellitus, coronary artery disease, and cardiomyopathy.
Healthy volunteers
Seventeen healthy volunteers underwent CMR scans including the T1 mapping sequence. One volunteer was excluded from analysis owing to respiratory motion artifacts, and the remaining 16 healthy volunteers (31% man, median age 26 [IQR 23–30] years) comprised the control group. The volunteers did not undergo invasive electroanatomic mapping.
T1 mapping protocol
All participants underwent CMR by using a 1.5 Tesla Avanto scanner (Siemens, Erlangen, Germany) and a 6-channel body matrix coil combined with an integrated 6-channel spine matrix for a total of 12 channels. To optimize ablation success,16 patients with persistent or long-standing persistent AF were started on antiarrhythmic medications and referred for external cardioversion 3–4 weeks before CMR and AF ablation. Of 51 patients with AF included in this study, 8 were in AF at the time of CMR and the remaining patients with AF and healthy volunteers (88% of total participants) were in sinus rhythm. The CMR examination was performed by using the same methodology regardless of the presenting rhythm. The CMR examination was performed with the patient in the supine position, during expiratory apnea, and using electrocardiographic gating. Intravenous infusion of gadolinium contrast (Magnevist, Bayer Healthcare Pharmaceuticals, Montville, NJ, 0.15–0.20 mmol/kg) was done at an injection rate of 2 mL/s, followed by a 20–30-mL saline flush. A vertical long-axis modified Look-Locker inversion-recovery sequence (11 images within 17 heartbeats, slice thickness 6 mm, repetition time 200–250 ms, echo time 1.08 ms, flip angle 35°, matrix 192 × 154, field of view 30–36 × 32–36 cm) was performed after contrast injection (median delay 23.8 [IQR 20.9–31.0] minutes).
Analysis of T1 relaxation times
A single reader who was blinded to participants’ case vs control status and clinical information performed T1 mapping. All images were processed off-line by using MASS research software (V2010-EXP, Leiden University, Leiden, The Netherlands), as previously described.17 Regions of interest (ROIs) were placed on the LA posterior wall myocardium for all phases in the Look-Locker sequence (Figure 1). The pixel-by-pixel fit was performed to a 3-parameter model (A − B exp[−TI/T1*]) to obtain myocardial T1 as T1 = (B/A − 1)T1*. Only pixels where the χ2 test for goodness of fit was significant with the level of significance α = 0.05 were included in the average myocardial T1 value.18 Mean T1 times were normalized to a standard gadolinium dose (0.15 mmol/kg), delay times between contrast administration and LL sequence acquisition (11 minutes), and glomerular filtration rate (90 mL/min/1.73 m2) by using the multicompartment model previously validated by Gai et al.17 Similarly, T1 measurements were performed for the LV myocardium by using an ROI in the inferobasal portion of the inferoposterior wall. To assess the potential effects of intraobserver variability in the measurement of T1 relaxation times, we randomly selected a subset of 10 patients in whom the primary user repeated T1 measurements in a separate session. Similarly, to assess the potential effects of interobserver variability, we randomly selected 10 patients in whom a second reader repeated T1 measurements independently.
Figure 1.
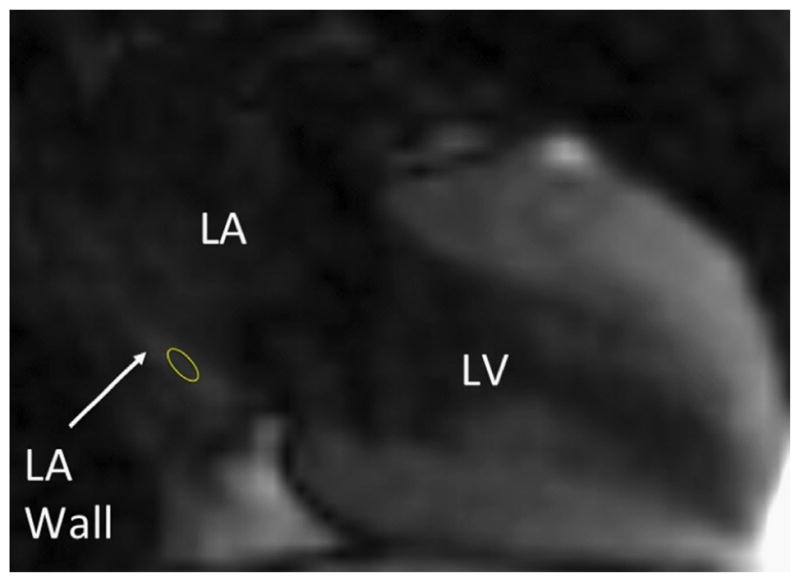
Methodology for the measurement of left atrial T1 relaxation time. The cardiac magnetic resonance image was acquired by using a vertical long-axis modified Look-Locker inversion-recovery sequence. The region of interest (yellow circle) has been placed on the posterior LA wall. LA = left atrial; LV = left ventricular.
Electroanatomic voltage maps
At the beginning of each PVAI procedure, a detailed intracardiac point-by-point sampled LA voltage map was obtained by using the CARTO electroanatomic mapping system (Biosense Webster, Inc, Diamond Bar, CA) by physicians that were blinded to T1 measurements. The 8 patients that presented in AF for the ablation procedure underwent external cardioversion to facilitate the identification of pulmonary vein potentials and the detection of pulmonary vein isolation. External cardioversion, when necessary, was performed before voltage mapping so that patient movement from cardioversion did not disturb the image registration; therefore, mapping was performed in sinus rhythm in all cases. The endocardial contact of the mapping catheter (3.5-mm tip, 2-mm interelectrode spacing, Navistar ThermoCool, Biosense Webster) was confirmed visually with fluoroscopy and through the evaluation of electrograms. PVAI, defined as the electrical disconnection of the PV antrum from the LA, was achieved in all participants. Postablation monitoring was performed for 24 hours after the procedure. No immediate postoperative complications were noted.
Statistical analysis
Continuous variables are presented as mean ± SD or median and IQR. Univariate comparisons were made by using the K-sample equality of medians test or Spearman’s rank correlation, where appropriate. The intraclass correlation coefficients for inter- and intraobserver variability in measuring LA T1 times were calculated by using 2-way random effects models. Inter- and intraobserver variability was also assessed by using Bland-Altman analyses. The association of LA T1 time with history of AF after adjustment for CHADS2 score and body mass index was assessed by using multivariable linear regression. To account for the clustering of data, generalized estimating equation (GEE) models, clustered by patient, and adjusting for potential confounders including age, rhythm during CMR, type of AF, history of prior ablation, hypertension, and diabetes, were used to examine the association between repeated measures local bipolar electrogram voltage and LA T1 measures. Statistical analyses were performed by using STATA 12 (STATA Corp, College Station, TX).
Results
Of 51 patients that underwent PVAI for the treatment of AF, 27 were undergoing their first ablation. Of all patients, AF type was paroxysmal in 20, persistent in 24, and longstanding persistent in 7 patients. Of these patients, 18 had lone AF. Table 1 summarizes baseline characteristics for the patients and healthy volunteers.
Table 1.
Baseline characteristics of patients and control participants
| Characteristic | Patients with AF (n = 51) | Healthy volunteers (n = 16) | P |
|---|---|---|---|
| Age (y) | 55 (51–65) | 26 (23–30) | <.001 |
| Sex: male, n (%) | 38 (74) | 5 (31) | .002 |
| Paroxysmal AF | 20 (39) | NA | |
| Number of prior ablations | 1 (1–2) | NA | |
| CAD | 6 (11) | NA | |
| Stroke/TIA | 3 (6) | NA | |
| Diabetes | 8 (16) | NA | |
| Hypertension | 9 (18) | NA | |
| Nonischemic Cardiomyopathy | 6 (11) | NA | |
| Body mass index (kg/m2) | 27 (25–30) | 24 (21–25) | .001 |
| AF duration (y) | 4 (0.2–9) | NA | |
| LV ejection fraction <50% | 3 (6) | 0 (0) | .321 |
| Number of failed AAD | 1 (0–1) | NA | |
| Class III AAD | 35 (69) | NA | |
| Estimated GFR (mL/min/1.73 m2) | 97 (78–134) | 118 (106–144) | .023 |
| CHADS2 score | 1 (0–1) | 0 (0–0) | .002 |
| Lone AF | 18 (35) | NA |
Values are summarized as numbers (%) or median (interquartile range).
AAD = antiarrhythmic drugs; AF = atrial fibrillation; CAD = coronary artery disease; GFR = glomerular filtration rate; NA = not applicable; TIA = transient ischemic attack.
Left atrial T1 relaxation time
The median LA T1 relaxation time was significantly lower in patients with AF (median 387 [IQR 364–428] ms) when compared to healthy volunteers (median 459 [IQR 418–532] ms; P <.001; Figure 2). The median LA T1 relaxation time was similar in patients with lone AF when compared to patients with nonlone AF (median 396 [IQR 378–453] ms vs 374 [IQR 337–425] ms; P = .490). Among patients with AF, the LA T1 relaxation time was shorter in those with history of ablation compared to those without prior ablation (373 [IQR 350–418] ms and 405 [IQR 375–431] ms, respectively, P = .035). After adjusting for CHADS2 score and body mass index, history of AF remained statistically significantly associated with the LA T1 relaxation time (+80 ms if no history of AF; P < .001).
Figure 2.

Distribution of T1 relaxation time among patients with AF and healthy volunteers. The scatter and box plot overlay diagram displays the postcontrast myocardial T1 times in healthy volunteers and patients with AF. The box plots display the median and the 25th–75th percentile range (center white line and solid black box), the lower and upper adjacent values (thin lines), and data points (dots). AF = atrial fibrillation; LA = left atrial.
LV T1 relaxation time
A trend toward lower LV T1 relaxation time was observed in patients with AF when compared to healthy volunteers (491 [IQR 460–527] ms and 529 [IQR 496–543] ms, respectively; P = .074). In addition, a positive association was noted between LA and LV T1 relaxation times (Spearman’s rho correlation coefficient = .41; P < .001; Figure 3).
Figure 3.

Association between left atrial and left ventricular T1 relaxation times. The scatter diagram and line of best fit display the association between LA and LV postcontrast T1 relaxations times. LA = left atrial; LV = left ventricular.
Reliability of observations
The intraclass correlations for the interreader variability of LA T1 values were .920 for reliability of observations (95% confidence interval [CI] 0.715–0.979) and .958 for reliability of the mean (95% CI 0.834–0.990). The intraclass correlations for the intrareader variability of LA T1 values were .930 for the reliability of observations (95% CI 0.738–0.982) and .964 for the reliability of the mean (95% CI 0.849–0.991). The mean differences in Bland-Altman analyses for repeated measurements of LA T1 time were 5 ms (95% CI −21 to 31 ms) and 16 ms (95% CI −5 to 37 ms) for inter- and intrareader variability, respectively.
Validation of left atrial T1 relaxation time vs an established surrogate of fibrosis: Left atrial point-by-point acquired intracardiac electrogram amplitude
A total of 5065 distinct intracardiac LA electrogram measures were available for analysis. The mean bipolar voltage was 0.97 ± 1.10 mV (range 0.02–5.89 mV; 0.55 between and 0.96 within patient SD). Patients with no history of ablation had a mean voltage of 1.24 mV (range 0.24–2.58 mV), whereas patients with prior ablation had a lower mean voltage (0.68 mV; range 0.23–1.27 mV; P < .0001). A statistically significant association was noted between the LA T1 relaxation time and the mean bipolar voltage for each patient (Spearman’s rho correlation coefficient = .35; P = .01). Examples of LA T1 relaxation curves for 2 patients with corresponding electroanatomic maps are shown in Figure 4. In addition, to maximize the power for analysis and to adjust for potential confounders, the association between point-by-point intracardiac electrogram voltage amplitude measures (rather than mean voltage amplitude for each patient) with the LA T1 time was examined by using a GEE model clustered by patient and adjusting for age, rhythm during CMR, prior ablation, AF type, hypertension, and diabetes. In this model, each 100-ms increase in T1 relaxation time was associated with a 0.1-mV increase in intracardiac bipolar LA electrogram amplitude (P = .025).
Figure 4.

LA T1 relaxation curve examples and the corresponding left atrial bipolar electrogram voltage amplitude maps. Examples of LA T1 relaxation curves (left panels) and the corresponding electroanatomic bipolar electrogram voltage amplitude map as a surrogate of atrial fibrosis (posteroanterior views): (A) 52-year-old man with history of hypertension, diabetes, and persistent AF without prior ablation; (B) 73-year-old woman with history of coronary artery disease, persistent AF, and prior ablation. In the electroanatomic map, the color code represents voltage amplitude, with red corresponding to amplitude <0.1 mV indicative of atrial fibrosis and purple to healthy regions with amplitude >0.5 mV. AF = atrial fibrillation; LA = left atrial.
Discussion
CMR T1 mapping is a relatively new method, in which lower T1 times associate with higher degrees of myocardial fibrosis.10–15,19 The main finding of the present study is that CMR LA T1 mapping for noninvasive tissue characterization of the LA wall is feasible. LA T1 relaxation times were significantly lower in patients with AF vs healthy volunteers. LA T1 times were also lower in patients with AF with prior ablations vs patients with AF without prior intervention, suggesting the presence of increased fibrosis after ablation. Finally, we demonstrated a strong positive association between LA T1 relaxation times and bipolar electroanatomic voltage measurements, which serve as a surrogate of LA fibrosis.20
Prior studies have shown that patients with AF develop LA fibrosis and that increased LA fibrosis is associated with increased prevalence of stroke21 and recurrence of AF after catheter ablation22 and surgical maze procedures.23 LGE-CMR has been used for the quantification of LA fibrosis.5,24 Importantly, the LGE-CMR technique depends on the correct selection of inversion time, reproducible LA wall border identification, and correct identification of the normal myocardium with the null signal.5 The LGE-CMR technique has been reproducible and has led to many important observations.25–28 However, the sophisticated analytic requirements for this methodology22 limit its routine use at other centers with less experience in LGE-CMR. CMR T1 mapping is an alternative method to measure myocardial fibrosis and has been used to assess fibrosis in the ventricles.10,12–15,19 Iles et al10 showed that the global contrast-enhanced myocardial T1 time is inversely correlated to myocardial fibrosis as assessed by histopathology in patients with heart failure. In this study we show that LA myocardium T1 relaxation time can be measured and that the LA T1 relaxation time is associated with the presence of LA fibrosis as quantified by invasive voltage mapping. This is consistent with a previous study published by Oakes et al,5 which showed an association between fibrosis, as detected by CMR-LGE, and voltage maps acquired in the posterior, septal, and anterior LA walls.5 In contrast to the LGE-CMR technique, which identifies focal and cohesive fibrosis, T1 mapping can detect and quantify the extent of global diffuse interstitial myocardial fibrosis.29 We chose to determine the T1 relaxation time from an ROI on the posterior wall due to (a) the anchoring effect of the pulmonary veins, which theoretically reduces arrhythmia-related motion artifacts, and (b) reduced intramural fat content of the posterior wall compared to the septum, which reduces the potential confounding effects of fat deposition upon the T1 relaxation time. Importantly, T1 mapping does not depend on the selection of the correct inversion time and enables limited ROI sampling in well-visualized portions of the LA wall. These attributes along with largely automated measurement strategies have the potential to significantly improve the objectivity, reproducibility, and generalizability of this technique compared to traditional LGE-CMR.
We found that patients with AF had a significantly lower LA contrast-enhanced myocardial T1 relaxation time than healthy participants. We also found that among patients with AF, a history of prior ablations is associated with shorter LA T1 relaxation time. These shorter T1 relaxation times likely reflect increased diffuse fibrosis. Therefore, our results are in concordance with reports using LGE-CMR that demonstrated increased LA fibrosis after ablation procedures.9,30 Importantly, we found an association between LA and LV T1 relaxation times, suggesting that factors affecting the atria may have similar effects on ventricular myocardium. This finding is in agreement with the recent study of Ling et al,31 which revealed the presence of diffuse ventricular fibrosis in patients with AF. Finally, although statistically significant, the simple univariate linear association between mean bipolar voltage and LA T1 relaxation time measures was of modest strength (Spearman’s rho = .35). It is likely that the regional variability in voltage measures and patient level cofounders reduced the strength of this univariate association. When performing GEE analyses that accounted for regional variability in voltage measures within patients and adjusted for patient level covariates, we observed a strong association between bipolar electrogram voltage and LA T1 relaxation times. To the extent that electrogram voltage amplitude correlates with atrial scar,22,32,33 the association between electrogram amplitude and T1 relaxation time further supports T1 mapping as a tool for assessing LA fibrosis.
Study limitations
The study sample size was relatively small. However, the magnitude and strength of associations suggested adequate power for analyses. LA wall thickness in patients with paroxysmal and persistent AF has been reported to be 2.4 ± 0.2 and 2.1 ± 0.2 mm, respectively.34 The modified Look-Locker inversion-recovery sequence used in this study provided a 2.3 × 1.9 mm in-plane resolution and was obtained during ventricular diastole/atrial systole, thus maximizing atrial wall thickness for measurement. Nevertheless, atrial wall thickness was likely near the limit of image resolution in some cases. Because of volume averaging, the ROI may have included blood pool or epicardial fat in some cases. However, the association of T1 time with voltage measures suggests that, on average, the measures represent LA myocardial tissue characteristics. The median age in the healthy volunteer group was significantly lower than that in patients with AF. Therefore, some confounding effect of age on T1 values may be present. Invasive electrogram voltage data were unavailable in the healthy volunteer cohort. However, performing an invasive procedure in this group would be unethical. CMR was performed during AF in 8 patients; however, the placement of the ROI for T1 mapping on the posterior wall likely minimized potential arrhythmia motion artifacts by the anchoring effect of the pulmonary veins. In addition, all patients who presented in AF for the CMR and ablation procedure underwent cardioversion before voltage mapping to facilitate the detection of pulmonary vein isolation. Moreover, after the addition of rhythm during CMR as a potential confounder to the multivariable analysis, the T1 relaxation time remained associated with bipolar voltage. Finally, in this study we have not investigated the association of T1 relaxation time with patient outcomes after catheter ablation. Prospectively collected objective data regarding AF recurrence will be necessary to examine this association.
Clinical significance
Recent data suggest that the quantification of fibrosis may play a role for the appropriate selection of patients most likely to benefit from AF ablation.35 Therefore, T1 mapping, an objective and reproducible methodology for the quantification of tissue composition, may provide future utility for preoperative patient selection. Early diagnosis of reduced LA T1 relaxation time, as a likely surrogate of LA fibrosis, may permit the identification of patients at risk for the subsequent development of permanent AF. Early intervention in such patients might inhibit the progression of disease and could potentially minimize anatomic and electrical remodeling. In addition, the extent of LA fibrosis might predict the expected outcomes of catheter ablation.26 Further prospective studies are needed to assess the utility of LA T1 mapping for the management of AF and other atriopathies.
Conclusions
CMR T1 mapping of the LA myocardium is feasible and may be used to quantify fibrotic changes in the LA wall. Lower average LA T1 times, suggesting increased LA fibrosis, were observed in patients with AF and with increasing ablation attempts. Lower LA T1 relaxation times were also associated with lower bipolar LA voltage measurement as a method to validate our findings. LA T1 mapping may provide utility for AF management.
Acknowledgments
The study was funded by National Institutes of Health grant K23HL089333 (to Dr Nazarian) and by the Dr Francis P. Chiaramonte Foundation and the Norbert and Louise Grunwald Cardiac Arrhythmia Research Fund. Dr Nazarian is on the MRI Advisory Panel (unpaid) for Medtronic and is a scientific advisor to Biosense Webster; he is also the principal investigator for research funding awarded to Johns Hopkins from Biosense Webster and from the National Institutes of Health (K23HL089333). Dr van der Geest is a consultant to Medis Medical Imaging Systems.
ABBREVIATIONS
- AF
atrial fibrillation
- CI
confidence interval
- CMR
cardiac magnetic resonance
- GEE
generalized estimating equation
- IQR
interquartile range
- LA
left atrial
- LGE-CMR
late gadolinium enhancement on cardiac magnetic resonance
- LV
left ventricular
- PVAI
pulmonary vein antral isolation
- ROI
region of interest
References
- 1.Chugh SS, Blackshear JL, Shen WK, Hammill SC, Gersh BJ. Epidemiology and natural history of atrial fibrillation: clinical implications. Am Coll Cardiol. 2001;37:371–378. doi: 10.1016/s0735-1097(00)01107-4. [DOI] [PubMed] [Google Scholar]
- 2.Calkins H, Kuck KH, Cappato R, et al. HRS/EHRA/ECAS expert consensus statement on catheter and surgical ablation of atrial fibrillation: recommendations for patient selection, procedural techniques, patient management and follow-up, definitions, endpoints, and research trial design. A report of the Heart Rhythm Society (HRS) task force on catheter and surgical ablation of atrial fibrillation. Developed in partnership with the European Heart Rhythm Association (EHRA), a registered branch of the European Society of Cardiology (ESC) and the European Cardiac Arrhythmia Society (ECAS); and in collaboration with the American College of Cardiology (ACC), American Heart Association (AHA), the Asia Pacific Heart Rhythm Society (APHRS), and the Society of Thoracic Surgeons (STS). Endorsed by the governing bodies of the American College of Cardiology Foundation, the American Heart Association, the European Cardiac Arrhythmia Society, the European Heart Rhythm Association, the Society of Thoracic Surgeons, the Asia Pacific Heart Rhythm Society, and the Heart Rhythm Society. Heart Rhythm. 2012;9:632–696. e621. doi: 10.1016/j.hrthm.2011.12.016. [DOI] [PubMed] [Google Scholar]
- 3.Frustaci A, Chimenti C, Bellocci F, Morgante E, Russo MA, Maseri A. Histological substrate of atrial biopsies in patients with lone atrial fibrillation. Circulation. 1997;96:1180–1184. doi: 10.1161/01.cir.96.4.1180. [DOI] [PubMed] [Google Scholar]
- 4.Kostin S, Klein G, Szalay Z, Hein S, Bauer EP, Schaper J. Structural correlate of atrial fibrillation in human patients. Cardiovasc Res. 2002;54:361–379. doi: 10.1016/s0008-6363(02)00273-0. [DOI] [PubMed] [Google Scholar]
- 5.Oakes RS, Badger TJ, Kholmovski EG, et al. Detection and quantification of left atrial structural remodeling with delayed-enhancement magnetic resonance imaging in patients with atrial fibrillation. Circulation. 2009;119:1758–1767. doi: 10.1161/CIRCULATIONAHA.108.811877. [DOI] [PMC free article] [PubMed] [Google Scholar]
- 6.Boldt A, Wetzel U, Lauschke J, et al. Fibrosis in left atrial tissue of patients with atrial fibrillation with and without underlying mitral valve disease. Heart. 2004;90:400–405. doi: 10.1136/hrt.2003.015347. [DOI] [PMC free article] [PubMed] [Google Scholar]
- 7.Luo MH, Li YS, Yang KP. Fibrosis of collagen I and remodeling of connexin 43 in atrial myocardium of patients with atrial fibrillation. Cardiology. 2007;107:248–253. doi: 10.1159/000095501. [DOI] [PubMed] [Google Scholar]
- 8.Mariscalco G, Engstrom KG, Ferrarese S, et al. Relationship between atrial histopathology and atrial fibrillation after coronary bypass surgery. J Thorac Cardiovasc Surg. 2006;131:1364–1372. doi: 10.1016/j.jtcvs.2006.01.040. [DOI] [PubMed] [Google Scholar]
- 9.Peters DC, Wylie JV, Hauser TH, et al. Detection of pulmonary vein and left atrial scar after catheter ablation with three-dimensional navigator-gated delayed enhancement MR imaging: initial experience. Radiology. 2007;243:690–695. doi: 10.1148/radiol.2433060417. [DOI] [PubMed] [Google Scholar]
- 10.Iles L, Pfluger H, Phrommintikul A, et al. Evaluation of diffuse myocardial fibrosis in heart failure with cardiac magnetic resonance contrast-enhanced T1 mapping. J Am Coll Cardiol. 2008;52:1574–1580. doi: 10.1016/j.jacc.2008.06.049. [DOI] [PubMed] [Google Scholar]
- 11.Sibley CT, Noureldin RA, Gai N, et al. T1 Mapping in cardiomyopathy at cardiac MR: comparison with endomyocardial biopsy. Radiology. 2012;265:724–732. doi: 10.1148/radiol.12112721. [DOI] [PMC free article] [PubMed] [Google Scholar]
- 12.Messroghli DR, Walters K, Plein S, et al. Myocardial t1 mapping: application to patients with acute and chronic myocardial infarction. Magn Reson Med. 2007;58:34–40. doi: 10.1002/mrm.21272. [DOI] [PubMed] [Google Scholar]
- 13.Sparrow P, Messroghli DR, Reid S, Ridgway JP, Bainbridge G, Sivananthan MU. Myocardial T1 mapping for detection of left ventricular myocardial fibrosis in chronic aortic regurgitation: pilot study. AJR Am J Roentgenol. 2006;187:W630–W635. doi: 10.2214/AJR.05.1264. [DOI] [PubMed] [Google Scholar]
- 14.Han Y, Peters DC, Dokhan B, Manning WJ. Shorter difference between myocardium and blood optimal inversion time suggests diffuse fibrosis in dilated cardiomyopathy. J Magn Reson Imaging. 2009;30:967–972. doi: 10.1002/jmri.21953. [DOI] [PMC free article] [PubMed] [Google Scholar]
- 15.Amano Y, Takayama M, Kumita S. Contrast-enhanced myocardial T1-weighted scout (Look-Locker) imaging for the detection of myocardial damages in hypertrophic cardiomyopathy. J Magn Reson Imaging. 2009;30:778–784. doi: 10.1002/jmri.21921. [DOI] [PubMed] [Google Scholar]
- 16.Rivard L, Hocini M, Rostock T, et al. Improved outcome following restoration of sinus rhythm prior to catheter ablation of persistent atrial fibrillation: a comparative multicenter study. Heart Rhythm. 2012;9:1025–1030. doi: 10.1016/j.hrthm.2012.02.016. [DOI] [PubMed] [Google Scholar]
- 17.Gai N, Turkbey EB, Nazarian S, et al. T1 mapping of the gadolinium-enhanced myocardium: adjustment for factors affecting interpatient comparison. Magn Reson Med. 2011;65:1407–1415. doi: 10.1002/mrm.22716. [DOI] [PMC free article] [PubMed] [Google Scholar]
- 18.Taylor JR. An Introduction to Error Analysis: The Study of Uncertainties in Physical Measurements. Sausalito, CA: University Science Books; 1997. [Google Scholar]
- 19.Messroghli DR, Niendorf T, Schulz-Menger J, Dietz R, Friedrich MG. T1 mapping in patients with acute myocardial infarction. J Cardiovasc Magn Reson. 2003;5:353–359. doi: 10.1081/jcmr-120019418. [DOI] [PubMed] [Google Scholar]
- 20.Zhong H, Lacomis JM, Schwartzman D. On the accuracy of cartomerge for guiding posterior left atrial ablation in man. Heart Rhythm. 2007;4:595–602. doi: 10.1016/j.hrthm.2007.01.033. [DOI] [PubMed] [Google Scholar]
- 21.Daccarett M, Badger TJ, Akoum N, et al. Association of left atrial fibrosis detected by delayed-enhancement magnetic resonance imaging and the risk of stroke in patients with atrial fibrillation. J Am Coll Cardiol. 2011;57:831–838. doi: 10.1016/j.jacc.2010.09.049. [DOI] [PMC free article] [PubMed] [Google Scholar]
- 22.Verma A, Wazni OM, Marrouche NF, et al. Pre-existent left atrial scarring in patients undergoing pulmonary vein antrum isolation: an independent predictor of procedural failure. J Am Coll Cardiol. 2005;45:285–292. doi: 10.1016/j.jacc.2004.10.035. [DOI] [PubMed] [Google Scholar]
- 23.Kainuma S, Masai T, Yoshitatsu M, et al. Advanced left-atrial fibrosis is associated with unsuccessful maze operation for valvular atrial fibrillation. Eur J Cardiothorac Surg. 2011;40:61–69. doi: 10.1016/j.ejcts.2010.11.008. [DOI] [PubMed] [Google Scholar]
- 24.McGann CJ, Kholmovski EG, Oakes RS, et al. New magnetic resonance imaging-based method for defining the extent of left atrial wall injury after the ablation of atrial fibrillation. J Am Coll Cardiol. 2008;52:1263–1271. doi: 10.1016/j.jacc.2008.05.062. [DOI] [PubMed] [Google Scholar]
- 25.Akoum N, Mcgann C, Vergara G, et al. Atrial fibrosis quantified using late gadolinium enhancement MRI is associated with sinus node dysfunction requiring pacemaker implant. J Cardiovasc Electrophysiol. 2012;23:44–50. doi: 10.1111/j.1540-8167.2011.02140.x. [DOI] [PMC free article] [PubMed] [Google Scholar]
- 26.Akoum N, Daccarett M, McGann C, et al. Atrial fibrosis helps select the appropriate patient and strategy in catheter ablation of atrial fibrillation: a DE-MRI guided approach. J Cardiovasc Electrophysiol. 2011;22:16–22. doi: 10.1111/j.1540-8167.2010.01876.x. [DOI] [PMC free article] [PubMed] [Google Scholar]
- 27.Daccarett M, McGann CJ, Akoum NW, MacLeod RS, Marrouche NF. MRI of the left atrium: predicting clinical outcomes in patients with atrial fibrillation. Expert Rev Cardiovasc Ther. 2011;9:105–111. doi: 10.1586/erc.10.177. [DOI] [PMC free article] [PubMed] [Google Scholar]
- 28.Kuppahally SS, Akoum N, Badger TJ, et al. Echocardiographic left atrial reverse remodeling after catheter ablation of atrial fibrillation is predicted by preablation delayed enhancement of left atrium by magnetic resonance imaging. Am Heart J. 2010;160:877–884. doi: 10.1016/j.ahj.2010.07.003. [DOI] [PMC free article] [PubMed] [Google Scholar]
- 29.Mewton N, Liu CY, Croisille P, Bluemke D, Lima JA. Assessment of myocardial fibrosis with cardiovascular magnetic resonance. J Am Coll Cardiol. 2011;57:891–903. doi: 10.1016/j.jacc.2010.11.013. [DOI] [PMC free article] [PubMed] [Google Scholar]
- 30.Badger TJ, Daccarett M, Akoum NW, et al. Evaluation of left atrial lesions after initial and repeat atrial fibrillation ablation: lessons learned from delayed-enhancement MRI in repeat ablation procedures. Circ Arrhythm Electrophysiol. 2010;3:249–259. doi: 10.1161/CIRCEP.109.868356. [DOI] [PMC free article] [PubMed] [Google Scholar]
- 31.Ling LH, Kistler PM, Ellims AH, et al. Diffuse ventricular fibrosis in atrial fibrillation: noninvasive evaluation and relationships with aging and systolic dysfunction. J Am Coll Cardiol. 2012;60:2402–2408. doi: 10.1016/j.jacc.2012.07.065. [DOI] [PubMed] [Google Scholar]
- 32.Oral H, Chugh A, Good E, et al. Radiofrequency catheter ablation of chronic atrial fibrillation guided by complex electrograms. Circulation. 2007;115:2606–2612. doi: 10.1161/CIRCULATIONAHA.107.691386. [DOI] [PubMed] [Google Scholar]
- 33.Spach MS, Boineau JP. Microfibrosis produces electrical load variations due to loss of side-to-side cell connections: a major mechanism of structural heart disease arrhythmias. Pacing Clin Electrophysiol. 1997;20:397–413. doi: 10.1111/j.1540-8159.1997.tb06199.x. [DOI] [PubMed] [Google Scholar]
- 34.Nakamura K, Funabashi N, Uehara M, et al. Left atrial wall thickness in paroxysmal atrial fibrillation by multislice-CT is initial marker of structural remodeling and predictor of transition from paroxysmal to chronic form. Int J Cardiol. 2011;148:139–147. doi: 10.1016/j.ijcard.2009.10.032. [DOI] [PubMed] [Google Scholar]
- 35.Mahnkopf C, Badger TJ, Burgon NS, et al. Evaluation of the left atrial substrate in patients with lone atrial fibrillation using delayed-enhanced MRI: implications for disease progression and response to catheter ablation. Heart Rhythm. 2010;7:1475–1481. doi: 10.1016/j.hrthm.2010.06.030. [DOI] [PMC free article] [PubMed] [Google Scholar]