Abstract
The harmonics produced by the nonlinear magnetization of superparamagnetic nanoparticles have been utilized in a number of budding medical devices. Here we expand on an earlier technique for quantitatively measuring nanoparticle temperature in a purely ac field by including the presence of a static field. The ability to quantify nanoparticle temperature by tracking changes in the 4th/2nd harmonic ratio is presented and shown to achieve an accuracy of 0.79 K. The advantage of even harmonics, issues with odd harmonics in the presence of a static field and the potential for future incorporation into an imaging system are discussed.
In the presence of a sufficiently strong sinusoidal magnetic field, superparamagnetic particles display a nonlinear magnetization. The frequency spectrum of this magnetization will contain the excitation frequency and higher harmonics of this frequency. These harmonics can be localized using a static field gradient to saturate the signal outside a field free point producing quantitative images of nanoparticle concentration with excellent sensitivity and resolution. This technology, termed magnetic particle imaging (MPI), has recently produced its in vivo images and offers great potential for molecular imaging (Gleich and Weizenecker 2005, Weizenecker et al 2009). These harmonics have also been incorporated into desktop systems capable of quantifying the concentration of particular bacterium or detecting nanoparticles in vivo within a small region of interest (Meyer et al 2007, Nikitin et al 2009). These techniques quantify concentration using the amplitude of the harmonics. Using various ratios of the harmonics, however, valuable information about the particles’ magnetization can be acquired independent of concentration.
One physical parameter that influences the particles’ magnetization is temperature, which has been shown to have a monotonic effect on the ratio of the 5th/3rd harmonics in the presence of a purely sinusoidal field (Weaver et al 2009). This effect can be traced to the Langevin equation which describes the magnetization of superparamagnetic particles. The Langevin equation relates the magnetic energy attempting to align the particles to thermal energy trying to randomize the magnetization:
| (1) |
where M is the magnetization, MS is the saturation magnetization, υ is the magnetic core volume, H is the magnetic field, k is the Boltzmann constant and T is the absolute temperature. Nanoparticle temperature was measured quantitatively in Weaver et al (2009) by relating temperature effects on the 5th/3rd ratio to effects from changing the alternating magnetic field amplitude. By incorporating the temperature dependence of saturation magnetization, according to Bloch’s law it was found that the 5th/3rd ratio was uniquely defined as a function of H/τ with
| (2) |
and values of 2.8E-5 K−a and 1.65 for b and a, respectively (Weaver et al 2009, Caizer 2005).
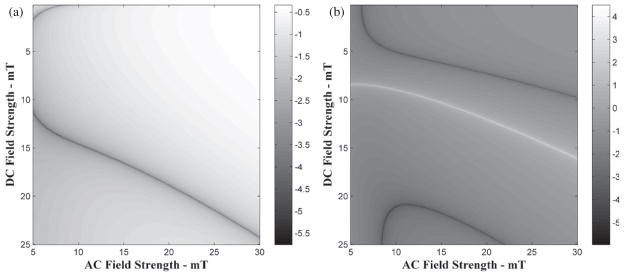
In the case of an alternating magnetic field, H in equation (1) is represented by HACcos(ωt). Due to symmetry, only odd harmonics are produced. With the addition of a static field, H becomes HDC + HACcos(ωt), and even harmonics are also produced. These even harmonics are significantly stronger than the odd harmonics, but the static field complicates the harmonic spectrum by producing numerous local extrema (Weaver et al 2008). Local minima, which will occur at specific ratios of HDC/HAC or at specific temperatures, have been termed noise-and force-induced resonances (Raikher and Stepanov 2002). These features disrupt the monotonic nature of the harmonic ratios. In figure 1, the 5th/3rd and 4th/2nd harmonic ratios are computed from equation (1) for a 15 nm particle subjected to various ac and dc field combinations. The numerous peaks and valleys cause the ratios to no longer be uniquely defined by H/τ. A plot of the 3rd/2nd ratio resembles that of the 4th/2nd but with the valley occurring at lower static fields. Ratios of higher harmonics use weaker signals and contain more extrema.
Figure 1.

(a) A log plot of the harmonic ratio of the 4th over 2nd for a 15 nm particle at various combinations of dc and ac field strength. (b) A similar log plot of the harmonic ratio of the 5th over 3rd.
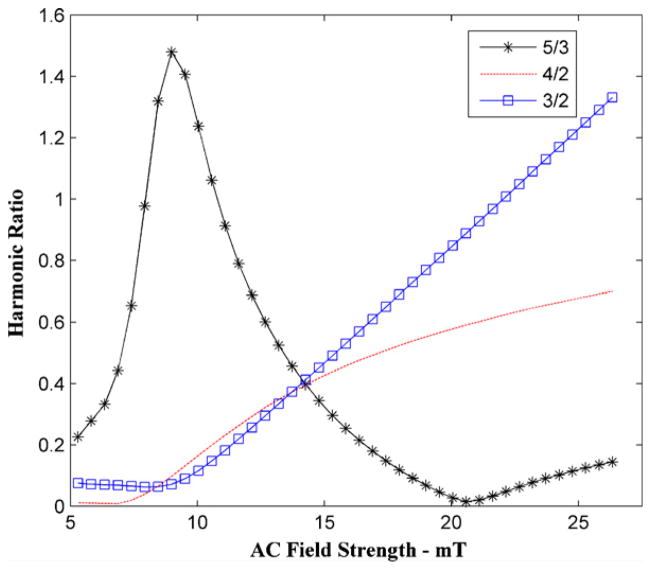
A horizontal slice across the simulation plots of figure 1 was acquired experimentally using a spectrometer setup described previously (Weaver et al 2009, Weaver et al 2008). A calibrated coil outside of the spectrometer measured the ac field strength. A 50 uL sample of Feridex© was measured in the spectrometer in the presence of a 9.5 mT static field produced by a set of permanent magnets. These permanent magnets were positioned to achieve static field homogeneity in the measurement region of ±0.05 mT. At this static field strength the harmonic intensity for a similar particle sample was shown to be near its peak (Weaver et al 2008). A calibration curve as described in Weaver et al (2009) was produced by varying the ac field strength from 5 to 26 mT at 600 Hz, see figure 2. The 5th/3rd ratio contains both maxima and minima while ratios of the 4th/2nd or 3rd/2nd are monotonic above approximately 7 mT and 9 mT, respectively. A minimum in the 5th/3rd ratio occurs at 20.6 mT, which falls near the proposed MPI ac field strength of 18–20 mT (Gleich and Weizenecker (2005), Weizenecker et al (2009)). The presence of this minimum near the region of maximal signal intensity when using MPI ac field strengths limits the usefulness and quality of the 5th/3rd signal.
Figure 2.
The effect of ac field strength on various harmonic ratios of polydisperse Feridex in a constant dc field of 9.5 mT and an ac frequency of 600 Hz.
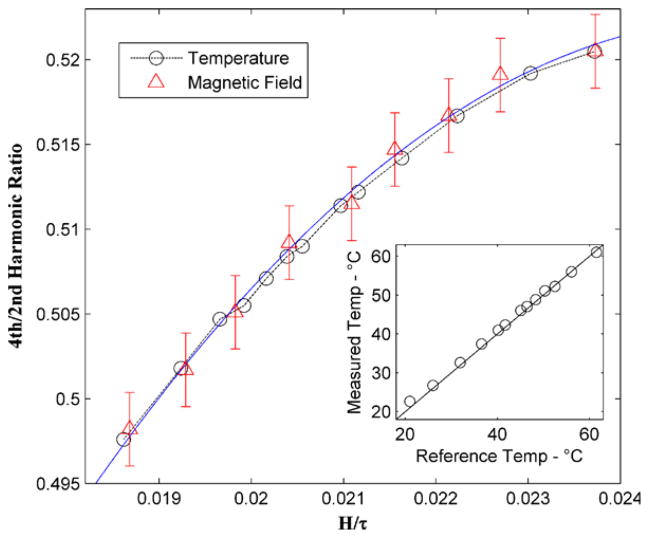
To quantitatively measure temperature, the procedure described previously for generation of a calibration curve was modified for a field consisting of both ac and dc components. To preserve the H/τ relationship, both fields were changed in the generation of the calibration curve, keeping the ratio of dc to ac field strength constant. The ac field strength was varied from 10.2 mT to 8 mT while keeping the HDC/HAC ratio constant at 0.46. The results of such a temperature measurement procedure are demonstrated in figure 3. The 4th/2nd ratio of Feridex was measured at several temperatures between 21 °C and 61.5 °C allowing the sample to equilibrate in a water bath at each measurement temperature. For the temperature variation measurements, an alternating field of 10.2 mT at 4050 Hz and a static field of 4.7 mT were used. The results were plotted against H/τ using the ac field strength for H and τ as defined by equation (2). The best fit to the data was found with variable ‘a’ in equation (2) equal to 1.64 instead of 1.65 as used in Weaver et al (2009). The parameter ‘b’ was kept as 2.8E-5 K−a.
Figure 3.
Temperature and calibration curves for Feridex excited at 4050 Hz. Temperature effects on saturation magnetization were corrected for using b = 2.8E-5 and a = 1.64. The ratio of the dc/ac magnetic field strength was kept constant at 0.46. The solid line is a quadratic fit to the magnetic field variation curve. The temperature range was 21–61 °C. Error bars represent the inaccuracy in static field measurement and inhomogeneity. Inset: comparison of reference temperature from thermometer and temperature measured using harmonic ratio. The line is an ideal fit.
The error in our thermometer temperature measurements was less than 0.5 K primarily due to slight cooling of the sample after its removal from the water bath. Static field strengths were measured with a F. W. Bell 5180 gaussmeter with declared accuracy of 1.1%. The error bars of figure 3 represent the effect of this inaccuracy and limited field homogeneity on the calibration curve. In MRI, static field homogeneity on the order of 1 ppm can be achieved so the error in our measurements due to the static field can be substantially reduced (Dietrich et al 2008). Multiple sample measurements at a given point on the calibration or temperature curves had a standard deviation of 0.02%. The rms error between the water bath temperature and the temperature calculated from the calibration curve was 0.79 K. This error is higher than the 0.3 K reported for only ac fields, but should be improved greatly by better control and homogeneity of both the ac and dc fields. By improving the relatively large magnetic field inaccuracies, system noise and model errors should become dominant allowing for temperature precision better than 0.2 K.
The ability to quantitatively measure the nanoparticle temperature in the presence of a static field has several advantages over the purely alternating field technique. The second harmonic is larger on average than the third just as the fourth is larger than the fifth. Temperature can be estimated using several ratios while avoiding those which contain extrema. Static fields will also cause varied attenuation of the harmonics depending on the particle size. This could allow for selective weighting of the temperature measurement for different particles sizes. Such ability could prove useful in the continued study of the mechanisms of magnetic fluid hyperthermia. MPI’s hardware and reconstruction process are still under development, but an ability to produce temperature maps using harmonic ratios in MPI will probably involve strong dc gradients. Further modification of our temperature measurement technique would be required for MPI as the dc field would not be adjustable. Fresh applications for ferrofluids are continually being developed, paving the way for many potential implementations of this technique.
References
- Caizer C. Deviations from Bloch law in the case of surfacted nanoparticles. Appl Phys A. 2005;80:1745–51. [Google Scholar]
- Dietrich O, Reiser M, Schoenberg S. Artifacts in 3-T MRI: physical background and reduction strategies. Eur J Radiol. 2008;65:29. doi: 10.1016/j.ejrad.2007.11.005. [DOI] [PubMed] [Google Scholar]
- Gleich B, Weizenecker J. Tomographic imaging using the nonlinear response of magnetic particles. Nature. 2005;435:1214. doi: 10.1038/nature03808. [DOI] [PubMed] [Google Scholar]
- Meyer M, Krause JH, Hartmann M, Miethe P, Oster J, Keusgen M. Francisella tularensis detection using magnetic labels and a magnetic biosensor based on frequency mixing. J Magn Magn Mater. 2007;311:259. [Google Scholar]
- Nikitin M, Vetoshko P, Brusentosov N, Nikitin P. Highly sensitive room-temperature method of non-invasive in vivo detection of magnetic nanoparticles. J Magn Magn Mater. 2009;321:1658. [Google Scholar]
- Raikher YL, Stepanov VI. Noise-and force-induced resonances of magnetization and orientation in superparamagnetic systems. J Magn Magn Mater. 2002;252:129. [Google Scholar]
- Weaver JB, Rauwerdink AM, Hansen EW. Magnetic nanoparticle temperature estimation. Med Phys. 2009;36:1822. doi: 10.1118/1.3106342. [DOI] [PMC free article] [PubMed] [Google Scholar]
- Weaver JB, Rauwerdink AM, Sullivan CR, Baker I. Frequency distribution of the nanoparticle magnetization in the presence of a static as well as a harmonic magnetic field. Med Phys. 2008;35:1988. doi: 10.1118/1.2903449. [DOI] [PMC free article] [PubMed] [Google Scholar]
- Weizenecker J, Gleich B, Rahmer J, Dahnke H, Borgert J. Three-dimensional real-time in vivo magnetic particle imaging. Phys Med Biol. 2009;54:L1. doi: 10.1088/0031-9155/54/5/L01. [DOI] [PubMed] [Google Scholar]


