

Abstract
The nucleobase adenine has previously been reported to activate G protein-coupled receptors in rat and mouse. Adenine receptors (AdeR) thus constitute a new family of purine receptors, for which the designation “P0-receptors” has been suggested. We now describe the cloning and characterization of two new members of the AdeR family from mouse (MrgA10, termed mAde1R) and hamster (cAdeR). Both receptors were expressed in Sf9 insect cells, and radioligand binding studies were performed using [3H]adenine. Specific binding of the radioligand was detected in transfected, but not in untransfected cells, and KD values of 286 nM (mAde1R, Bmax 1.18 pmol/mg protein) and 301 nM (cAdeR, Bmax 17.7 pmol/mg protein), respectively, were determined. A series of adenine derivatives was investigated in competition binding assays. Minor structural modifications generally led to a reduction or loss of affinity, with one exception: 2-fluoroadenine was at least as potent as adenine itself at the cAdeR. Structure–activity relationships at all AdeR orthologs and subtypes investigated so far were similar, but not identical. For functional analyses, the cAdeR was homologously expressed in Chinese hamster ovary (CHO) cells, while the mAde1R was heterologously expressed in 1321N1 astrocytoma cells. Like the previously described AdeRs from rat (rAdeR) and mouse (mAde2R), the mAde1R (EC50 9.77 nM) and the cAdeR (EC50 51.6 nM) were coupled to inhibition of adenylate cyclase. In addition, the cAdeR from hamster expressed in CHO cells produced an increase in intracellular calcium concentrations (EC50 6.24 nM) and was found to be additionally coupled to Gq proteins.
Keywords: Adenine receptor, G protein-coupled receptor, Sf9 insect cells, Chinese hamster ovary cells, Radioligand binding, Mrg receptor
Introduction
Adenine receptors (AdeR) are G protein-coupled receptors (GPCRs) that are activated by the nucleobase adenine [1–4]. They have been suggested to constitute a third family of purinergic receptors, tentatively designated P0 (P zero) receptors [5]. So far the purine receptor superfamily comprises P1 (nucleoside) receptors, activated by the nucleoside adenosine, and P2 (P2X and P2Y) receptors, activated by nucleotides, such as ATP, ADP, UTP, or UDP [5–8]. The first adenine-activated GPCR (AdeR) was found in rat by a reverse pharmacology approach [2]. A receptor showing the highest expression levels in dorsal root ganglia, specifically in the subset of small neurons, was cloned, and adenine was found to be its endogenous ligand exhibiting nanomolar potency [2]. Due to its expression profile, the AdeR was suggested to play a role in nociception [2]. In fact, later on adenine was shown to enhance nociceptive sensory transmission [9]. Relatively high levels of the rat AdeR were also expressed in brain cortex, hypothalamus, lung, ovaries, kidney, and small intestine [2, 3, 10–12]. Furthermore, adenine was reported to exert neurotrophic and neuroprotective effects in primary cultures of rat Purkinje cells [13, 14].
Although a human AdeR has not been identified yet, adenine may play a signaling role in human pathology as well. In patients with chronic renal failure, plasma adenine concentrations were found to be increased with increasing progress of the disease [15]. Evidence was provided for the expression of Gi protein-coupled adenine receptors in the basolateral membrane of the pig proximal tubule, which blocked Na+-ATPase activity [16]. AdeR expression was detected in rat and mouse kidney using an antibody, and adenine was found to reduce cAMP levels in inner medullary collecting duct sections isolated from rats [17, 18]. Very recently adenine was found to be involved in the differentiation and function of rat hepatic stellate cells, suggesting a role in liver injury and liver fibrosis [19]. Thus, it appears that adenine may function as a general danger signal in many organs and tissues, not only in rodents but also in other species, including humans.
The rat AdeR is encoded by the mas-related gene receptor gene A1 (MrgA1). Mrg receptors constitute a large group of receptors comprising the families MrgA-G, as well as the primate-specific MrgX family. Except for the mouse genome, in which an atypical expansion of the MrgA and C gene families had occurred, most species possess only one gene of each family. Several Mrg receptors have been shown to be activated by (neuro)peptides, such as cortistatin (human and rhesus MrgX2), Bam22 (human and rhesus MrgX1), arginine-phenylalanine (RF) amide peptides, e.g., Phe-Leu-Arg-Phe (FLRF, mouse MrgA1), or Asn-Pro-Ala-Phe (NPAF, mouse MrgA4) [20–22]. The receptor sequences in mouse that are most closely related to the rat AdeR are mMrgA10, previously designated mAde1R [1] (76 % amino acid identity), and mMrgA9 (76 % amino acid identity), previously designated mAde2R [4]. The latter had been isolated from mouse brain and NG108-15 cells and shown to be activated by nanomolar concentrations of adenine [1, 4].
The two AdeRs analyzed to date (rat AdeR, mouse Ade2R) were found to be coupled to the Gi protein-linked signal transduction pathway, leading to inhibition of adenylate cyclase [1–4]. In the present study, we cloned and pharmacologically characterized two additional adenine receptors, one from mouse (mAde1R, mMrgA10) previously predicted to function as an adenine receptor based on bioinformatics studies [2] and one from hamster (Cricetulus griseus), designated cAdeR.
Material and methods
Chemicals and enzymes
All enzymes were obtained from Thermo Scientific (Waltham, MA, USA) or New England Biolabs (Ipswich, MA, USA) unless otherwise noted. The Bac-to-Bac baculovirus expression system and Oregon Green BAPTA-1/AM were obtained from Life Technologies (Darmstadt, Germany). [3H]Adenine (27.2 Ci/mmol) and [5′,8-3H]cAMP (34 Ci/mmol) were purchased from Quotient Bioresearch (Cardiff, UK). Adenine, 1-methyladenine, 2-fluoroadenine, 7-methyladenine, 9-methyladenine, adenosine, and hypoxanthine were obtained from Acros Organics (Geel, Belgium). 8-Amino-adenine (PSB-09032, Pharmaceutical Sciences Bonn) was synthesized in our group [1]. U73122 was obtained from Tocris Bioscience (Bristol, UK). All other reagents were purchased from Roth (Karlsruhe, Germany) or Applichem (Darmstadt, Germany) unless otherwise noted.
Cloning of adenine receptor cDNAs
The mRNA from mouse brain was isolated using the Dynabeads mRNA direct kit. Total RNA of Chinese hamster ovary (CHO) cells was isolated using the Trizol reagent (both kits were from Life Technologies, Darmstadt, Germany). Subsequently, mRNA was reversely transcribed with the Omniscript RT kit (Qiagen, Hilden, Germany). Fragments of each of the receptor cDNAs were amplified using Biomix red (Bioline, Luckenwalde, Germany) or Pyrobest DNA Polymerase (Takara, Saint-Germain-en-Laye, France) and inserted into the pJet1.2 plasmid using the Clonejet PCR cloning kit (Thermo Scientific, Waltham, MA, USA). Two sets of primers were used in PCRs to amplify the mouse receptor DNA (set 1: forward 5′-ATGGGGGAAAGCAGCACCGGTGCAGG-3′ and reverse 5′-GACACTTGATGCCATAAAAAGAC-3′; set 2: forward 5′-GAAGTATTGACATCAGCACCCTG and reverse 5′-CATCATGGCTCTGCTTTGCTTTTTG-3′); two other sets were used for amplifying the Chinese hamster DNA (set 1: forward 5′-ATGGGGGAAAGCAGCACCGGTGCAGG-3′, reverse 5′-CCACGAAGAAGTAAATGATGG-3′; set 2: forward: 5′-GCTGACTTCCTCTTCCTC-3′, reverse 5′-GAGGTCCAGGCAGAGGC-3′). All sequencing reactions were performed by GATC (Konstanz, Germany). For ease of cloning, the whole receptor cDNA was amplified from genomic DNA isolated with the Purelink Genomic DNA Kit (Life Technologies, Darmstadt, Germany) instead of combining the cDNA fragments. Receptor cDNAs were inserted into the pFastBac1 plasmid for expression in insect cells. The mAde1R cDNA (submitted to GenBank, accession no. JN662396) was additionally inserted into the retroviral vector pQCXIN, while the cAdeR cDNA (submitted to GenBank, accession no. KC202822) was inserted in the retroviral vector pLXSN. A mutant of cAdeR with an internal deletion close to the C terminus (Δ321–327, see Fig. 1) was generated by overlap extension PCR in a way similar to that previously described [23]. The extracellular loop of GPCRs determines subtype selectivity and controls efficacy as evidenced by loop exchange studies at A2 adenosine receptors (manuscript submitted for publication). The C-terminal sequence upstream of the sequence to be deleted was gradually added using three consecutive PCR reactions with two overlapping antisense primers.
Fig. 1.

Multiple sequence alignment of the rodent adenine receptors generated using Clustal W. Asterisk identical amino acid residue, colon conserved amino acid substitution, period semi-conserved amino acid substitution. Amino acid residues are given in the one-letter code. Transmembrane domains (TMD) are shaded in gray; the amino acid insertion sequence unique for the cAdeR is highlighted in bold. This sequence is deleted in the cAdeR-Δ321–327 mutant
Expression of adenine receptors in insect cells
DH10Bac Escherichia coli (Life Technologies, Darmstadt, Germany) were transformed with pFastBac plasmids containing adenine receptor cDNA to obtain recombinant bacmid DNA, which was isolated from single white colonies. For transfection 8 × 10⁵Spodoptera frugiperda (Sf9) cells (gift from Prof. Dr. M. Wiese, Pharmaceutical Institute, University of Bonn, Germany) per well were seeded into 6-well plates, each well containing 2 ml of medium without antibiotics. Sf9 insect cells were cultured in Insect Xpress medium (Lonza, Basel, Switzerland) at 27 °C. The bacmid DNA (1 μg) was mixed with medium without antibiotics and incubated with Cellfectin II reagent for 20 min. The transfection mixture was added to the cells. After 4 h of incubation, the medium was replaced with fresh medium containing gentamicin (0.1 mg/ml), and cells were cultured at 27 °C until viral infection was evident (after 5–6 days). The supernatant containing the P1 baculovirus generation was used to produce a high virus titer stock, which then was used to infect cells for protein production. Cells (3.0 × 10⁶/ml) were infected with 50–100 μl virus stock/ml of medium and incubated under constant shaking (150 rpm). After 72 h, cells were harvested and membranes were prepared: Cells were washed twice with phosphate-buffered saline and resuspended in sterile 50 mM Tris buffer (pH 7.4). After homogenization (20 strokes with a Dounce homogenizator), the lysate was centrifuged for 5 min at 200×g. Subsequently, the supernatant was centrifuged for 1 h at 48,000×g, and the membrane pellet was resuspended in sterile 50 mM Tris buffer (pH 7.4). Aliquots were stored at −80 °C until used. The protein concentration was determined by the Bradford method [2].
Expression of adenine receptors in mammalian cells
1321N1 astrocytoma cells (Sigma-Aldrich, München, Germany) were cultured in DMEM medium, while CHO K1 cells (ATCC, CCL-61) were cultured in DMEM/F12 medium (Life Technologies, Darmstadt, Germany) at 37 °C and 5 % (CHO cells), or 10 % (astrocytoma cells) CO2. For both cell lines, the medium was supplemented with 10 % fetal calf serum, 100 U penicillin, and 100 μg/ml streptomycin. 1321N1 astrocytoma cells stably transfected with the mAde1R, and CHO K1 cells stably transfected with cAdeR were generated using a retroviral expression system as previously described [24]. In brief, GP+env AM12 packaging cells were transfected with retroviral vectors containing adenine receptor cDNA. Subsequently produced viruses, which were released into the supernatant, were used to infect mammalian cells. After 48 h, selection for successfully transfected cells was started by adding G418 (800 μg/ml) to the culture medium. After 1 week of selection, the G418 concentration was reduced to 200 μg/ml. Cells were then used for functional assays or to produce membrane preparations according to the procedure described for infected insect cells.
Radioligand binding experiments
Saturation binding assays
For saturation experiments, the radioligand [3H]adenine was used in a concentration range from 0.05 to 2,000 nM with a reduced specific activity of 5.44 Ci/mmol. The final volume of 200 μl contained 50 μl of the test compound (diluted in 10 % DMSO/90 % 50 mM Tris buffer, pH 7.4), 50 μl of radioligand solution, and 50 μl of membrane suspension (protein amounts/vial: mAde1R in Sf9 cells 100 μg, cAdeR in Sf9 insect cells 30 μg, cAdeR in CHO cells 70 μg, untransfected CHO cells 100 μg) both diluted in 50 mM Tris buffer, pH 7.4. The total binding was measured in the absence of test compound, and non-specific binding was determined in the presence of 100 μM adenine. After an incubation time of 1 h at room temperature, the samples were harvested by filtration through GF/B glass fiber filters, followed by three washes with 2 ml of ice-cold autoclaved 50 mM Tris buffer, pH 7.4, each. Radioactivity bound to the filters was determined by liquid scintillation counting starting after at least 6 h of incubation in 2.5 ml of scintillation cocktail (Lumag AG, Basel). Three independent experiments were performed in duplicates.
Competition binding assays
For competition binding experiments, a final volume of 400 μl containing 10 μl of test compound (dissolved in DMSO), 190 μl of sterile 50 mM Tris buffer, pH 7.4, 100 μl [3H]adenine solution (in 50 mM Tris buffer, pH 7.4, final concentration 10 nM), and 100 μl of membrane suspension (in 50 mM Tris buffer, pH 7.4) was used. Protein amounts per vial were 100 μg of mAde1R (expressed in Sf9 cells), 25 μg of cAdeR (expressed in Sf9 cells), 50 μg of cAdeR (expressed in CHO cells), and 100 μg of membrane preparation from untransfected CHO cells. Assays were performed as described for saturation assays. Data were analyzed using Prism 4 (Graphpad, La Jolla, CA, USA).
Determination of intracellular cAMP production
Intracellular cyclic AMP accumulation studies were performed as previously described [4]. In brief, 24 h prior to the assay stably transfected 1321N1 astrocytoma cells expressing the mAde1 receptor were seeded in 24-well plates (Greiner Bio-One, Frickenhausen, Germany; 200,000 cells per well). The culture medium was removed and cells were washed once with 500 μl of 37 °C warm Hank’s balanced salt solution. After adding 400 μl HBSS buffer, the cells were incubated for 2 h at 37 °C and 5 % (CHO), or 10 % (astrocytoma cells) CO2, respectively. In agonist experiments, cAMP production was stimulated by the addition of 3 nM isoproterenol. Buffer or compound solution in buffer (50 μl) and isoproterenol solution in buffer (50 μl) were added. After 10 min reaction was stopped by removing the reaction buffer and adding 500 μl of hot (90 °C) lysis buffer consisting of 4 mM EDTA and 0.01 % Triton X-100 (pH 7.4). cAMP accumulation assays using transfected CHO cells were performed in the same way with minor changes: after washing of the cells 300 μl of HBSS and after 2 h of incubation 50 μl of the phosphodiesterase inhibitor Ro20-1724 (Roche, Basel, Switzerland; final concentration 40 μM) were added. After 10 min 100 μl of test compound (diluted in 10 % DMSO/90 % sterile 50 mM Tris buffer, pH 7.4) and after additional 5 min of incubation 50 μl of forskolin (final concentration 10 μM) were added to the cells. The cAMP amount was quantified by competition radioligand binding studies as previously described [25, 26]. In brief, the final volume of 120 μl contained 50 μl of cell lysate, 30 μl of [3H]cAMP radioligand solution in lysis buffer (final concentration 3 nM), and 40 μl of cAMP binding protein diluted in the same buffer (100 μg per sample). After incubating the samples on ice for 1 h, they were filtered through GF/B glass fiber filters, followed by three washes with 2 ml ice-cold 50 mM Tris buffer, pH 7.4 each. Radioactivity bound to the filter was determined by liquid scintillation counting. Three independent experiments were performed each in triplicates. A cAMP standard curve was measured for each experiment to estimate the amount of cAMP per well. The percentage of isoproterenol- or forskolin-induced cAMP production was plotted on the compound concentration.
Determination of calcium mobilization
Intracellular Ca2+ release experiments were performed as previously described [27]: Transfected cells of two 175-cm2 flask were detached, incubated for 30 min at normal culture conditions, and subsequently spun down at 200×g for 5 min. Pelleted cells were then resuspended in 1 ml of Krebs–HEPES buffer. After 3 μl of a 1-mM Oregon Green BAPTA-1/AM solution (Life Technologies, Darmstadt, Germany) and 3 μl of a 20 % solution of Pluronic F-127 (Sigma-Aldrich, München, Germany) had been added, the cell suspension was incubated in the dark for 1 h on a rotating wheel. Cells were washed twice with Krebs–HEPES buffer and subsequently diluted in 19 ml of the same buffer. One hundred eighty microliters of cell suspension was added into each well of a 96-well plate (black, clear bottom, Greiner Bio-One, Frickenhausen, Germany). Cells were incubated for 20 min under exclusion of light. Using a NOVOstar plate reader (BMG LabTechnologies, Offenburg, Germany), 20 μl of agonist solution was injected sequentially into each well. Fluorescence was measured at 520 nm (excitation 485 nm) for 60 intervals of 0.4 s each. Responses induced by test compounds were normalized to the response produced by 100 μM ATP for CHO cells, or to 100 μM of carbachol for astrocytoma cells. Three independent assays were performed in triplicates. To some samples, pertussis toxin (final concentration 50 ng/ml) was added to the cells 18 h prior to the assay. In a few cases, U73122 (final concentration 5 μM) was added to the cell suspension directly before seeding them into the 96-well plate. Experiments in absence of extracellular calcium were performed using a calcium-free Krebs–HEPES buffer that was supplemented with EGTA (final concentration 100 μM).
Results
Adenine receptor sequences
In rats, the MrgA gene had been found to code for an adenine receptor [2], designated rAdeR [1]. In the present study, we investigated whether its direct ortholog in mice, the MrgA10 gene, also encodes an adenine receptor, the putative mAde1R. In the past, trials to clone this receptor had led to the discovery of another adenine receptor in mice, designated mAde2R [1, 4]. A further goal of the present study was to search for a putative adenine receptor in Chinese hamsters, the cAdeR, with c as an abbreviation for the species C. griseus, because CHO cells had previously been shown to possess endogenous adenine binding sites [4, 28]. To examine expression of adenine receptors, mRNA was isolated from whole mouse brain and from CHO K1 cells. Using the reversely transcribed mRNA as a template, the amplification of whole mAde1R cDNA was challenging because the obtained PCR products were coding for the mAde2R, due to high conservation at the beginning and the end of cDNAs of both receptor subtypes [4]. Thus, primers were designed that anneal to non-conserved regions of the receptor’s cDNA. Due to the fact that the Chinese hamster genome sequence was not published when we started our work, we decided to use primers that anneal to highly conserved regions which can be found in any adenine receptor cDNA. However, for cDNA from CHO cells, several different mRNA preparations had to be tried because in most cases no or only very little PCR product could be generated. Only upon a second reamplification reaction DNA amounts were sufficient for cloning. With these approaches, we obtained fragments of both receptors’ cDNAs (mAde1R and the putative cAdeR). For ease of cloning, instead of combining fragments, genomic DNA was used in both cases to amplify and clone whole receptor cDNAs. Products yielded were identical in sequence to those amplified using transcribed mRNA (mAde1R: GenBank accession no. JN662396; cAdeR: GenBank accession no. KC202822). The cloned cDNA sequence of the mouse receptor encodes a protein with 332 amino acids, while that of the Chinese hamster encodes a protein of 338 amino acids in length (see Fig. 1 for sequence alignment). Alignment of the known rodent adenine receptor sequences (rAdeR, mAde2R) with the herein identified sequences (mAde1R, cAdeR) showed that the hamster AdeR (cAdeR) showed the highest degree of identity (86 %) to the rat AdeR (rAdeR). Its sequence identity with the mouse AdeRs was 74 % (mAde1R) and 73 % (mAde2R), respectively. The rAdeR showed a similar percentage of sequence identity with both of the mouse receptors (mAde1R, mAde2R), namely 76 %. The two mouse receptors were 81 % identical (see Table 1). The cAdeR contained a non-conserved insertion of seven amino acids near the C terminus (Fig. 1).
Table 1.
Percent identity (similarity) of protein sequences between adenine receptor orthologs and subtypes
| rAdeR, % (%) | mAde1R, % (%) | mAde2R, % (%) | cAdeR, % (%) | |
|---|---|---|---|---|
| rAdeR | 76 (85) | 76 (84) | 86 (91) | |
| mAde1R | 76 (85) | 81 (89) | 74 (84) | |
| mAde2R | 76 (84) | 81 (89) | 73 (82) | |
| cAdeR | 86 (91) | 74 (84) | 73 (82) |
Identity (and similarity) of protein sequences was determined using the pairwise sequence alignment tool EMBOSS Needle
Expression of hamster and mouse adenine receptors
cDNAs coding for both receptors were inserted into the pFastBac1 vector and transferred into bacmids, which were then used to transfect Sf9 insect cells. In radioligand binding assays using [3H]adenine as a radioligand, we could demonstrate that membrane preparation of mock-transfected Sf9 insect cells showed negligible specific [3H]adenine binding, in agreement with previous findings for insect cell membranes [4]. This cell line is therefore suitable for expressing adenine receptors. In contrast, Sf9 insect cells infected with viruses containing the respective receptor cDNA showed high specific binding for [3H]adenine (see Fig. 2). In addition to the expression of both receptors in Sf9 insect cells, 1321N1 astrocytoma cells were retrovirally transfected with the mAde1R cDNA, while the cAdeR was overexpressed in CHO cells using the same transfection method. Additionally, a cAdeR mutant lacking seven amino acids close to its C terminus was generated and expressed in CHO cells.
Fig. 2.

[3H]Adenine binding (10 nM) to membrane preparations of Sf9 insect cells: Protein amounts were 100 μg (untransfected Sf9 cell membranes and Sf9 cell membranes expressing the mAde1R) and 25 μg (Sf9 cells expressing the cAdeR). Data represent means ± SEM of three to nine independent experiments performed in triplicates or in duplicates (cAdeR). Results of a two-tailed t test: ***significantly different p < 0.0001
Radioligand binding studies
Saturation binding experiments were performed to determine KD values for [3H]adenine at the mAde1R and the cAdeR, expressed in Sf9 insect cells, as well as their expression levels. The mAde1R showed a KD value of 286 nM and a Bmax value of 1.18 pmol/mg protein. A similar KD value of 301 nM and a high Bmax value of 17.7 pmol/mg was determined for the cAdeR (Fig. 3; Table 2). Furthermore, we determined the affinity of [3H]adenine at membrane preparations of untransfected CHO cells (KD value 148 nM, Table 2) and at membrane preparations of CHO cells overexpressing the cAdeR (KD value 79.9 nM, Table 2). Both values are not significantly different from each other. The Bmax value determined for untransfected CHO cells (1.58 pmol/mg protein) was much lower than that determined for CHO cells overexpressing the cAdeR (5.62 pmol/mg protein). Selected adenine derivatives were investigated in competition radioligand binding experiments to study structure–activity relationships (Table 3). For the mAde1R, the observed rank order of affinity was as follows: adenine > 2-fluoroadenine ≥ 7-methyladenine > 8-aminoadenine ≥ 1-methyladenine > 9-methyladenine > hypoxanthine > adenosine. At the cAdeR, 2-fluoroadenine was almost 10-fold more potent than at the mAde1R, and the rank order of affinity was somewhat different: 2-fluoroadenine ≥ adenine > 7-methyladenine ≈ 8-aminoadenine > 1-methyladenine > 9-methyladenine > hypoxanthine ≈ adenosine.
Fig. 3.

Saturation binding of [3H]adenine to a mAde1R and b cAdeR recombinantly expressed in Sf9 insect cell membranes. Data points represent means of typical experiments performed in duplicates
Table 2.
Results from [3H]adenine saturation binding experiments
| KD ± SEM (nM) | Bmax ± SEM (pmol/mg protein) | |
|---|---|---|
| mAde1R in Sf9 insect cells | 286 ± 55 | 1.18 ± 0.03 |
| cAdeR in Sf9 insect cells | 301 ± 25 | 17.7 ± 0.7 |
| cAdeR in CHO cells | 79.9 ± 8.0 | 5.62 ± 0.36 |
| Untransfected CHO cellsa | 151 ± 30 | 1.58 ± 0.04 |
For saturation experiments, [3H]adenine (0.05–2,000 nM) was incubated with membrane preparations of the different cell lines. Data represent mean values of three independent experiments performed in duplicates
aData represent mean values of two independent experiments performed in duplicates
Table 3.
Affinities of adenine derivatives at rodent adenine receptors
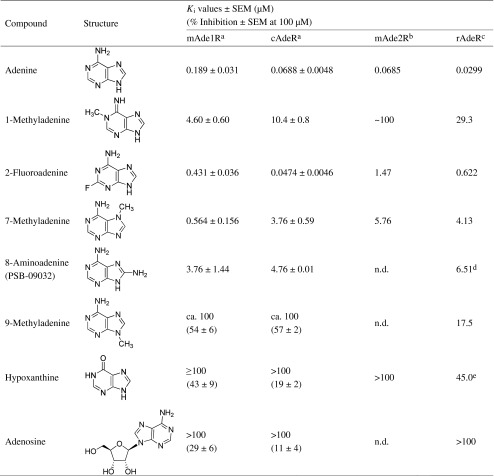
Affinities were determined in competition binding assays using [3H]adenine and membrane preparations from corresponding cell lines. Data are means ± SEM of three to six independent experiments
amAde1R and cAdeR were recombinantly expressed in Sf9 insect cells
bmAde2R was recombinantly expressed in Sf21 insect cells. Ki values had previously been published [4], except for that of hypoxanthine
crAdeR affinities were determined using membrane preparations of rat brain cortex. Ki values were previously published by Gorzalka et al. [3]
dKi values were previously published by Gorzalka et al. [3], except for 8-aminoadenine [1]
eKi values were previously published by Gorzalka et al. [3], except hypoxanthine [28]
Functional experiments
cAMP accumulation experiments were performed using 1321N1 astrocytoma cells transfected with the mAde1R and CHO cells transfected with the cAdeR, respectively. Adenine was able to reduce isoproterenol- and forskolin-induced cAMP production in mAde1R- and cAdeR-transfected cells respectively (EC50 mAde1R 9.77 nM, cAdeR 51.6 nM; Fig. 4; Table 4). In both untransfected cell lines, no effect of adenine could be observed. Moreover, adenine triggered intracellular Ca2+ release in CHO cells transfected with the cAdeR (EC50 6.24 nM; Fig. 5; Table 4). Adenine-induced intracellular Ca2+ release could neither be observed in untransfected CHO cells, nor in 1321N1 astrocytoma cells transfected with the mAde1R (data not shown). To explore whether the observed response in CHO cells overexpressing the cAdeR was completely or partly mediated by Gi proteins, experiments were performed in which the Gi signaling pathway was inhibited by pretreatment of the cells with pertussis toxin (PTX). PTX preincubation resulted in a rightward shift of the curve (from an EC50 value of 6.24 to 128 nM, 21-fold shift; Fig. 5; Table 4). To further investigate the involvement of phospholipase C (PLC), the PLC inhibitor U73122 was added to the cells 20 min before agonist addition. No adenine-induced calcium response could be detected when cells were treated with U73122. In the absence of extracellular calcium, the curve was slightly shifted to the right (EC50 35.9 nM, difference not significant; Fig. 5; Table 4). In order to study whether the inserted amino acids close to the C terminus of the cAdeR played a role in receptor signaling, a corresponding deletion mutant (cAdeR-Δ321–327) was expressed in CHO cells and investigated in adenine-induced Ca2+ mobilization assays. EC50 values determined for adenine at this mutant without and after PTX pretreatment (6.55 nM in the absence and 150 nM after preincubation with PTX; Fig. 5; Table 4) did not significantly differ from those determined for the cAde wild-type receptor.
Fig. 4.

cAMP accumulation assays. Concentration–response curves show mean cAMP accumulation in a 1321N1 astrocytoma cells recombinantly expressing the mAde1R (in percent of maximally accumulated cAMP amounts (∼36 pmol) induced by 3 nM isoproterenol) or in b CHO cells recombinantly expressing cAdeR (in percent of maximally accumulated cAMP amounts (∼33 pmol) induced by 10 μM forskolin) after receptor activation by adenine. Data represent means ± SEM of a three and b four independent experiments, respectively
Table 4.
Potencies of adenine to induce functional responses in transfected cells
| cAMP accumulation assays EC50 ± SEM | Ca2+ mobilization assays | ||
|---|---|---|---|
| Without PTX EC50 ± SEM | With PTX EC50 ± SEM | ||
| mAde1Ra | 9.77 ± 1.77 nM | No effect | n.d. |
| cAdeRb | 51.6 ± 8.6 nM | 6.24 ± 1.01 nM (35.9 ± 15.1 nMc)ns, d | 128 ± 11 nM |
| cAdeR-Δ321–327b | n.d. | 6.55 ± 0.88 nM ns, d | 150 ± 20 nM ns, d |
Data represent means of three to five independent experiments
n.d. not determined, ns not significantly different from wild-type receptor
amAde1R was recombinantly expressed in 1321N1 astrocytoma cells, in which cAMP production was induced by treatment with 3 nM of isoproterenol
bcAdeR and cAdeR-Δ321–327 were recombinantly expressed in CHO K1 cells, in which cAMP production was induced by treatment with 10 μM of forskolin
cAssays were performed in the absence of extracellular calcium
dResults of a two-tailed t test
Fig. 5.

Intracellular Ca2+ release assays in CHO cells recombinantly expressing the cAdeR. The adenine-induced Ca2+-response was studied without and after pretreatment with pertussis toxin (PTX; 50 ng/ml for 18 h) and U73122 (5 μM, or DMSO for control), respectively, and in the absence of extracellular Ca2+ (with EGTA, 100 μM). Data represent means ± SEM of three independent experiments
Discussion
The nucleobase adenine has been reported to be involved in various pathophysiological processes, including pain sensation [2], chronic renal failure [15–18], and possibly in liver injury and fibrosis [19]. Neurotrophic and neuroprotective properties of adenine have been demonstrated in vitro [13, 14, 19]. Bender et al. [2] identified the first G protein-coupled adenine receptor from rat (rAdeR), and the observed pathophysiological adenine effects may be mediated by that receptor or its orthologs. A mouse ortholog of the rAdeR, termed MrgA10, had been identified by sequence comparison, but no proof had been provided for its activation by adenine. Only another mAdeR subtype termed mAde2R had been described and studied so far [4]. We now expressed and characterized this mouse MrgA10 receptor and showed that it is activated by adenine. We therefore propose to designate it mAde1R.
In the past when searching for a suitable expression system to characterize adenine receptors, we discovered that there is an endogenous high affinity binding site for adenine in CHO K1 cells [24]. We concluded that there may be an ortholog in the Chinese hamster genome as well, whose gene product might be responsible for [3H]adenine binding in CHO K1 cells. Therefore, we also cloned and characterized a cDNA from CHO K1 cells by using primers against highly conserved regions found in all adenine receptor cDNAs. Whereas the Ade1 cDNA of mice coded for a protein that consisted of 332 amino acids, the obtained cDNA of the Chinese hamster encoded a protein of 338 amino acids in length (see Fig. 1 for an alignment with the known adenine receptors). The mAde1R and rAdeR protein sequences are 76 % identical while the mAde1R shares 81 % identity with the second subtype mAde2R. The cAdeR was 86 % identical with the rAdeR. Thus, all AdeRs are only moderately homologous, which is typical for GPCRs [29, 30].
When comparing the Mrg families in different species, it becomes apparent that in the mouse genome an atypical expansion of the MrgA and MrgC receptors took place during evolution [31]. Most other species, e.g., rats and hamsters, contain one MrgA and one MrgC gene only, while mice possess at least 22 MrgA and 14 MrgC genes. In both families, MrgA and C, several sequences appear to be pseudogenes [31]. In fact, only one of the MrgC receptors, MrgC11, is a functional receptor [22]. From the evolutionary perspective, the most likely explanation for the development of Mrg receptors is the assumption that from one MrgB and one MrgX ancestor the other Mrg receptors have evolved. The MrgX receptor gave rise to the Mrg families A and C, while the MrgX receptor itself was lost during evolution by several rounds of unequal cross-over events in the rodent lineage, while it rapidly expanded to four MrgX receptors in the primate lineage [22]. This can also explain why no direct orthologs of the MrgA receptors can be found in humans. It is interesting to mention that MrgA and C receptors are found in A-A-C clusters, which can roughly account for the numbers of MrgA and C genes found in the mouse genome. In support of this hypothesis is the fact that MrgA and C receptors are more closely related to the primate MrgX receptors than to the mouse MrgB receptors [31]. The Mrg receptors have most likely evolved by positive selection, and the restricted expression profile in sensory neurons which is found among all Mrg receptors further supports the idea of rapid evolution [20].
Insect cells have been found to constitute a suitable expression system for adenine receptors, since they have no endogenous adenine binding sites [4]. This is why we expressed both receptor orthologs in Sf9 insect cells and tested cell membrane preparations for [3H]adenine binding. We could observe high specific [3H]adenine binding at both receptors (Fig. 2). In saturation binding studies, similar KD values of 286 nM for the mouse and 301 nM for the Chinese hamster receptor were observed, while the affinity of [3H]adenine for mAde2R had been determined to be roughly in the same range with a KD value of 113 nM [4]. Thus, all adenine receptors expressed in insect cells so far showed similar affinities for adenine.
Insect cells are lacking suitable G proteins for mammalian GPCR signal transduction [32]. Therefore, the determined KD values represent adenine affinities for the non-activated low-affinity state (for agonists) of the receptors. Thus, we additionally transfected mammalian cell lines with the corresponding cDNAs to determine receptor activation by adenine. The mAde1R was expressed in 1321N1 astrocytoma cells, which lack functional response to adenine at the applied concentrations (up to 10 μM) [4]. In cAMP accumulation assays, we could show that adenine reduced isoproterenol-induced cAMP accumulation in 1321N1 astrocytoma cells recombinantly expressing the mAde1R with an EC50 value of 9.77 nM but failed to do so in untransfected cells. In addition to cAMP accumulation assays, Ca2+ mobilization assays were performed. Adenine failed to induce a Ca2+ response in 1321N1 astrocytoma cells recombinantly expressing the mAde1R. For the rAde1 recombinantly expressed in CHO [2] or 1321N1 astrocytoma cells [1] and for the mAde2R expressed in 1321N1 astrocytoma cells [4], only Gi but not Gq protein-coupling had been described, which is in agreement with the present results for the mAde1 and the cAdeR.
In CHO K1 cells, one would expect to observe a response to adenine in functional assays, due to endogenous high-affinity adenine binding sites in the cells [4]. Nevertheless, we expressed the cAdeR homologously in CHO K1 cells, since any adenine signal should originate from the same receptor either expressed endogenously, or recombinantly overexpressed. To test whether there was a significant overexpression of the cAdeR compared to the expression of the endogenous adenine binding site, we performed saturation experiments. In fact, we could observe a 4fold increase in binding capacity for [3H]adenine when CHO cells were transfected with cAdeR cDNA (Bmax of untransfected CHO cells, 1.58 pmol/mg protein; Bmax of CHO cells recombinantly expressing cAdeR, 5.62 pmol/mg protein). The determined KD values in untransfected CHO cells (151 nM) and CHO cells expressing the cAdeR1 (79.9 nM) were not significantly different. The cAdeR expressed in CHO cells showed a nearly 4-fold higher affinity compared to the same receptor expressed in Sf9 cells (KD 301 nM). The differences in affinity in both expression systems can be explained by the lack of suitable G proteins in Sf9 cells and the presence of these G proteins in CHO cells, which allosterically modulate the receptors. GPCRs have been shown to bind agonists with higher affinity when G proteins are present [32] because they can form a ternary complex with GPCRs, thus inducing an active conformation. In this state, the receptor’s affinity for agonists is maximally increased [32].
Adenine was able to reduce forskolin-induced cAMP accumulation in CHO cells overexpressing cAdeRs in a concentration-dependent manner (EC50 51.6 nM; Fig. 4; Table 4). Surprisingly, in native CHO cells, no such response could be observed (up to adenine concentrations of 10 μM, data not shown). This could imply that the adenine binding site detected in CHO cells does not correspond to the cAdeR. This is in agreement with our finding that the mRNA expression of the cAdeR appeared to be very low in CHO cells, and in some mRNA preparations, it could not be detected at all (data not shown). Altogether, our results indicate that the observed effects in the cAdeR-transfected CHO cells are receptor-dependent and mediated by Gi protein coupling.
Surprisingly, for CHO cells recombinantly expressing cAdeRs, we could find that adenine was able to induce Ca2+ signals at very low concentrations (EC50 6.24 nM), which was not the case for untransfected cells (data not shown). Since at about 100 nM of adenine a step in the concentration–response curve could be observed (Fig. 5), we investigated whether this effect was due to the fact that the Ca2+ response was not mediated by a single signaling pathway (e.g., by Gqα and by Giβγ activating PLC [33]). Therefore, we added PTX to the cells 18 h prior to the assay and observed that the concentration-response curve was significantly shifted to the right (EC50 128 nM). This means that the Ca2+ response is on the one hand mediated by Gi coupling because inhibition of the Gi protein with PTX led to a loss of the high potency signal. On the other hand, adenine also caused a Ca2+ signal with a somewhat lower potency mediated by Gq protein coupling. This portion of the calcium signal was still observed after inhibiting Gi proteins with PTX. While the EC50 value of untreated cells represents a mix of responses mediated by both Gi and Gq proteins, the EC50 of PTX-treated cells represents the effect of adenine mediated by Gq coupling. We could show that both pathways (initiated by Gi and Gq proteins) mediate Ca2+ mobilization by activation of PLC since treatment with the PLC inhibitor U73122 resulted in the abolishment of Ca2+ signaling. Furthermore, we examined whether Ca2+ was mobilized from intracellular stores, or calcium influx contributed to the observed signals. Therefore, we performed Ca2+ mobilization assays in the absence of extracellular Ca2+. Under these conditions, the concentration–response curve of adenine appeared to be somewhat shifted to the right; however, efficacy was not affected, and the shift was not significant. The rightward shift of the curve might be due to a contribution of Ca2+ influx. The underlying mechanism appeared to be dependent on PLC activation. Thus, the Ca2+ channel in question might be receptor-regulated, possibly mediated by PKC as previously described for the TRPV4 channel [34]. On the other hand, absence of extracellular Ca2+ is highly stressful for cells. Therefore, cells were not kept under optimal conditions which could also be a reason for the non-significant shift in potency observed in the absence of extracellular Ca2+.
Ca2+ signaling appears to be a unique property of the cAdeR in comparison to other rodent adenine receptors. We subsequently wanted to test whether Ca2+ signaling is mediated by the seven amino acid insertion close to its C terminus, which is also a unique feature of this receptor. Therefore, we created a mutant lacking this sequence insertion called cAdeR-Δ321–327. However, no significant difference of pharmacological properties regarding Ca2+ mobilization in comparison to the wild-type receptors could be observed (Table 4). The cAdeR’s apparently unique coupling to Gq proteins can therefore not be this easily explained and could be due to other differences in the receptors’ protein sequence. On the other hand, receptor coupling might also be dependent on the expression system used, i.e., CHO cells. Very recently, adenine-induced elevation of the cytosolic calcium concentration was described to occur in rat hepatic stellate cells [19] and may therefore be a more common signaling pathway for AdeRs.
To further pharmacologically characterize both adenine receptors, a series of selected adenine derivatives was tested in competition binding assays versus [3H]adenine (10 nM). As a general observation, adenine showed the highest affinity of the tested compounds at both receptors except for 2-fluoroadenine at the cAdeR, which was about equally potent or had a slightly higher affinity (Table 3). Both adenosine and hypoxanthine did not bind to mAde1R or cAdeR, as previously observed for the other AdeRs (rAdeR, mAde2R) as well, thus proving that the investigated binding sites were neither adenosine receptors nor nucleoside or nucleobase transporters [28, 35, 36]. Although it was not surprising that a bulky residue like the ribose moiety in adenosine abolished affinity, smaller modifications as in 9-methyladenine also led to a strong reduction in affinity at both mAde1R and cAdeR. This indicates that any substitution at the adenine molecule in the 9-position may not be tolerated. If adenine was substituted with a methyl moiety in position 1, the compound showed a strong reduction in affinity at both AdeRs (24- and 150-fold at mAde1R and cAdeR, respectively). This could be due to a sterical blockade or could in part be explained by the altered spatial arrangement of the hydrogen atom belonging to the imine in position 6. It is evident that the amino group in this position is essential for binding when the affinity of adenine is compared to that of hypoxanthine because it likely serves as a hydrogen bond donor in the interaction with the AdeRs. An unsubstituted N1 appears to be required as a hydrogen bond acceptor. For 1-methyladenine and 7-methyladenine, distinct binding properties at mAde1R and cAdeR could be observed: For both compounds, a far stronger affinity reduction was observed at the mAde1R compared to the cAdeR. The addition of an amino group in position 8 of adenine (in PSB-09032) resulted in a 20- and 70-fold affinity reduction at the mAde1R and the cAdeR, respectively. While this could be observed for all rodent receptors, the adenine binding site in human embryonic kidney (HEK293) cells showed an increased affinity for this compound compared to adenine (Ki HEK293 34.1 nM) [1]. Differences in affinity like this are not surprising because one would expect a possible human adenine receptor to show a lower degree of homology compared to the rodent receptors than observed among the rodent orthologs, since the family of MrgA receptors is not conserved in humans. 2-Fluoroadenine showed an only 2-fold decrease in affinity at the mAde1R and surprisingly a moderate increase (2-fold) in affinity at the cAdeR in comparison to adenine. This could mean that a weaker partially negative charge in the 2-position of the heterocycle is beneficial for binding to the cAdeR, but not for binding to mAde1R. Although a few differences can be found, common structure–activity relationships are evident for the whole class of adenine receptors, e.g., the fact that substitutions at any position of the adenine molecule (except for C2) leads to a decrease in affinity, rendering the physiological adenine itself to be the most potent compounds at adenine receptors so far.
In conclusion, we could identify two new rodent adenine receptors: one in mice, which we termed mAde1R, and one in Chinese hamsters, designated cAdeR. We could show that both of them are coupled to Gi proteins, while the cAdeR can be additionally coupled to Gq proteins when expressed in CHO cells, thereby increasing intracellular calcium concentrations. Structure–activity relationships were similar, but not identical at all rodent AdeRs described so far. In general, most alterations of the adenine molecule are not well tolerated by any of the known adenine receptors. Our results provide important new insights into the so far scarcely investigated family of P0 purine receptors.
Acknowledgments
D.T., M.K., A.C.S., and C.E.M. were supported by the Ministry for Innovation, Science, Research and Technology of the State of Northrhine-Westfalia (NRW International Research Graduate School BIOTECH-PHARMA and NRW International Graduate Research School Chemical Biology). We would like to thank Linda Hammerich for skillful support in cloning the mAde1R sequence.
Footnotes
Dominik Thimm and Melanie Knospe contributed equally to this work
References
- 1.Borrmann T, Abdelrahman A, Volpini R, Lambertucci C, Alksnis E, Gorzalka S, Knospe M, Schiedel AC, Cristalli G, Müller CE. Structure–activity relationships of adenine and deazaadenine derivatives as ligands for adenine receptors, a new purinergic receptor family. J Med Chem. 2009;52:5974–5989. doi: 10.1021/jm9006356. [DOI] [PubMed] [Google Scholar]
- 2.Bender E, Buist A, Jurzak M, Langlois X, Baggerman G, Verhasselt P, Ercken M, Guo HQ, Wintmolders C, Van den Wyngaert I, Van Oers I, Schoofs L, Luyten W. Characterization of an orphan G protein-coupled receptor localized in the dorsal root ganglia reveals adenine as a signaling molecule. Proc Natl Acad Sci USA. 2002;99:8573–8578. doi: 10.1073/pnas.122016499. [DOI] [PMC free article] [PubMed] [Google Scholar]
- 3.Gorzalka S, Vittori S, Volpini R, Cristalli G, von Kügelgen I, Müller CE. Evidence for the functional expression and pharmacological characterization of adenine receptors in native cells and tissues. Mol Pharmacol. 2005;67:955–964. doi: 10.1124/mol.104.006601. [DOI] [PubMed] [Google Scholar]
- 4.von Kügelgen I, Schiedel AC, Hoffmann K, Alsdorf BB, Abdelrahman A, Müller CE. Cloning and functional expression of a novel Gi protein-coupled receptor for adenine from mouse brain. Mol Pharmacol. 2008;73:469–477. doi: 10.1124/mol.107.037069. [DOI] [PubMed] [Google Scholar]
- 5.Brunschweiger A, Müller CE. P2 receptors activated by uracil nucleotides—an update. Curr Med Chem. 2006;13:289–312. doi: 10.2174/092986706775476052. [DOI] [PubMed] [Google Scholar]
- 6.Burnstock G. Purine and pyrimidine receptors. Cell Mol Life Sci S. 2007;64:1471–1483. doi: 10.1007/s00018-007-6497-0. [DOI] [PMC free article] [PubMed] [Google Scholar]
- 7.Fredholm BB, IJzerman AP, Jacobson KA, Linden J, Müller CE. International Union of Basic and Clinical Pharmacology. LXXXI. Nomenclature and classification of adenosine receptors—an update. Pharmacol Rev. 2011;63:1–34. doi: 10.1124/pr.110.003285. [DOI] [PMC free article] [PubMed] [Google Scholar]
- 8.Jacobson KA, Gao ZG. Adenosine receptors as therapeutic targets. Nat Rev Drug Discov. 2006;5:247–264. doi: 10.1038/nrd1983. [DOI] [PMC free article] [PubMed] [Google Scholar]
- 9.Matthews EA, Dickenson AH. Effects of spinally administered adenine on dorsal horn neuronal responses in a rat model of inflammation. Neurosci Lett. 2004;356:211–214. doi: 10.1016/j.neulet.2003.11.057. [DOI] [PubMed] [Google Scholar]
- 10.Watanabe S, Ikekita M, Nakata H. Identification of specific [3H]adenine-binding sites in rat brain membranes. J Biochem (Tokyo) 2005;137:323–329. doi: 10.1093/jb/mvi035. [DOI] [PubMed] [Google Scholar]
- 11.Sichardt K, Nieber K. Function of adenine receptors and interactions with adenosine A1 receptors in the rat cingulate cortex. Purinergic Signal. 2008;4(Suppl 1):1–210. [Google Scholar]
- 12.Berger F, Sichardt K, Borrmann T, Müller CE, Nieber K. Functional characterisation of adenine and the new adenine receptor ligands PSB-09073 and PSB-08162 in the rat cingulate cortex. Purinergic Signal. 2010;4(Suppl 5):S44. [Google Scholar]
- 13.Watanabe S, Yoshimi Y, Ikekita M. Neuroprotective effect of adenine on Purkinje cell survival in rat cerebellar primary cultures. J Neurosci Res. 2003;74:754–759. doi: 10.1002/jnr.10790. [DOI] [PubMed] [Google Scholar]
- 14.Yoshimi Y, Watanabe S, Shinomiya T, Makino A, Toyoda M, Ikekita M. Nucleobase adenine as a trophic factor acting on Purkinje cells. Brain Res. 2003;991:113–122. doi: 10.1016/j.brainres.2003.08.017. [DOI] [PubMed] [Google Scholar]
- 15.Slominska EM, Szolkiewicz M, Smolenski RT, Rutkowski B, Swierczynski J. High plasma adenine concentration in chronic renal failure and its relation to erythrocyte ATP. Nephron. 2002;91:286–291. doi: 10.1159/000058406. [DOI] [PubMed] [Google Scholar]
- 16.Wengert M, Adao-Novaes J, Assaife-Lopes N, Leao-Ferreira LR, Caruso-Neves C. Adenine-induced inhibition of Na+-ATPase activity: evidence for involvement of the Gi protein-coupled receptor in the cAMP signaling pathway. Arch Biochem Biophys. 2007;467:261–267. doi: 10.1016/j.abb.2007.08.018. [DOI] [PubMed] [Google Scholar]
- 17.Kishore BK, Zhang Y, Pop IL, Gevorgyan H, Müller CM, Peti-Peterdi J. Cellular localization of P0 (adenine) receptor in rat kidney. FASEB J. 2012;26:688.683. [Google Scholar]
- 18.Peti-Peterdi J, Zhang Y, Gevorgyan A, Kohan DE, Müller CM, Kishore BK. Functional expression of P0 (adenine) receptor in the collecting duct of intercalated cells in rat and mouse. J Am Soc Nephrol. 2012;23:611A. [Google Scholar]
- 19.Watanabe A, Sohail MA, Gautam S, Gomes DA, Mehal WZ. Adenine induces differentiation of rat hepatic stellate cells. Dig Dis Sci. 2012;57:2371–2378. doi: 10.1007/s10620-012-2183-7. [DOI] [PMC free article] [PubMed] [Google Scholar]
- 20.Dong X, Han S, Zylka MJ, Simon MI, Anderson DJ. A diverse family of GPCRs expressed in specific subsets of nociceptive sensory neurons. Cell. 2001;106:619–632. doi: 10.1016/S0092-8674(01)00483-4. [DOI] [PubMed] [Google Scholar]
- 21.Burstein ES, Ott TR, Feddock M, Ma JN, Fuhs S, Wong S, Schiffer HH, Brann MR, Nash NR. Characterization of the Mas-related gene family: structural and functional conservation of human and rhesus MrgX receptors. Br J Pharmacol. 2006;147:73–82. doi: 10.1038/sj.bjp.0706448. [DOI] [PMC free article] [PubMed] [Google Scholar]
- 22.Han SK, Dong X, Hwang JI, Zylka MJ, Anderson DJ, Simon MI. Orphan G protein-coupled receptors MrgA1 and MrgC11 are distinctively activated by RF-amide-related peptides through the Gαq/11 pathway. Proc Natl Acad Sci U S A. 2002;99:14740–14745. doi: 10.1073/pnas.192565799. [DOI] [PMC free article] [PubMed] [Google Scholar]
- 23.Seibt BF, Schiedel AC, Thimm D, Hinz S, Sherbiny FF, Müller CE (2013) The second extracellular loop of GPCRs determines subtype-selectivity and controls efficacy as evidenced by loop exchange studies at A2 adenosine receptors. Biochem Pharmacol 85:1317–1329 [DOI] [PubMed]
- 24.Schiedel AC, Hinz S, Thimm D, Sherbiny F, Borrmann T, Maaß A, Müller CE. The four cysteine residues in the second extracellular loop of the human adenosine A2B receptor: role in ligand binding and receptor function. Biochem Pharmacol. 2011;82:389–399. doi: 10.1016/j.bcp.2011.05.008. [DOI] [PubMed] [Google Scholar]
- 25.Nordstedt C, Fredholm BB. A modification of a protein-binding method for rapid quantification of cAMP in cell-culture supernatants and body fluid. Anal Biochem. 1990;189:231–234. doi: 10.1016/0003-2697(90)90113-N. [DOI] [PubMed] [Google Scholar]
- 26.Rempel V, Volz N, Hinz S, Karcz T, Meliciani I, Nieger M, Wenzel W, Bräse S, Müller CE. 7-Alkyl-3-benzylcoumarins: a versatile scaffold for the development of potent and selective cannabinoid receptor agonists and antagonists. J Med Chem. 2012;55:7967–7977. doi: 10.1021/jm3008213. [DOI] [PubMed] [Google Scholar]
- 27.Hillmann P, Ko GY, Spinrath A, Raulf A, von Kügelgen I, Wolff SC, Nicholas RA, Kostenis E, Höltje HD, Müller CE. Key determinants of nucleotide-activated G protein-coupled P2Y2 receptor function revealed by chemical and pharmacological experiments, mutagenesis and homology modeling. J Med Chem. 2009;52:2762–2775. doi: 10.1021/jm801442p. [DOI] [PubMed] [Google Scholar]
- 28.Schiedel AC, Meyer H, Alsdorf BB, Gorzalka S, Brüssel H, Müller CE. [3H] Adenine is a suitable radioligand for the labeling of G protein-coupled adenine receptors but shows high affinity to bacterial contaminations in buffer solutions. Purinergic Signal. 2007;3:347–358. doi: 10.1007/s11302-007-9060-4. [DOI] [PMC free article] [PubMed] [Google Scholar]
- 29.Gloriam DE, Fredriksson R, Schiöth HB. The G protein-coupled receptor subset of the rat genome. BMC Genomics. 2007;8:338. doi: 10.1186/1471-2164-8-338. [DOI] [PMC free article] [PubMed] [Google Scholar]
- 30.Strotmann R, Schrock K, Boselt I, Staubert C, Russ A, Schöneberg T. Evolution of GPCR: change and continuity. Mol Cell Endocrinol. 2011;331:170–178. doi: 10.1016/j.mce.2010.07.012. [DOI] [PubMed] [Google Scholar]
- 31.Zylka MJ, Dong X, Southwell AL, Anderson DJ. Atypical expansion in mice of the sensory neuron-specific Mrg G protein-coupled receptor family. Proc Natl Acad Sci U S A. 2003;100:10043–10048. doi: 10.1073/pnas.1732949100. [DOI] [PMC free article] [PubMed] [Google Scholar]
- 32.Schneider EH, Seifert R. Sf9 cells: a versatile model system to investigate the pharmacological properties of G protein-coupled receptors. Pharmacol Ther. 2010;128:387–418. doi: 10.1016/j.pharmthera.2010.07.005. [DOI] [PubMed] [Google Scholar]
- 33.Clapham DE, Neer EJ. G protein βγ subunits. Annu Rev Pharmacol Toxicol. 1997;37:167–203. doi: 10.1146/annurev.pharmtox.37.1.167. [DOI] [PubMed] [Google Scholar]
- 34.Adapala RK, Talasila PK, Bratz IN, Zhang DX, Suzuki M, Meszaros JG, Thodeti CK. PKCα mediates acetylcholine-induced activation of TRPV4-dependent calcium influx in endothelial cells. Am J Physiol Heart Circ Physiol. 2011;301:757–765. doi: 10.1152/ajpheart.00142.2011. [DOI] [PMC free article] [PubMed] [Google Scholar]
- 35.Köse M, Schiedel AC. Nucleoside/nucleobase transporters: drug targets of the future? Future Med Chem. 2009;1:303–326. doi: 10.4155/fmc.09.29. [DOI] [PubMed] [Google Scholar]
- 36.Yao SY, Ng AM, Cass CE, Baldwin SA, Young JD. Nucleobase transport by human equilibrative nucleoside transporter 1 (hENT1) J Biol Chem. 2011;286:32552–32562. doi: 10.1074/jbc.M111.236117. [DOI] [PMC free article] [PubMed] [Google Scholar]