

Abstract
The rat adenine receptor (rAdeR) was the first member of a family of G protein-coupled receptors (GPCRs) activated by adenine and designated as P0-purine receptors. The present study aimed at gaining insights into structural aspects of ligand binding and function of the rAdeR. We exchanged amino acid residues predicted to be involved in ligand binding (Phe1103.24, Asn1153.29, Asn1734.60, Phe17945.39, Asn1945.40, Phe1955.41, Leu2015.47, His2526.54, and Tyr2687.32) for alanine and expressed them in Spodoptera frugiperda (Sf9) insect cells. Membrane preparations subjected to [3H]adenine binding studies revealed only minor effects indicating that none of the exchanged amino acids is part of the ligand binding pocket, at least in the inactive state of the receptor. Furthermore, we coexpressed the rAdeR and its mutants with mammalian Gi proteins in Sf9 insect cells to probe receptor activation. Two amino acid residues, Asn1945.40 and Leu2015.47, were found to be crucial for activation since their alanine mutants did not respond to adenine. Moreover we showed that—in contrast to most other rhodopsin-like GPCRs—the rAdeR does not contain essential disulfide bonds since preincubation with dithiothreitol neither altered adenine binding in Sf9 cell membranes, nor adenine-induced inhibition of adenylate cyclase in 1321N1 astrocytoma cells transfected with the rAdeR. To detect rAdeRs by Western blot analysis, we developed a specific antibody. Finally, we were able to show that the extended N-terminal sequence of the rAdeR constitutes a putative signal peptide of unknown function that is cleaved off in the mature receptor. Our results provide important insights into this new, poorly investigated family of purinergic receptors.
Electronic supplementary material
The online version of this article (doi:10.1007/s11302-013-9355-6) contains supplementary material, which is available to authorized users.
Keywords: Antibody, G protein-coupled receptor, Mutagenesis, Radioligand binding, Rat adenine receptor, Sf9 cells, Signal peptide
Introduction
Nucleotides and nucleosides, such as ATP, ADP, and adenosine, have long been known to act as signaling molecules that activate purinergic membrane receptors. They are subdivided into two families, the adenosine-activated P1 receptors and the nucleotide-activated P2 receptors [1]. The nucleobase adenine has recently been found to be a signaling molecule as well and was identified as the endogenous ligand of the Mas-related gene receptor A (MrgA) from rat, now designated rat adenine receptor (rAdeR) [2]. Meanwhile, two mouse AdeRs (mAde1R and mAde2R) have been identified and characterized, which are activated by adenine in nanomolar concentrations [3].1 Furthermore, an AdeR ortholog of the Chinese hamster (cAdeR) has also been cloned and characterized.1 This new family of adenine receptors has been suggested to be named P0 (or P zero) receptors in analogy to the other two purinergic receptor families P1 and P2 [4]. AdeRs belong to the rhodopsin-like class A G protein-coupled receptor (GPCR) family. They have been shown to be Gi protein-coupled, leading to the inhibition of adenylate cyclase [2, 3, 5, 6].1 Additional coupling to Gq proteins has recently been demonstrated for the hamster AdeR (cAdeR) when homologously expressed in Chinese hamster ovary (CHO) cells.1
The rat AdeR is highly expressed in small diameter neurons of dorsal root ganglia and can also be detected in the brain cortex, hypothalamus, lung, ovaries, kidneys, and small intestine [2]. Adenine applied to the spinal cord of rats exhibited proalgesic effects [7]. Moreover, adenine has been shown to exert neuroprotective effects on Purkinje cells in primary cultures of rat cerebellum [8, 9]. The rAdeR has also been implicated in the differentiation of hepatic stellate cells by modulation of intracellular calcium concentrations, suggesting a protective role for AdeRs in liver inflammation and fibrosis [10]. Furthermore, the expression of AdeRs was demonstrated in rat and mouse kidney and adenine was shown to reduce cAMP levels in sections of isolated inner medullary collecting ducts of rats [11, 12].
Recently, evidence for the existence of functional G protein-coupled adenine receptors in non-rodent species has emerged. Adenine was found to inhibit Na+-ATPase in the pig kidney via a Gi protein-coupled receptor expressed in the basolateral membranes of the proximal tubules [13]. High-affinity binding sites for and functional responses to adenine have been detected in human tissues and cell lines, e.g., in human embryonic kidney cells (HEK293) [5, 6]. In patients with chronic renal failure, elevated adenine concentrations were measured, which increased with the progression of the disease [14], indicating a potential role for adenine as a signaling molecule in the human kidney as well. However, sequence analyses have not led to the identification of a direct human ortholog of the rAdeR [2]. Although human GPCR(s) for adenine appear to exist, their molecular identity cannot be easily identified by a bioinformatics approach.
In the present study, we used the rAdeR in order to obtain insight into ligand binding and receptor activation of this newly identified family of adenine-activated GPCRs. Based on a homology model of the rAdeR previously published by Heo et al. [15], and a refined model developed in our group, we replaced the amino acid residues predicted to be involved in adenine binding by alanine. The mutant receptors were subsequently analyzed in radioligand binding and functional studies in comparison to the wt receptor. Moreover, we studied the importance of potential extracellular disulfide bonds and investigated the possibility of the rat AdeR to possess an N-terminal signal peptide.
Materials and methods
Enzymes and radioligands
All enzymes were obtained from Fermentas (St. Leon-Rot, Germany) or New England Biolabs (Ipswich, MA, USA). [3H]Adenine (27.2 Ci/mmol) and [35S]guanosine 5′-(γ-thio)triphosphate (1,250 Ci/mmol) were obtained from Quotient Bioresearch (Cardiff, UK).
Antibodies
A rat adenine receptor (rAdeR)-specific polyclonal antibody was raised against the amino acid sequence 323–331 at the C-terminus. The peptide corresponding to the C-terminus was coupled to keyhole-limpet hemocyanin via the succinimidyl-4-(N-maleimidomethyl)-cyclohexane-1-carboxylate crosslinker (Thermo Scientific, Huntsville, AL, USA) and injected intradermally into rabbits using 200 μg/treatment. Four injections were performed before serum collection. To gain better specificity, additional antibodies were raised against the following peptides: 28–43 (N-term), 181–194 (extracellular loop 2 (ECL2)), 222–235 (intracellular loop 3 (ICL3)), 295–314 (C-terminal), and 313–331 (C-terminal). These antibodies were produced in two rabbits each by Thermo Scientific. The most specific antibody, rAdeR-313–331, was used for further experiments. The hybridoma cells producing the monoclonal anti-c-myc 9E10 antibody (myc: myelocytomatosis, MYC 1-9E10.2, ATCC: CRL-1729) were a gift from Prof. Dr. M. Gütschow (Pharmaceutical Institute, University of Bonn, Germany). The polyclonal antibodies against the mammalian G protein subunits Gαi1/i2 and Gγ2 were obtained from Calbiochem (La Jolla, CA, USA). The horseradish peroxidase-coupled secondary antibodies against mouse and rabbit were obtained from Jackson ImmunoResearch (West Grove, PA, USA).
Mutagenesis and cloning
The coding sequence of the rAdeR (GenBank accession no. AJ311952) used for the mutagenesis studies was cloned into the pUC19 vector and subcloned into the pFastBac1 vector (Invitrogen, Karlsruhe) after mutagenesis. Site-directed mutagenesis was performed as previously described [16]. In brief, complementary primers with the desired base exchanges were designed. Mismatches were flanked on both sides, 3′ and 5′ by 15 to 20 nucleotides. The PCR samples containing 20 ng of template DNA, 15 pmol of each primer, 1× Thermopol reaction buffer, and 1 U VentR polymerase (New England Biolabs, Frankfurt, Germany) were incubated for 20 cycles (1 min at 94 °C, 1 min at 66 °C, 10 min at 72 °C), followed by 10 min at 72 °C as final elongation step. The final PCR products were digested with DpnI and transformed into Escherichia coli Top10 bacteria. Plasmid DNA was isolated and sequenced (GATC, Konstanz, Germany). The N-terminal deletion mutant (rAde∆N) which is 27 amino acid residues shorter than the wild-type receptor was generated by PCR cloning using the following primers: f-myc-rAdeΔN (gagacggaattcaaaatggaacaaaaactcatctcagaag), f-rAdeΔN (gagacggaattccaatggacaaaaccatacctggaag), and r-rAde (gcatattctcgagtcacggctccaccttgctgc). The PCR products were also cloned into the pFastBacTM1 vector.
Protein expression in Sf9 insect cells and membrane preparation
The Bac-to-Bac® baculovirus expression system from Invitrogen (Darmstadt, Germany) was used to generate recombinant baculoviruses in Spodoptera frugiperda (Sf9 cells were a gift from Prof. Dr. M. Wiese, Pharmaceutical Institute, University of Bonn, Germany). Baculoviruses containing cDNA for the human Gαi2 protein subunit [17] were donated from Professor Alfred G. Gilman (University of Texas Medical Center, Dallas, TX, USA), and baculoviruses containing cDNAs for the human Gβ1 and bovine Gγ2 subunits [18] were provided by Prof. Dr. Peter Gierschik (Institute of Pharmacology, University of Ulm). Cells were cultured at 27 °C in Insect Xpress media (Lonza Group, Basel, Switzerland) containing 0.1 mg/ml of gentamicin. After initial transfection, recombinant baculoviruses were produced, which were subsequently used for infecting Sf9 cells. In brief, the plasmid construct was transformed into DH10Bac™ Escherichia coli to obtain recombinant bacmid DNA which was isolated from single white colonies. For transfection, 8 × 10⁵ Sf9 cells per well were seeded into six-well plates containing 2 ml of medium without antibiotics. Bacmid DNA (1 μg) was mixed with medium without antibiotics and incubated with Cellfectin® II reagent for 20 min. The transfection mixture was added drop-wise to the cells. After 4 h, the DNA lipid mixture was replaced by Insect Xpress medium containing gentamicin, and cells were cultured at 27 °C until signs of viral infection were seen, usually after 5–6 days. The supernatant, containing the P1 virus generation, was used to produce a high virus titer stock, which was then used to infect cells for protein production. Cells (3 × 10⁶ per ml) were infected with 5–10 μl/ml of virus stocks (Gi protein subunits) or 50–100 μl/ml (rAdeR), respectively, and incubated in suspension under constant shaking (150 rpm). After 72 h, cells were harvested and membranes were prepared. Cells were washed twice with PBS and resuspended in 50 mM Tris–HCl buffer (pH 7.4). After homogenization (20 strokes with a Dounce homogenizer), nuclei and unbroken cells were removed by centrifugation for 5 min at 200 × g. The supernatant was centrifuged for 1 h at 48,000 × g, and the membrane pellet was resuspended in 50 mM Tris–HCl buffer (pH 7.4). Aliquots were stored at −80 °C until use.
Saturation binding assays
Saturation binding experiments were performed at membrane preparations of Sf9 insect cells expressing either the rAdeR alone or coexpressing the rAdeR and mammalian Gi proteins [19]. [3H]adenine was used as a radioligand in concentrations ranging from 0.05 to 2,000 nM. The specific activity of [3H]adenine was reduced to 5.44 Ci/mmol. The final assay volume (200 μl) consisted of 50 μl Tris buffer (50 mM, pH 7.4, autoclaved, DMSO final concentration 2.5 %) for the determination of total binding, or 50 μl of Tris buffer, containing 400 μM adenine (to reach a final concentration of 100 μM), for the determination of nonspecific binding, and 100 μl membrane suspension (100 μg of protein per sample diluted in the same Tris/DMSO buffer). After an incubation for 1 h at room temperature, samples were filtered through GF/B glass fiber filters and subsequently washed three times with 2 ml each of ice-cold, autoclaved 50 mM Tris buffer, pH 7.4. Filter-bound radioactivity was determined by liquid scintillation counting after at least 6 h of incubation. Three independent experiments were performed each in duplicates.
[3H]Adenine binding studies
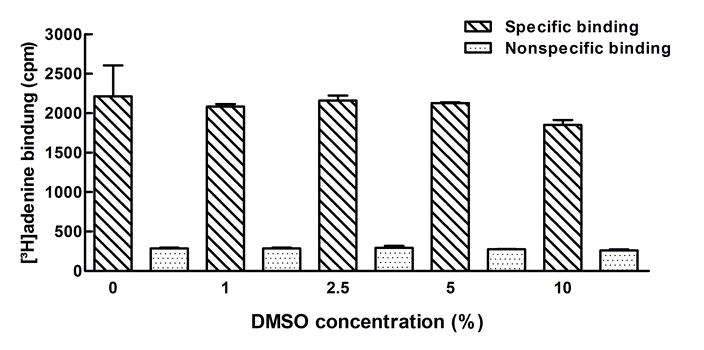
Competition binding experiments were performed with the agonist radioligand [3H]adenine at a final concentration of 10 nM. To 190 μl of 50 mM Tris–HCl buffer (pH 7.4), 10 μl of the test compounds dissolved in DMSO was added. To determine total binding, 10 μl of DMSO without compound was added. Adenine (100 μM) was used to determine nonspecific binding. After the addition of the radioligand solution (100 μl) and the protein suspension (100 μl), both in 50 mM Tris–HCl buffer (pH 7.4) yielding a total volume of 400 μl with a final DMSO concentration of 2.5 %, the samples were incubated for 1 h at room temperature. Then, samples were harvested using GF/B glass fiber filters and washed three times with 2 ml ice-cold 50 mM Tris–HCl buffer (pH 7.4) each. Filters were incubated in 2.5 ml of scintillation cocktail (Lumag AG, Basel) for 6 h before counting. Three independent experiments were performed each in triplicates. Nonspecific binding amounted to <35 % of total binding. It was shown that DMSO concentration of up to 5 % did not have any effect on [3H]adenine binding to the rat adenine receptor (see Supplemental Fig. 1) [20].
[35S]GTPγS binding studies
[35S]GTPγS binding studies were performed as previously described [21]. The radioligand [35S]GTPγS was used at a final concentration of 0.5 nM. The buffer (pH 7.4) consisted of 75 mM Tris–HCl, 12.5 mM MgCl2, and 1 mM EDTA. The final assay volume of 500 μl contained the following components: 300 μl of buffer supplemented with 0.05 % (w/v) bovine serum albumin, 50 μl of GDP (10 μM) dissolved in buffer, 50 μl of test compound, or 50 μl of Tris–HCl buffer (50 mM, pH 7.4, containing DMSO, final concentration 1 %), respectively, the latter to determine total binding, or 50 μl of GTPγS (10 μM) for the determination of nonspecific binding. Then, the radioligand solution (50 μl) diluted in buffer and protein suspension (50 μl) in buffer were added. Samples were incubated for 1 h at room temperature and then harvested and counted as described above for the [3H]adenine binding studies. Three independent experiments were performed each in triplicates.
Determination of intracellular cAMP accumulation
Intracellular cyclic AMP accumulation studies were performed as previously described [5, 22]. In brief, stably transfected 1321N1 astrocytoma cells expressing the rAdeR [5] were cultured in 24-well plates. The culture medium was removed and the cells were washed with 500 μl of 37 °C warm Hank’s Balanced Salt Solution (HBSS; 20 mM HEPES, 135 mM NaCl, 5.5 mM glucose, 5.4 mM KCl, 4.2 mM NaHCO3, 1.25 mM CaCl2, 1 mM MgCl2, 0.8 mM MgSO4, 0.44 mM KH2PO4, and 0.34 mM Na2HPO4, pH 7.4). After adding 400 μl of HBSS buffer, the cells were incubated for 2 h at 37 °C and 5 % CO2. Cellular cAMP production was stimulated by the addition of 10 μM forskolin. Compounds and forskolin were added together. After 10 min, the reaction was stopped by replacing the reaction buffer with 500 μl of hot (90 °C) lysis buffer consisting of 4 mM EDTA and 0.01 % Triton X-100 (pH 7.4). The cAMP amount was quantified by competition radioligand binding studies. The final assay volume was 120 μl, containing 50 μl of cell lysate, 30 μl of [3H]cAMP solution in lysis buffer (final concentration 3 nM), and 40 μl of cAMP binding protein diluted in the same buffer (100 μg per sample). Total binding was determined by using lysis buffer, and the background was determined in the absence of cAMP binding protein. After 1 h at 4 °C, samples were harvested by filtration through GF/B glass fiber filters, followed by three washes with 2 ml ice-cold 50 mM Tris–HCl buffer (pH 7.4). Filter-bound radioactivity was determined by liquid scintillation counting. Three independent experiments were performed in triplicates. A cAMP standard curve was generated for each experiment to determine the amount of cAMP per well. For analysis, the percentage of forskolin-induced cAMP production was plotted against the compound concentration.
Determination of effects of dithiothreitol treatment
The effect of dithiothreitol (DTT) on adenine binding was determined using radioligand binding studies as described above at membranes from infected Sf9 cells, overexpressing the rAdeR. DTT (10 mM) was added to the samples before the 1-h incubation. The effect of DTT on receptor function was measured by adenine-induced cAMP accumulation in stably transfected 1321N1 astrocytoma cells expressing the rAdeR as described above. Cells were preincubated with DTT (10 mM) for 2 h at 37 °C.
Antibody evaluation and Western blot analysis
All custom-made antibodies were tested and evaluated by Western blot analysis using membrane preparations of Sf9 cells overexpressing rAdeRs and of rat brain cortex. Protein concentrations were determined by the Bradford method [23]. The rAdeR-313–331 antibody was chosen for further analysis of rAdeR expression. Protein samples were diluted in 4-fold sample buffer (45 % (v/v) glycerol, 20 % (w/v) SDS, 20 mM Tris–HCl (pH 6.8), 1 % (w/v) bromphenol blue, and 20 % (v/v) mercaptoethanol), heated, and separated in a 10 % SDS gel. SDS-PAGE was performed according to Laemmli [24]. The primary antibodies c-myc 9E10 and rAdeR-313–331 were diluted 1:5,000 in PBS containing 5 % powdered milk. The antibodies against the Gi protein subunits were used in a concentration of 1:2,000. The secondary antibodies were used in a concentration of 1:5,000, diluted in PBS containing 5 % powdered milk. The detection reagent Super Signal West Pico Chemiluminescent substrate was obtained from Thermo Scientific, Rockford, IL, USA.
Molecular modeling
A draft model of the rAdeR was generated using the crystal structure of the human β2 adrenergic receptor (2RH1) as a template [25]. The model was generated with the MOE homology model algorithm (Chemical Computing Group Inc., Montreal). The first 35 amino acid residues and the C-terminus (amino acids 306–331) were omitted from the model, since there was no homology between the receptor and the template. From the resulting 25 models, the model with the best energy values was further energy-minimized and used for the prediction of the binding site. Docking studies with adenine and several adenine derivatives were performed using MOE dock and FlexX within the LeadIT package (BioSolveIT, Sankt Augustin, Germany). Since the sequence identity between the template and the rAde receptor was only 17 % (22 % in the transmembrane domains (TMDs) only), the model is considered as tentative and only useful to get a general idea about the putative structure of the receptor.
Data analysis
Results are presented as means ± SEM from n observations. Data were analyzed using Prism 5.0 (GraphPad Software Inc., San Diego, CA, USA). Differences between means were tested for significance by the unpaired t test or one-way ANOVA (Prism). IC50 values were determined by fitting the data to a sigmoidal curve with variable slope, or by nonlinear regression with one binding site.
Results
Adenine receptors (AdeRs) represent a new family of GPCRs activated by the nucleobase adenine. In the present study, we therefore analyzed the structure and function of the prototypic rAdeR [2, 5, 6, 9–12, 26, 27] by an approach combining chemical, biological, and pharmacological experiments.
Selection of amino acid residues for mutagenesis study
In an attempt to identify the putative binding site for adenine, amino acids presumed to be involved in ligand binding were selected and exchanged for alanine. Heo et al. had published a homology model of the rAdeR based on homology models of the mouse MrgA1 and MrgC11 receptors [15]. The rAdeR sequence that they used is lacking 27 amino acids at the N-terminus. This sequence may represent a potential signal peptide. Therefore, the numbering used in the present study, which is based on the whole coding sequence including the N-terminal putative signal peptide (AJ311952), differs from the numbering used by Heo et al. by 27 amino acids [15]. We additionally provide the Ballesteros-Weinstein numbering: to the most conserved amino acid residue in each TMD, the number 50 is assigned, and numbers for other amino acid residues are decreased towards the N-terminus and increased towards the C-terminus; the thus created amino acid number is preceded by the helix number [28]. In addition, the highly conserved cysteine residue in the ECL2 gets the position number 45.50, and amino acids located in the ECL2 are numbered in relation to Cys45.50. According to the prediction by Heo et al., the binding pocket is located between helices 3, 4, 5, and 6, and adenine is predicted to mainly interact with five amino acids: Phe1103.24 (Phe83 [15], TMD3), Asn1153.29 (Asn88 [15], TMD3), Asn1734.60 (Asn146 [15], TMD4), Leu2015.47 (Leu174 [15], TMD5), and His2526.54 (His225 [15], TMD6), of which the two asparagine residues Asn3.29 and Asn4.60 were hypothesized to be most important [15].
By multiple sequence alignment analysis, the phenylalanine residue Phe17945.39 located in the ECL2 close to TMD4, which is conserved in all AdeRs and most Mrg receptors, was identified as a further potential candidate (see Supplemental Fig. 2). In all known AdeR sequences, a conserved amino acid sequence, SNFF (amino acid residues 193–196), located at the C terminal side of the ECL2 at the top of TMD5 is found, which might play a role in ligand binding as well (Supplemental Fig. 2). Therefore, two of those amino acid residues, Asn1945.40 and Phe1955.41, were also selected for mutagenesis.
Meanwhile, a number of crystal structures of various class A GPCRs have been published [29, 30]. Therefore, we constructed a new homology model of the rAdeR based on the crystal structure of the human β2AR in complex with the partial inverse agonist carazolol (PDB code 2RH1 [25]). This was the best suitable available crystal structure at the time the model was built, the homology between the transmembrane domains was slightly higher in comparison to the β2AR (22 %) as compared to the A2A adenosine receptor (20 %). The rAdeR model generated using the MOE homology model algorithm was further energy-minimized and the binding site was predicted with the site finder algorithm of the MOE package. By analyzing the predicted binding pocket of our draft model based on preliminary docking studies with adenine and several adenine derivatives, it was speculated that Tyr2687.32 (ECL3) might be involved in ligand binding and was therefore mutated as well. Figure 1 shows the 2D topology of the rAdeR as a snake-like plot with all amino acid residues selected for mutagenesis: Phe1103.24, Asn1153.29, Asn1734.60, Phe17945.39, Asn1945.40, Phe1955.41, Leu2015.47, His2526.54, and Tyr2687.32, highlighted in color. The rAdeR homology model is shown in Fig. 2 with the amino acid residues selected for mutagenesis shown as sticks using the same colors as in the 2D topology plot (Fig. 1).
Fig. 1.

Topology model of the rat adenine receptor. Mutated amino acid residues presumed to be involved in ligand binding and the potential N-terminal signal peptide are shown as hexagons using the following color code: gray, potential signal peptide; blue, Phe1103.24; red, Asn1153.29; magenta, Asn1734.60; purple, Phe17945.39 (Phe179 is located in ECL2 which also includes the highly conserved residue Cys19045.50); orange, Asn1945.40; cyan, Phe1955.41; green, Leu2015.47; brown, His2526.54; and dark green, Tyr2687.32
Fig. 2.

Homology model of the rat adenine receptor. The homology model was generated using the X-ray structure 2RH1 of the human β2 adrenergic receptor as template [25]. The receptor (amino acid residues 36–305) is shown as gray cartoon representation with the transmembrane domains numbered. Amino acid residues selected for mutagenesis are represented as colored sticks: blue, Phe1103.24; red, Asn1153.29; magenta, Asn1734.60; purple, Phe17945.39; orange, Asn1945.40; cyan, Phe1955.41; green, Leu2015.47; brown, His2526.54; and dark green, Tyr2687.32
[3H]Adenine binding studies
As shown in Fig. 3, Sf9 insect cells are a suitable system for the expression of rAdeRs, since only a very low background of [3H]adenine binding is observed in noninfected cells. Therefore, the wt rAdeR and its mutants were expressed in Sf9 insect cells with or without coexpression of mammalian Gi proteins, namely Gαi2 and Gβ1γ2 subunits. The expression of G proteins was confirmed by Western blot analysis as shown in Fig. 4. The antibody against mammalian Gαi1/i2 did not recognize the endogenous insect G protein (Fig. 4, lines 1 (control) and 2 (wt without G proteins)), while the antibody against the γ subunit recognized both, the recombinant as well as the endogenous proteins (Fig. 4, line 1). Membranes were prepared and [3H]adenine saturation binding studies were performed.
Fig. 3.

[3H]Adenine binding (10 nM) to membrane preparations of Sf9 insect cells (100 μg protein). Comparison of noninfected Sf9 cells and Sf9 cells expressing either G protein subunits or rAdeRs. Data represent means ± SEM of five (noninfected) or three (infected) independent experiments performed in triplicates. Results of a two-tailed t test: ***p < 0.0001, significantly different
Fig. 4.
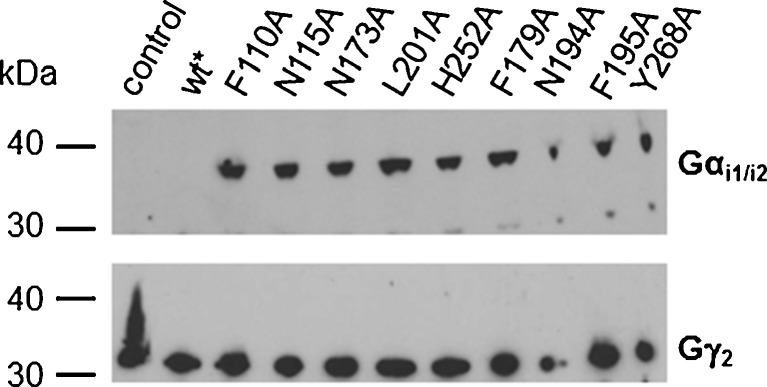
Western blot analysis of the expression of G protein subunits in triple-infected Sf9 cells expressing wild-type (wt) rat adenine receptors or mutant constructs in addition to recombinant mammalian G proteins. Membrane preparations of infected Sf9 insect cells (3 μg) were separated in an SDS gel and transferred onto a nitrocellulose membrane. Protein bands of Gαi2 (~45 kDa) and Gγ2 (~8 kDa) were detected using antibodies against Gαi1/i2 (1:2,000) and Gγ2 (1:2,000), respectively. Asterisk in the upper panel (Gαi1/i2 antibody): wt receptor was expressed without G proteins
Wild-type receptor
At the wt rAdeR, a KD value of 152 ± 23 nM and a Bmax value of 7.85 ± 1.83 pmol/mg protein were determined in the absence of mammalian G protein (Fig. 5a). In the presence of mammalian Gi proteins, the KD value was somewhat lower (KD 100 ± 15 nM, Bmax 1.41 pmol/mg of protein) (Fig. 5b), and the difference in KD values reached the level of significance (p = 0.0335, unpaired t test). Homologous competition experiments of unlabeled adenine versus [3H]adenine (10 nM) yielded a Ki value of 255 ± 49 nM, while in cell membranes coexpressing mammalian Gi proteins, a significant, 3-fold increase in affinity of adenine for the rAdeR was observed (Ki 86.6 ± 15.7 nM) (Fig. 6).
Fig. 5.

Saturation binding of [3H]adenine to a rAdeR and b rAdeR cotransfected with mammalian G proteins, recombinantly expressed in Sf9 insect cells. Data points represent means of one of three experiments performed in duplicates
Fig. 6.

Homologous competition binding of adenine at rAdeR or rAdeR cotransfected with mammalian G proteins, expressed in Sf9 cells versus [3H]adenine (10 nM). The results shown represent means ± SEM from three to seven independent experiments performed in triplicates
Mutant receptors
Nine different mutants of the rAdeR, in each of which one of the selected amino acids was exchanged for alanine, were expressed in Sf9 insect cells (see Fig. 1). Cell membranes were prepared and homologous competition assays were performed using a range of concentrations of unlabeled adenine versus [3H]adenine (10 nM). For all expressed mutants, Bmax values in about the same range—between 1.36 and 3.01 pmol/mg of protein—were determined (see Table 1). IC50 and pIC50 values for the mutant receptors in comparison to the wt rAdeR are collected in Table 1 and Supplemental Fig. 3. The F110A, F179A, N194A, and L201A mutants showed virtually identical IC50 values for adenine as the wt receptor. Slight, but statistically significant decreases in affinity up to 2.9-fold were detected for the other mutants, N115A, N173A, F195A, H252A, and Y268A with the greatest and most significant reductions observed for the N115A and the H252A mutant (see Table 1 and Supplemental Fig. 3).
Table 1.
IC50 values determined for adenine in homologous radioligand competition binding assays versus [3H]adenine (10 nM) at the wt and mutant rAdeRs using membrane preparations of infected Sf9 cells. Data are means ± SEM of n independent experiments
| Adenine | |||||
|---|---|---|---|---|---|
| IC50 ± SEM (nM) | Numbera | pb | Fold shiftc | Bmax (pmol/mg of protein) | |
| wt | 236 ± 35 | 7 | 2.66 ± 0.54 | ||
| F110A | 218 ± 53 | 3 | ns | 0.9 | 1.47 ± 0.41 |
| N115A | 689 ± 96 | 4 | *** | 2.9 | 3.01 ± 0.36 |
| N173A | 397 ± 66 | 4 | *** | 1.7 | 2.56 ± 0.50 |
| F179A | 270 ± 48 | 4 | ns | 1.1 | 2.67 ± 0.63 |
| N194A | 186 ± 19 | 4 | ns | 0.8 | 1.36 ± 0.39 |
| F195A | 292 ± 31 | 4 | * | 1.2 | 2.19 ± 0.75 |
| L201A | 206 ± 49 | 4 | ns | 0.9 | 1.90 ± 0.46 |
| H252A | 583 ± 94 | 4 | *** | 2.5 | 2.79 ± 0.30 |
| Y268A | 302 ± 33 | 4 | * | 1.3 | 2.74 ± 0.85 |
ns not significant
p > 0.05; *p < 0.05; ***p < 0.001
aNumber of experiments performed in triplicates
bLevel of significance of IC50 value determined at mutant as compared to wild-type receptor calculated by the unpaired t test
cThe shift represents the ratio of IC50 (mutant)/IC50 (wt)
[35S]GTPγS binding studies
In order to assess the effects of the mutations on receptor function, all nine mutant receptors were coexpressed with mammalian Gi proteins in Sf9 insect cells. The expression of the G proteins was confirmed by Western blot analysis, and the expression levels of the Gi protein subunits were found to be similar in all samples (Fig. 4). Cell membranes were prepared and the effects of a wide range of concentrations of the agonist adenine on [35S]GTPγS binding were investigated as a measure of receptor activation.
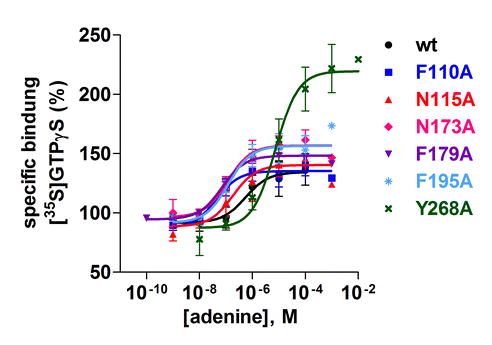
At the wt receptor, adenine led to an activation of [35S]GTPγS binding with an EC50 value of 605 ± 79 nM. Binding was increased from a basal level of 100 % to 136 % (see Table 2, Supplemental Fig. 4, and Fig. 7). Two of the mutant receptors, namely N194A and L201A, could not be activated by adenine, while all others showed concentration-dependent increases in [35S]GTPγS binding induced by adenine and full activatability (Table 2, Fig. 7). EC50 values at the mutant receptors were similar (H252A) or somewhat (4–14-fold) lower (F110A, N115A, N173A, F179A, F195A) compared to the wt receptor. In the case of the Y268A mutant, the EC50 value was 12-fold higher than that of the wt rAdeR, and the mutant receptor showed a significantly higher efficacy (229 versus 136 % for the wt receptor, see Table 2 and Supplemental Fig. 4).
Table 2.
EC50 value and efficacy of adenine determined in [35S]GTPγS binding studies at membrane preparations of Sf9 cells, coexpressing the rat adenine wild-type or mutant receptors, respectively, and mammalian G proteins (Gαi2 and Gβ1γ2)
| EC50 (nM) | Number | p | Fold shifta | Emax (% ± SEM) | p | |
|---|---|---|---|---|---|---|
| wt | 605 ± 79 | 5 | 136 ± 12 | |||
| F110A | 44 ± 8 | 3 | ** | 14 | 129 ± 9 | ns |
| N115A | 166 ± 52 | 4 | ** | 4 | 124 ± 11 | ns |
| N173A | 131 ± 2 | 3 | ** | 5 | 146 ± 8 | ns |
| F179A | 82 ± 15 | 3 | ** | 7 | 141 ± 6 | ns |
| N194A | Very minor effect | 5 | nd | |||
| F195A | 107 ± 10 | 3 | ** | 6 | 174 ± 12 | ns |
| L201A | No effect | 4 | nd | |||
| H252A | 718 ± 132 | 3 | ns | 1 | 146 ± 15 | ns |
| Y268A | 7,082 ± 1,220 | 4 | *** | 0.08 | 229 ± 20 | * |
Number, number of experiments performed in triplicates; nd not determined; Emax value, maximal effect of the specific binding of [35S]GTPγS; binding in the absence of adenine was set at 100 %; p, significance was determined using the unpaired t test, mutants were compared to rAdeR coexpressed with G proteins; ns not significant
p > 0.05; *p < 0.05; **p < 0.01; ***p < 0.001
aThe shift represents the ratio of EC50 (wt)/EC50 (mutant)
Fig. 7.

[35S]GTPγS binding studies at wt and mutant rat adenine receptors coexpressed with mammalian G proteins. Adenine-induced effects on [35S]GTPγS binding at the wt rat adenine receptor and its mutants N194A and L201A. The radioligand [35S]GTPγS was used at a concentration of 0.5 nM. The results shown represent means ± SEM from three to five independent experiments performed in triplicates. EC50 and Emax values are listed in Table 2
Characterization of an N-terminal deletion mutant
As a next step, we wanted to investigate whether the first 27 amino acids of the N-terminus of the rAdeR might function as a signal peptide that is cleaved off after translocation to the ER. Therefore, several N-terminal deletion mutants with and without myc-tag as well as the myc-tagged wt receptor containing the potential signal peptide expressed in Sf9 insect cells were investigated (see Fig. 8). Cell membranes of Sf9 insect cells expressing the constructs (Fig. 8) were prepared and investigated for expression by Western blot analysis using the developed antibody against the rAdeR protein (313–331). The antibody recognized the myc-tagged wt and mutant as well as the untagged mutant receptor (see Fig. 9). In contrast, an anti-myc antibody only labeled the myc-tagged mutant receptor, in which the putative signal was missing, but not the myc-tagged wt or the untagged mutant receptor (see Fig. 9).
Fig. 8.

Schematic representation of the constructs generated to investigate the presumed existence of a signal peptide at the N-terminus of the rat adenine receptor. The corresponding sequence is also color-coded; myc, epitope for antibody recognition; rAdeR, rat adenine receptor; TMD, transmembrane domain; ΔN, deletion of N-terminus
Fig. 9.

Western blot experiments were performed with membranes of Sf9 insect cells (30 μg of protein, control cells) and membranes containing myc-rAdeR, rAdeRΔN, or myc-rAdeRΔN, respectively (50 μg of protein each). α-myc antibody recognizes the myc epitope; α-rAdeR-313-331 antibody recognizes the rAdeR peptide (amino acid residues 323–331). The protein bands were detected at 35 kDa. Additional rAdeR-specific bands were detected between about 60 and 70 kDa possibly representing receptor dimers
The receptors were further characterized by competition binding studies of a range of concentrations of adenine versus [3H]adenine (10 nM). IC50 values for adenine versus 10 nM [3H]adenine determined at membrane preparations were similar at all four, myc-tagged and untagged wt and mutant receptors (see Table 3).
Table 3.
Affinity of adenine for the tagged and the untagged wt and N-terminal deletion mutant of the rat adenine receptor determined by radioligand binding versus [3H]adenine (10 nM)
| Adenine | |||
|---|---|---|---|
| IC50 ± SEM (nM) | Numbera | pb | |
| rAdeR | 236 ± 35 | 7 | |
| myc-rAdeR | 211 ± 11 | 3 | ns |
| rAdeRΔN | 391 ± 100 | 5 | ns |
| myc-rAdeRΔN | 340 ± 60 | 4 | ns |
ns not significant
p > 0.05
aNumber of experiments performed in triplicates
bLevel of significance in comparison to the data of the wt receptor
Effects of dithiothreitol on adenine receptor binding and function
Finally, we investigated the role of potential extracellular disulfide bonds for adenine binding and receptor function. Thus, homologous competition studies were performed versus [3H]adenine (10 nM) at membrane preparations of rAdeR-expressing Sf9 insect cells without and after preincubation with 10 mM DTT. DTT treatment, which would lead to the reduction of accessible disulfide bonds, did not have any effect on adenine binding to the rAdeR (IC50 with DTT, 158 ± 16 nM compared to 173 ± 34 nM without DTT, see Fig. 10a).
Fig. 10.

a Effect of dithiothreitol (DTT) on adenine binding to rAdeR. Radioligand binding assays were performed either with (10 mM) DTT or without DTT using membrane preparations from infected Sf9 cells with [3H]adenine as a radioligand. IC50 value obtained with DTT—158 ± 16 nM; without DTT—173 ± 34 nM. b Effects of DTT on rAde receptor function. Concentration-dependent inhibition of forskolin-induced cAMP accumulation using adenine as agonist was measured using stably transfected 1321N1 astrocytoma cells without or with DTT pretreatment (10 mM, 2 h at 37 °C). Determined EC50 values: without DTT—13.3 ± 1.8 nM; with DTT pretreatment—18.0 ± 1.5 nM. The determined Emax values were not significantly different with and without DTT pretreatment (unpaired t test, p = 0.573)
In order to investigate potential consequences of DTT treatment on receptor function, the rAdeR was stably expressed in human 1321N1 astrocytoma cells by retroviral transfection. These cells were previously shown to be a suitable expression system for the Gi protein-coupled AdeRs [3]1. Adenine-induced inhibition of forskolin-stimulated cAMP accumulation was determined as previously described [3]1. DTT pretreatment did not exhibit any significant effect on the concentration–response curve of adenine. Without DTT pretreatment, an EC50 value of 13.3 ± 1.8 nM was determined for adenine. After treatment with 10 mM DTT, virtually the same EC50 value could be measured (18.0 ± 1.5 nM, see Fig. 10b). The maximal effects of adenine with and without DTT pretreatment were not significantly different (unpaired t test, p = 0.573).
Discussion
Adenine has been recognized as a novel signaling molecule [2, 7, 10–12, 14, 26, 27], which may constitute a “danger signal” in pathological situations [10]1, such as inflammation, pain, neurodegeneration, liver injury, and kidney failure. It was shown to activate a new class of GPCRs at nanomolar concentrations, four of which have been described and characterized so far: one from rat (rAdeR), one from hamster (cAdeR), and two subtypes from mouse [2, 3, 6].1 Up to now, very little is known about these unique nucleobase-activated receptors. Similar to some biogenic amine neurotransmitters, such as the catecholamines and histamine, adenine is a very small molecule (Mr = 135.13) that possesses high, nanomolar affinity and potency at a protein target. This means that all structural elements such as aromatic structures, hydrogen bond donating, and hydrogen bond accepting functions of adenine are likely to be involved in binding to and interaction with its receptor. In fact, moderate structural modifications of adenine were already shown to lead to a reduction in affinity or even a complete loss of affinity and potency [2, 5, 6].1 AdeRs were found to show fast association and slow dissociation kinetics [3, 6].1
We have now investigated the structure and the putative adenine binding site of the rAdeR as a prototypic AdeR by site-directed mutagenesis combined with radioligand binding and functional experiments. All of the known rodent AdeRs share moderate homology (>73 %) but similar structure–activity relationships1 indicating that important structural features, and in particular, their binding site for adenine is highly conserved. Although a human AdeR has not been identified yet by sequence comparison, there are indications that functional human AdeRs do exist [5, 6, 14]. Although those putative human AdeRs do not show high (<50 %) sequence identity with the rAdeR, their agonist binding site may still be well conserved, and the results obtained in the present study at the rAdeR might be useful for the identification and characterization of a human AdeR as well.
For mutagenesis studies, we selected certain amino acids predicted to potentially participate in ligand binding or receptor activation based on (a) sequence comparison looking for conserved residues, (b) predictions made by Heo et al. [15] in 2007 based on a homology model, and (c) our own, refined homology model incorporating recent progress in GPCR structure elucidation [29]. X-ray structures for a number of the more prominent class A GPCRs have recently become available [29, 31], which can serve as templates for homology modeling. However, homology modeling of GPCRs, for which no template with more than 30 % sequence homology is available, is still highly speculative. It might be possible to predict the helical bundle of TMDs quite accurately, but prediction of the loop structures, which can largely differ even among receptors of the same subfamily is challenging. Homology modeling is further complicated by the fact that the available crystal structures only provide snapshots of receptor conformations, and very often, the loop regions are poorly resolved. Even with the most accurate models, based on templates with >50 % homology, it remains difficult to predict the exact ligand binding site [32–34]. This is even more difficult if the ligand is a small, uncharged molecule, such as adenine.
The homology model for the rAdeR (MrgA) published by Heo et al. [15] to predict the putative adenine binding site was based on 3D structures of the mouse MrgC11 and the mouse MrgA1 receptor [15]. These models had been built ab initio and assembled using coordinates from the frog rhodopsin 2D X-ray projection structure [35, 36]. Heo et al. suggested Phe1103.24, Asn1153.29, Asn1734.60, Leu2015.47, and His2526.54 to be involved in adenine binding. The following interactions were predicted: the side chain of Asn1153.29 was presumed to form two hydrogen bonds with N3 and N9 of adenine, and Asn1734.60 was proposed to form two hydrogen bonds with N1 and N6 of adenine. Phe1103.24 and His2526.54 were thought to interact with the purine ring by π stacking interactions, and Leu2015.47 was predicted to form hydrophobic interactions with adenine [15]. Phe1103.24 is conserved among all AdeRs as well as in other MrgA family members (see Supplemental Fig. 2). Asn1153.29 is conserved in rat and hamster AdeRs as well as in the MrgA2 subtype of the mouse receptor. His2526.54 is conserved in rat and hamster AdeRs and found in the mouse MrgA1, but not in the known mouse AdeR subtypes, while Asn1734.60 is conserved among the MrgA family only (see Supplemental Fig. 2). Leu2015.47 is highly conserved throughout the AdeRs and conserved in most other Mrg families as well (see Supplemental Fig. 2). Comparison of ortholog sequences and sequences of closely related receptors has been shown to be highly useful for predicting amino acid residues important for receptor function [37].
According to our own analysis based on a tentative homology model and multiple sequence alignments, we predicted four additional amino acid residues to be potentially important: Asn1945.40 and Phe1955.41, both located in an SNFF motif at the extracellular part of TMD5, which is highly conserved in rodent AdeRs and a few additional mouse MrgA receptor subtypes (MrgA4, 5, 7), Phe17945.39, which is conserved among all AdeRs, and several other Mrg receptor family members, and Tyr2687.32, which was predicted to be part of the binding pocket in docking studies. Tyr2687.32 is conserved in the rat and hamster AdeRs, and in one branch of the mouse MrgA receptors (MrgA3, 4, 7, 8). For sequence alignments, see Supplemental Fig. 2.
All mutant receptors, in each of which a single predicted amino acid residue was exchanged for alanine, were expressed in Sf9 cells. Insect cells have previously been shown to be a suitable system for expressing AdeRs and to permit radioligand binding studies due to a very low background of [3H]adenine binding (see Fig. 3) [3, 38, 39].
The wt and all mutant AdeRs could be expressed in very high (picomolar) and similar density in the insect cells (Fig. 4 and Table 1). In order to allow for a functional analysis of the receptors, they were additionally coexpressed with mammalian Gi proteins. For the wt rAdeR, KD and Bmax values were determined by saturation binding assays, which represents the most accurate method, but requires large amounts of radioligand. A KD value for the wt rAdeR of 152 nM was determined, which was about 6-fold higher than that previously determined for the endogenous receptor expressed in rat brain cortical membranes [6]. This may be due to the lack of mammalian G proteins coupling to the receptor protein thereby allosterically modulating the agonist binding site [40]. In the presence of G proteins, GPCRs may undergo conformational changes reaching a state to which agonists bind with high affinity [39]. When the rAdeR was cotransfected with mammalian G proteins, the affinity of adenine increased, not dramatically, but the difference was statistically significant (Fig. 5). Besides G proteins, further modulating factors may contribute to the higher affinity of the rAdeR for adenine when it is localized in its native surrounding, e.g., in rat brain preparations, as compared to insect cells. The same phenomenon had previously been observed for the mAde2R when expressed in insect cells [3].
Competition binding studies at the wt and mutant rAdeRs using a range of concentrations of adenine versus [3H]adenine (10 nM) showed that all mutant receptors were able to bind adenine with the same or only moderately reduced affinity as compared to the wt rAdeR (Table 1). The largest reductions were only 2.9-fold (for N115A) and 2.5-fold (for H252A), respectively. We can therefore conclude those amino acid residues previously suggested to bind adenine are not involved in direct receptor–ligand interaction. This devastating finding shows that it is almost impossible to predict exact ligand–receptor interactions with homology models based on templates with low homology [41]. Such homology modeling studies are meaningless and pure gimmick as long as they are not supported by experimental evidence.
Coexpression of the wt rAdeR, or its mutants, respectively, with mammalian Gi proteins allowed the performance of [35S]GTPγS binding studies, which can indicate the degree of receptor activation [42–44]. As already mentioned, G proteins can allosterically modulate the binding of an agonist to its receptor. This modulation is reciprocal, and activation of the GPCR in turn allosterically modulates the binding of GTP (or its stable analog GTPγS) to the G protein α-subunit. The agonist-induced increase in [35S]GTPγS binding can be quantified and correlates to receptor activation. Like the wt rAdeR (EC50 605 nM), most of the mutants could be activated by adenine in a concentration-dependent manner. However, two mutants showed no (L201A) or only a very minor activation (N194A) by adenine even at high concentrations up to 10 mM (Fig. 7). Both mutants had not shown any alteration in adenine binding in comparison with the wt receptor. Asn1945.40 belongs to a highly conserved SNFF motif in the ECL2 close to the beginning of TMD5 (see Supplemental Fig. 2 and Fig. 1). The ECL2 of adenosine A2 receptors has recently been shown to be involved in the control of receptor activation.2 We now observed that in the rAdeR the exchange of a single amino acid residue in the ECL2, Asn1945.40, for alanine virtually abolished adenine-induced receptor activation. Leu2015.47 is located in TMD5, deeper down in the helical bundle than the other mutated amino acid residues (see Figs. 1 and 2). Like Asn1945.40, it is a highly conserved amino acid in AdeRs and several of the related Mrg receptors (e.g., MrgA, MrgC, see Supplemental Fig. 2). Since its mutation completely abolished receptor activation, it appears to play a key role in transmission of the signal to the G protein. All other mutant receptors could be fully activated by adenine, which exhibited similarly high efficacy at the wt as at all of the mutant receptors, except for the Y268A mutant: here adenine was significantly more efficacious (increase from 100 % basal [35S]GTPγS binding to 229 %) than at the wt receptor (136 %). Tyr2687.32 is located at the end of ECL3, beginning of TMD7 (Fig. 1) and appears to contribute to receptor stabilization (see Fig. 2) [45–47]; it also showed somewhat reduced affinity and potency. In contrast, several of the mutants displayed increased potency of adenine up to 14-fold (F110A). Potency determined in the [35S]GTPγS assays did not in all cases correlate well with affinities determined in [3H]adenine binding studies. This may be due to the somewhat different receptor/G protein ratios in the recombinant cells. This would not affect affinity data obtained by [3H]adenine binding experiments, but may have an influence on functional data [48, 49].
Most class A GPCRs possess two highly conserved cysteine residues forming a disulfide bond connecting the extracellular half of TMD3 (Cys3.25) with the ECL2 (Cys45.50) [50]. This disulfide bond is found to be present in all currently available GPCR crystal structures [51]. The whole family of Mrg receptors does not contain this disulfide bond, since the cysteine residue in TMD3 is either missing or buried deep down in the helix and therefore not accessible for disulfide bond formation. On the other hand, the conserved cysteine residue in the ECL2 is present in most Mas-related GPCRs. In fact, the rAdeR possesses two cysteine residues in the ECL2, C17745.37 and C19045.50, which are conserved throughout the AdeR and MrgA families (see Supplemental Fig. 2). Those cysteine residues might be able to form a disulfide bond with one another, or with another cysteine residue yet to be identified. Since both residues are located very close to TMD4, or TMD5, respectively, it is not very likely that they interact with each other, since this would bring both helices in very close proximity to each other. We have now experimentally supported the assumption that probably no disulfide bond is formed, by measuring ligand binding and receptor activation (by cAMP accumulation studies) without and after preincubation with the disulfide-reducing agent DTT. In contrast to many other GPCRs that require an intact extracellular disulfide bond for proper functioning [16, 48, 52], the rAdeR did not show any difference, neither in adenine binding, nor in adenine-induced adenylate cyclase inhibition (Fig. 10) after incubation with DTT to reduce accessible disulfide bonds.
In order to allow the detection of adenine receptors by Western blot analysis, we prepared an antibody against the C-terminal amino acid residues 313–331. This antibody recognized the rAdeR and the two mouse AdeRs, but not the hamster adenine receptor (cAdeR), since the cAdeR contains a seven-amino acid insertion in this region (data not shown). This antibody was required for studying the presence of a potential signal peptide at the N-terminus of the rAdeR that might be cleaved off after translocation through the ER membrane.
The presence of signal peptides is common for many secretory and membrane-located proteins that have either long or highly structured N-termini, which would prevent their translocation through the ER membrane [53, 54]. For GPCRs, signal peptides are usually rare, and only about 5–10 % of GPCRs are predicted to possess one. These are typically found in GPCRs which possess very long N-termini involved in ligand binding, such as members of the glycoprotein hormone receptor family, as well as secretin and glutamate receptors [53, 55, 56]. Only very few class A GPCRs exhibit predicted signal peptides and their function is in most cases not well understood [53]. All known AdeRs as well as a few other MrgA subtypes from mouse possess an extended N-terminus, part of which is coded by a second exon, containing up to three possible start codons (see Supplemental Fig. 2). Our predictions led to the suggestion that rodent AdeRs may possess a signal peptide that would be cleaved off after translocation to the ER. We have now experimentally shown that the predicted signal sequence of the rAdeR is in fact a functional signal peptide that is cleaved off (see Fig. 1). When the truncated receptor lacking an N-terminal peptide sequence of 27 amino acids was expressed in insect cells, we observed that the signal peptide was neither essential for expression nor for ligand binding. It can be speculated that the signal peptide may have regulatory functions in its native environment. Potential regulatory roles include (a) an influence on receptor folding dependent on the time of cleavage, (b) being an attachment point for chaperones or functioning as a chaperone itself guiding the receptor to the plasma membrane, (c) influencing the choice of the targeting pathway, or (d) controlling the receptor quantity, e.g., by retention of the receptors in the ER or by promoting transport to the Golgi. Further studies will be required to elucidate the exact function of the N-terminal rAdeR signal peptide.
Conclusions
In the very first mutagenesis study of a member of the adenine receptor family, namely the AdeR from rat, we found that the homology modeling-based prediction of the adenine binding site could not be confirmed. It appears that predictions of binding sites—at least for very small, uncharged ligands such as adenine—are highly speculative when they are based on X-ray structures of distantly related receptors [57]. Nevertheless, we identified two amino acid residues, Asn1945.40 and Leu2015.47, that are crucial for activation of the receptor. Furthermore, we provide experimental evidence that the conserved disulfide bond, found in most rhodopsin-like GPCRs, is missing in the rAdeR as predicted from alignment analyses. Moreover, we have shown for the first time that AdeRs possess an N-terminal putative signal peptide of yet unknown function, that is cleaved off and no longer present in the membrane-bound receptor protein. To obtain our results, we have raised a peptide antibody against the rAdeR. Furthermore, we established a system for coexpressing the rAdeR and mammalian Gi proteins in Sf9 insect cells allowing to probe receptor activation in those cells, which are ideally suited for AdeR studies due to their lacking of endogenous adenine receptors or binding sites. Our results provide important new insights into this new, still poorly investigated family of purinergic receptors.
Electronic supplementary material
[3H]Adenine binding (10 nM) to membrane preparations of rat cortical membranes (100 μg protein) in the presence of different DMSO concentrations. Data represent means ± SEM of three independent experiments performed in triplicates or in duplicates. Results of one-way ANOVA: non-significantly different p = 0.673 (JPEG 35 kb)
(TIFF 6027 kb)
Multiple sequence alignment of 26 human and rodent Mrg receptors, including Mas and all known adenine receptors, generated using Clustal W. (*) identical amino acid residues; (:) conserved amino acid substitution; (.) semi-conserved amino acid substitution. Amino acid residues are given in the one-letter code (DOCX 29 kb)
Results from homologous competition binding of adenine to wt and mutant rat AdeRs expressed in Sf9 cells vs [3H]adenine (10 nM). Presented pIC50 values are means ± SEM from 3–7 independent experiments performed in triplicates (also see Table 1). The level of significance was determined by an unpaired t-test, ns: non-significant; p > 0.05; * p < 0.05; ***p < 0.001 (JPEG 26 kb)
(TIFF 4385 kb)
[35S]GTPγS binding studies at wt and mutant rat adenine receptors coexpressed with mammalian G proteins. Adenine-induced effects on [35S]GTPγS binding at the wt rat adenine receptor and its mutants F110A, N115A, N173A, F179A, F195A, H252A, and Y268A. The radioligand [35S]GTPγS was used at a concentration of 0.5 nM. The results shown represent means ± SEM from 3–5 independent experiments performed in triplicates. EC50 and Emax values are listed in Table 2 (JPEG 23 kb)
(TIFF 4153 kb)
Acknowledgments
A.C.S., C.E.M, D.T., and M.K. were supported by the state of NRW (NRW International Graduate Research Schools Chemical Biology and BIOTECH-PHARMA). We would like to thank Prof. Dr. Alfred G. Gilman (University of Texas Medical Center, Dallas, TX, USA) for providing Gαi2 baculoviruses and Prof. Dr. Peter Gierschik (Institute of Pharmacology, University of Ulm) for Gβ1γ2 baculoviruses. We are particularly grateful to Prof. Dr. Roland Seifert (Medizinische Hochschule Hannover) for valuable advice regarding the GTPγS experiments and for helpful comments on the manuscript.
Footnotes
Thimm D, Knospe M, Abdelrahman A, Moutinho M, Alsdorf BBA, von Kügelgen I, Schiedel A, Müller CE (2013) Characterization of new G protein-coupled adenine receptors in mouse and hamster, submitted
Seibt et al. (2013) The second extracellular loop of GPCRs determines subtype-selectivity and controls efficacy as evidenced by loop exchange study at A2 adenosine receptors, submitted
Contributor Information
Christa E. Müller, Phone: +49-228-732301, Email: christa.mueller@uni-bonn.de
Anke C. Schiedel, Phone: +49-228-736457, FAX: +49-228-732567, Email: schiedel@uni-bonn.de
References
- 1.Burnstock G. Purine and pyrimidine receptors. Cell Mol Life Sci S. 2007;64:1471–1483. doi: 10.1007/s00018-007-6497-0. [DOI] [PMC free article] [PubMed] [Google Scholar]
- 2.Bender E, Buist A, Jurzak M, Langlois X, Baggerman G, Verhasselt P, Ercken M, Guo HQ, Wintmolders C, Van den Wyngaert I, Van Oers I, Schoofs L, Luyten W. Characterization of an orphan G protein-coupled receptor localized in the dorsal root ganglia reveals adenine as a signaling molecule. Proc Nat Acad Sci USA. 2002;99:8573–8578. doi: 10.1073/pnas.122016499. [DOI] [PMC free article] [PubMed] [Google Scholar]
- 3.von Kügelgen I, Schiedel AC, Hoffmann K, Alsdorf BB, Abdelrahman A, Müller CE. Cloning and functional expression of a novel Gi protein-coupled receptor for adenine from mouse brain. Mol Pharmacol. 2008;73:469–477. doi: 10.1124/mol.107.037069. [DOI] [PubMed] [Google Scholar]
- 4.Brunschweiger A, Müller CE. P2 receptors activated by uracil nucleotides—an update. Curr Med Chem. 2006;13:289–312. doi: 10.2174/092986706775476052. [DOI] [PubMed] [Google Scholar]
- 5.Borrmann T, Abdelrahman A, Volpini R, Lambertucci C, Alksnis E, Gorzalka S, Knospe M, Schiedel AC, Cristalli G, Müller CE. Structure–activity relationships of adenine and deazaadenine derivatives as ligands for adenine receptors, a new purinergic receptor family. J Med Chem. 2009;52:5974–5989. doi: 10.1021/jm9006356. [DOI] [PubMed] [Google Scholar]
- 6.Gorzalka S, Vittori S, Volpini R, Cristalli G, von Kügelgen I, Müller CE. Evidence for the functional expression and pharmacological characterization of adenine receptors in native cells and tissues. Mol Pharmacol. 2005;67:955–964. doi: 10.1124/mol.104.006601. [DOI] [PubMed] [Google Scholar]
- 7.Matthews EA, Dickenson AH. Effects of spinally administered adenine on dorsal horn neuronal responses in a rat model of inflammation. Neurosci Lett. 2004;356:211–214. doi: 10.1016/j.neulet.2003.11.057. [DOI] [PubMed] [Google Scholar]
- 8.Watanabe S, Yoshimi Y, Ikekita M. Neuroprotective effect of adenine on purkinje cell survival in rat cerebellar primary cultures. J Neurosci Res. 2003;74:754–759. doi: 10.1002/jnr.10790. [DOI] [PubMed] [Google Scholar]
- 9.Watanabe S, Ikekita M, Nakata H. Identification of specific [3H] adenine-binding sites in rat brain membranes. J Biochem. 2005;137:323–329. doi: 10.1093/jb/mvi035. [DOI] [PubMed] [Google Scholar]
- 10.Watanabe A, Sohail MA, Gautam S, Gomes DA, Mehal WZ. Adenine induces differentiation of rat hepatic stellate cells. Dig Dis Sci. 2012;57:2371–2378. doi: 10.1007/s10620-012-2183-7. [DOI] [PMC free article] [PubMed] [Google Scholar]
- 11.Kishore BK, Zhang Y, Pop IL, Gevorgyan H, Müller CM, Peti-Peterdi J. Cellular localization of P0 (adenine) receptor in rat kidney. FASEB J. 2012;26:688.683. [Google Scholar]
- 12.Peti-Peterdi J, Zhang Y, Gevorgyan A, Kohan DE, Müller CM, Kishore BK. Functional expression of P0 (adenine) receptor in the collecting duct of intercalated cells in rat and mouse. J Am Soc Nephrol. 2012;23:611A. [Google Scholar]
- 13.Wengert M, Adao-Novaes J, Assaife-Lopes N, Leao-Ferreira LR, Caruso-Neves C. Adenine-induced inhibition of Na+-ATPase activity: evidence for involvement of the Gi protein-coupled receptor in the cAMP signaling pathway. Arch Biochem Biophys. 2007;467:261–267. doi: 10.1016/j.abb.2007.08.018. [DOI] [PubMed] [Google Scholar]
- 14.Slominska EM, Szolkiewicz M, Smolenski RT, Rutkowski B, Swierczynski J. High plasma adenine concentration in chronic renal failure and its relation to erythrocyte ATP. Nephron. 2002;91:286–291. doi: 10.1159/000058406. [DOI] [PubMed] [Google Scholar]
- 15.Heo J, Vaidehi N, Wendel J, Goddard WA., 3rd Prediction of the 3-D structure of rat MrgA G protein-coupled receptor and identification of its binding site. J Mol Graph Model. 2007;26:800–812. doi: 10.1016/j.jmgm.2007.07.003. [DOI] [PMC free article] [PubMed] [Google Scholar]
- 16.Schiedel AC, Hinz S, Thimm D, Sherbiny F, Borrmann T, Maass A, Müller CE. The four cysteine residues in the second extracellular loop of the human adenosine A2B receptor: role in ligand binding and receptor function. Biochem Pharmacol. 2011;82:389–399. doi: 10.1016/j.bcp.2011.05.008. [DOI] [PubMed] [Google Scholar]
- 17.Gibson SK, Gilman AG. Giα and Gβ subunits both define selectivity of G protein activation by α2-adrenergic receptors. Proc Natl Acad Sci U S A. 2006;103:212–217. doi: 10.1073/pnas.0509763102. [DOI] [PMC free article] [PubMed] [Google Scholar]
- 18.Gutman O, Walliser C, Piechulek T, Gierschik P, Henis YI. Differential regulation of phospholipase C-β2 activity and membrane interaction by Gαq, Gβ1γ2, and Rac2. J Biol Chem. 2010;285:3905–3915. doi: 10.1074/jbc.M109.085100. [DOI] [PMC free article] [PubMed] [Google Scholar]
- 19.Schneider EH, Schnell D, Papa D, Seifert R. High constitutive activity and a G-protein-independent high-affinity state of the human histamine H4-receptor. Biochemistry. 2009;48:1424–1438. doi: 10.1021/bi802050d. [DOI] [PubMed] [Google Scholar]
- 20.Gorzalka S (2006) Neuartige G-Protein-gekoppelte Purinrezeptoren: Funktionelle Charakterisierung nativer Adeninrezeptoren und Evaluation neuer Purinrezeptor-Liganden. Dissertation, University of Bonn, Germany
- 21.Seifert R, Lee TW, Lam VT, Kobilka BK. Reconstitution of β2-adrenoceptor-GTP-binding-protein interaction in Sf9 cells—high coupling efficiency in a β2-adrenoceptor–Gsα fusion protein. Eur J Biochem. 1998;255:369–382. doi: 10.1046/j.1432-1327.1998.2550369.x. [DOI] [PubMed] [Google Scholar]
- 22.Nordstedt C, Fredholm BB. A modification of a protein-binding method for rapid quantification of cAMP in cell-culture supernatants and body fluid. Anal Biochem. 1990;189:231–234. doi: 10.1016/0003-2697(90)90113-N. [DOI] [PubMed] [Google Scholar]
- 23.Bradford MM. A rapid and sensitive method for the quantitation of microgram quantities of protein utilizing the principle of protein-dye binding. Anal Biochem. 1976;72:248–254. doi: 10.1016/0003-2697(76)90527-3. [DOI] [PubMed] [Google Scholar]
- 24.Laemmli UK. Cleavage of structural proteins during the assembly of the head of bacteriophage T4. Nature. 1970;227:680–685. doi: 10.1038/227680a0. [DOI] [PubMed] [Google Scholar]
- 25.Cherezov V, Rosenbaum DM, Hanson MA, Rasmussen SG, Thian FS, Kobilka TS, Choi HJ, Kuhn P, Weis WI, Kobilka BK, Stevens RC. High-resolution crystal structure of an engineered human β2-adrenergic G protein-coupled receptor. Science. 2007;318:1258–1265. doi: 10.1126/science.1150577. [DOI] [PMC free article] [PubMed] [Google Scholar]
- 26.Berger F, Sichardt K, Borrmann T, Müller CE, Nieber K. Functional characterisation of adenine and the new adenine receptor ligands PSB-09073 and PSB-08162 in the rat cingulate cortex. Purinergic Signal. 2010;4(Suppl 5):S44. [Google Scholar]
- 27.Sichardt K, Nieber K. Function of adenine receptors and interactions with adenosine A1 receptors in the rat cingulate cortex. Purinergic Signal. 2008;4(Suppl 1):1–210. [Google Scholar]
- 28.Ballesteros J, Weinstein H. Integrated methods for the constructionof threedimensional models of structure–function relations in G protein-coupled receptors. Meth Neurosci. 1995;25:366–428. doi: 10.1016/S1043-9471(05)80049-7. [DOI] [Google Scholar]
- 29.Jacobson KA, Costanzi S. New insights for drug design from the X-ray crystallographic structures of G-protein-coupled receptors. Mol Pharmacol. 2012;82:361–371. doi: 10.1124/mol.112.079335. [DOI] [PMC free article] [PubMed] [Google Scholar]
- 30.Granier S, Kobilka B. A new era of GPCR structural and chemical biology. Nat Chem Biol. 2012;8:670–673. doi: 10.1038/nchembio.1025. [DOI] [PMC free article] [PubMed] [Google Scholar]
- 31.Katritch V, Cherezov V, Stevens RC. Structure–function of the G protein-coupled receptor superfamily. Annu Rev Pharmacol Toxicol. 2013;53:531–556. doi: 10.1146/annurev-pharmtox-032112-135923. [DOI] [PMC free article] [PubMed] [Google Scholar]
- 32.Mobarec JC, Sanchez R, Filizola M. Modern homology modeling of G-protein coupled receptors: which structural template to use? J Med Chem. 2009;52:5207–5216. doi: 10.1021/jm9005252. [DOI] [PMC free article] [PubMed] [Google Scholar]
- 33.Salon JA, Lodowski DT, Palczewski K. The significance of G protein-coupled receptor crystallography for drug discovery. Pharmacol Rev. 2011;63:901–937. doi: 10.1124/pr.110.003350. [DOI] [PMC free article] [PubMed] [Google Scholar]
- 34.Lebon G, Warne T, Tate CG. Agonist-bound structures of G protein-coupled receptors. Curr Opin Struct Biol. 2012;22:1–9. doi: 10.1016/j.sbi.2012.03.007. [DOI] [PubMed] [Google Scholar]
- 35.Schertler GF, Hargrave PA. Projection structure of frog rhodopsin in two crystal forms. Proc Nat Acad Sci USA. 1995;92:11578–11582. doi: 10.1073/pnas.92.25.11578. [DOI] [PMC free article] [PubMed] [Google Scholar]
- 36.Unger VM, Hargrave PA, Baldwin JM, Schertler GF. Arrangement of rhodopsin transmembrane α-helices. Nature. 1997;389:203–206. doi: 10.1038/38316. [DOI] [PubMed] [Google Scholar]
- 37.Cöster M, Wittkopf D, Kreuchwig A, Kleinau G, Thor D, Krause G, Schöneberg T. Using ortholog sequence data to predict the functional relevance of mutations in G-protein-coupled receptors. FASEB J. 2012;26:3273–3281. doi: 10.1096/fj.12-203737. [DOI] [PubMed] [Google Scholar]
- 38.Schiedel AC, Meyer H, Alsdorf BB, Gorzalka S, Brüssel H, Müller CE. [3H] Adenine is a suitable radioligand for the labeling of G protein-coupled adenine receptors but shows high affinity to bacterial contaminations in buffer solutions. Purinergic Signal. 2007;3:347–358. doi: 10.1007/s11302-007-9060-4. [DOI] [PMC free article] [PubMed] [Google Scholar]
- 39.Schneider EH, Seifert R. Sf9 cells: a versatile model system to investigate the pharmacological properties of G protein-coupled receptors. Pharmacol Ther. 2010;128:387–418. doi: 10.1016/j.pharmthera.2010.07.005. [DOI] [PubMed] [Google Scholar]
- 40.Müller CE, Schiedel AC, Baqi Y. Allosteric modulators of rhodopsin-like G protein-coupled receptors: opportunities in drug development. Pharmacol Ther. 2012;135:292–315. doi: 10.1016/j.pharmthera.2012.06.002. [DOI] [PubMed] [Google Scholar]
- 41.Katritch V, Rueda M, Lam PC, Yeager M, Abagyan R. GPCR 3D homology models for ligand screening: lessons learned from blind predictions of adenosine A2A receptor complex. Proteins. 2010;78:197–211. doi: 10.1002/prot.22507. [DOI] [PMC free article] [PubMed] [Google Scholar]
- 42.Lacher SK, Mayer R, Sichardt K, Nieber K, Müller CE. Interaction of valerian extracts of different polarity with adenosine receptors: identification of isovaltrate as an inverse agonist at A1 receptors. Biochem Pharmacol. 2007;73:248–258. doi: 10.1016/j.bcp.2006.09.029. [DOI] [PubMed] [Google Scholar]
- 43.Schumacher B, Scholle S, Hölzl J, Khudeir N, Hess S, Müller CE. Lignans isolated from valerian: identification and characterization of a new olivil derivative with partial agonistic activity at A1 adenosine receptors. J Nat Prod. 2002;65:1479–1485. doi: 10.1021/np010464q. [DOI] [PubMed] [Google Scholar]
- 44.Klaasse E, de Ligt RA, Roerink SF, Lorenzen A, Milligan G, Leurs R, IJzerman AP. Allosteric modulation and constitutive activity of fusion proteins between the adenosine A1 receptor and different 351Cys-mutated Giα subunits. Eur J Pharmacol. 2004;499:91–98. doi: 10.1016/j.ejphar.2004.07.108. [DOI] [PubMed] [Google Scholar]
- 45.Xu F, Wu H, Katritch V, Han GW, Jacobson KA, Gao ZG, Cherezov V, Stevens RC. Structure of an agonist-bound human A2A adenosine receptor. Science. 2011;332:322–327. doi: 10.1126/science.1202793. [DOI] [PMC free article] [PubMed] [Google Scholar]
- 46.Rasmussen SG, DeVree BT, Zou Y, Kruse AC, Chung KY, Kobilka TS, Thian FS, Chae PS, Pardon E, Calinski D, Mathiesen JM, Shah ST, Lyons JA, Caffrey M, Gellman SH, Steyaert J, Skiniotis G, Weis WI, Sunahara RK, Kobilka BK. Crystal structure of the β2 adrenergic receptor–Gs protein complex. Nature. 2011;477:549–555. doi: 10.1038/nature10361. [DOI] [PMC free article] [PubMed] [Google Scholar]
- 47.Rasmussen SG, Choi HJ, Fung JJ, Pardon E, Casarosa P, Chae PS, Devree BT, Rosenbaum DM, Thian FS, Kobilka TS, Schnapp A, Konetzki I, Sunahara RK, Gellman SH, Pautsch A, Steyaert J, Weis WI, Kobilka BK. Structure of a nanobody-stabilized active state of the β2 adrenoceptor. Nature. 2011;469:175–180. doi: 10.1038/nature09648. [DOI] [PMC free article] [PubMed] [Google Scholar]
- 48.Hillmann P, Ko GY, Spinrath A, Raulf A, von Kügelgen I, Wolff SC, Nicholas RA, Kostenis E, Holtje HD, Müller CE. Key determinants of nucleotide-activated G protein-coupled P2Y2 receptor function revealed by chemical and pharmacological experiments, mutagenesis and homology modeling. J Med Chem. 2009;52:2762–2775. doi: 10.1021/jm801442p. [DOI] [PubMed] [Google Scholar]
- 49.Matherne GP, Linden J, Byford AM, Gauthier NS, Headrick JP. Transgenic A1 adenosine receptor overexpression increases myocardial resistance to ischemia. Proc Natl Acad Sci U S A. 1997;94:6541–6546. doi: 10.1073/pnas.94.12.6541. [DOI] [PMC free article] [PubMed] [Google Scholar]
- 50.de Graaf C, Foata N, Engkvist O, Rognan D. Molecular modeling of the second extracellular loop of G-protein coupled receptors and its implication on structure-based virtual screening. Proteins. 2008;71:599–620. doi: 10.1002/prot.21724. [DOI] [PubMed] [Google Scholar]
- 51.Katritch V, Cherezov V, Stevens RC. Diversity and modularity of G protein-coupled receptor structures. Trends Pharmacol Sci. 2012;33:17–27. doi: 10.1016/j.tips.2011.09.003. [DOI] [PMC free article] [PubMed] [Google Scholar]
- 52.Scholl DJ, Wells JN. Serine and alanine mutagenesis of the nine native cysteine residues of the human A1 adenosine receptor. Biochem Pharmacol. 2000;60:1647–1654. doi: 10.1016/S0006-2952(00)00474-3. [DOI] [PubMed] [Google Scholar]
- 53.Schülein R, Westendorf C, Krause G, Rosenthal W. Functional significance of cleavable signal peptides of G protein-coupled receptors. Eur J Cell Biol. 2012;91:294–299. doi: 10.1016/j.ejcb.2011.02.006. [DOI] [PubMed] [Google Scholar]
- 54.Wallin E, von Heijne G. Properties of N-terminal tails in G-protein coupled receptors: a statistical study. Protein Eng. 1995;8:693–698. doi: 10.1093/protein/8.7.693. [DOI] [PubMed] [Google Scholar]
- 55.Köchl R, Alken M, Rutz C, Krause G, Oksche A, Rosenthal W, Schülein R. The signal peptide of the G protein-coupled human endothelin B receptor is necessary for translocation of the N-terminal tail across the endoplasmic reticulum membrane. J Biol Chem. 2002;277:16131–16138. doi: 10.1074/jbc.M111674200. [DOI] [PubMed] [Google Scholar]
- 56.Alken M, Rutz C, Kochl R, Donalies U, Oueslati M, Furkert J, Wietfeld D, Hermosilla R, Scholz A, Beyermann M, Rosenthal W, Schulein R. The signal peptide of the rat corticotropin-releasing factor receptor 1 promotes receptor expression but is not essential for establishing a functional receptor. Biochem J. 2005;390:455–464. doi: 10.1042/BJ20050113. [DOI] [PMC free article] [PubMed] [Google Scholar]
- 57.Michino M, Abola E, GPCR Dock 2008 participants, Brooks CL III, Dixon JS, Moult J, Stevens RC (2009) Community-wide assessment of GPCR structure modelling and ligand docking: GPCR Dock 2008. Nat Rev Drug Discov 8:455–463 [DOI] [PMC free article] [PubMed]
Associated Data
This section collects any data citations, data availability statements, or supplementary materials included in this article.
Supplementary Materials
[3H]Adenine binding (10 nM) to membrane preparations of rat cortical membranes (100 μg protein) in the presence of different DMSO concentrations. Data represent means ± SEM of three independent experiments performed in triplicates or in duplicates. Results of one-way ANOVA: non-significantly different p = 0.673 (JPEG 35 kb)
(TIFF 6027 kb)
Multiple sequence alignment of 26 human and rodent Mrg receptors, including Mas and all known adenine receptors, generated using Clustal W. (*) identical amino acid residues; (:) conserved amino acid substitution; (.) semi-conserved amino acid substitution. Amino acid residues are given in the one-letter code (DOCX 29 kb)
Results from homologous competition binding of adenine to wt and mutant rat AdeRs expressed in Sf9 cells vs [3H]adenine (10 nM). Presented pIC50 values are means ± SEM from 3–7 independent experiments performed in triplicates (also see Table 1). The level of significance was determined by an unpaired t-test, ns: non-significant; p > 0.05; * p < 0.05; ***p < 0.001 (JPEG 26 kb)
(TIFF 4385 kb)
[35S]GTPγS binding studies at wt and mutant rat adenine receptors coexpressed with mammalian G proteins. Adenine-induced effects on [35S]GTPγS binding at the wt rat adenine receptor and its mutants F110A, N115A, N173A, F179A, F195A, H252A, and Y268A. The radioligand [35S]GTPγS was used at a concentration of 0.5 nM. The results shown represent means ± SEM from 3–5 independent experiments performed in triplicates. EC50 and Emax values are listed in Table 2 (JPEG 23 kb)
(TIFF 4153 kb)