

Background: The prescription of probiotics as obesity and diabetes therapy is limited because of insufficient efficacy data and lack of understanding of their mechanism of action.
Results: The probiotic VSL#3 prevents obesity and diabetes in mice via induction of butyrate and GLP-1.
Conclusion: Probiotics modulate the gut flora to elicit beneficial metabolic effects.
Significance: Administration of probiotics represents a viable treatment option for obesity and diabetes.
Keywords: Diabetes, Leptin, Metabolism, Obesity, Probiotics, GLP-1, Gut Flora
Abstract
Obesity and diabetes are associated with excess caloric intake and reduced energy expenditure resulting in a negative energy balance. The incidence of diabetes has reached epidemic proportions, and childhood diabetes and obesity are increasing alarmingly. Therefore, it is important to develop safe, easily deliverable, and economically viable treatment alternatives for these diseases. Here, we provide data supporting the candidacy of probiotics as such a therapeutic modality against obesity and diabetes. Probiotics are live bacteria that colonize the gastrointestinal tract and impart beneficial effects for health. However, their widespread prescription as medical therapies is limited primarily because of the paucity of our understanding of their mechanism of action. Here, we demonstrate that the administration of a probiotic, VSL#3, prevented and treated obesity and diabetes in several mouse models. VSL#3 suppressed body weight gain and insulin resistance via modulation of the gut flora composition. VSL#3 promoted the release of the hormone GLP-1, resulting in reduced food intake and improved glucose tolerance. The VSL#3-induced changes were associated with an increase in the levels of a short chain fatty acid (SCFA), butyrate. Using a cell culture system, we demonstrate that butyrate stimulated the release of GLP-1 from intestinal L-cells, thereby providing a plausible mechanism for VSL#3 action. These findings suggest that probiotics such as VSL#3 can modulate the gut microbiota-SCFA-hormone axis. Moreover, our results indicate that probiotics are of potential therapeutic utility to counter obesity and diabetes.
Introduction
Obesity and type 2 diabetes are complex diseases that involve genetic susceptibility and risk factors such as calorific diets and sedentary life styles (1–4). Recent studies are suggestive of a role for the gut flora in the pathogenesis of obesity and type 2 diabetes (5–7). Studies in animal models and humans show that obesity promotes the growth of the Firmicutes strain and reduces the proportion of Bacteriodetes strain in the gut (5, 8–11). Implantation of gut flora from obese mice into normal and germ-free mice results in increased body weight gain and insulin resistance (11, 12), supporting the notion that the bacterial species residing in the obese gut harbor metabolically unfavorable properties. Changes in the microbiota are correlated with the development of obesity, insulin resistance, and diabetes, presumably because of the ability of the microbes to extract energy from the diet (11), altered fatty acid metabolism within the adipose tissue and liver (13), changes in the levels of gut hormones like peptide YY (14), activation of lipopolysaccharide toll-like receptor-2 (15), and changes in the intestinal barrier integrity (16). Therefore, modulation of gut flora composition represents a potentially attractive treatment option against obesity and diabetes.
Probiotics are live microbes that transmit health-beneficial effects through modulation of the gut microbiota and are generally recognized as safe (GRAS) for human consumption (17, 18). However, the widespread prescription of probiotics as medical therapies is lacking chiefly because of the paucity in our understanding of their mechanisms of action and a lack of efficacy data. Ingestion of probiotics is known to offer protection from various chronic diseases, e.g. atherogenesis, allergy, and inflammatory bowel diseases (19, 20). However, the use of probiotics to counter obesity and diabetes is highly debated (21–23).
Here, we provide evidence supporting the dietary supplementation of probiotics as a treatment and management strategy against diabetes and obesity. We show that administration of the probiotic VSL#3 to high fat diet-fed (HFD)3 mice reduced food intake and protected from body weight gain and insulin resistance. In addition, VSL#3 administration was able to reverse obesity and diabetes in a HFD mouse model and in leptin-deficient Lepob/ob mice. Moreover, we demonstrate that administration of VSL#3 led to modulation of gut flora composition and a rise in the hormone GLP-1. The beneficial effects of VSL#3 were associated with an increase in the levels of a short chain fatty acid (SCFA), butyrate. Using a cell culture system, we further demonstrate that butyrate promoted the release of GLP-1 from intestinal L-cells. These results support the notion that the probiotic-gut flora-butyrate-GLP-1 axis promotes metabolic efficiency and protects from the deleterious effects of high fat diet-induced obesity and diabetes.
EXPERIMENTAL PROCEDURES
Animal Studies
C57J/B6 male mice used in the present study (n = 7 in each group) were purchased from The Jackson Laboratory (Bar Harbor, Maine). Preventive studies were conducted on 4–6-week-old male mice fed with a low fat diet (LFD; 4.3% (w/w) fat content, 10 kcal %; product D12450B, Research Diets Inc., New Brunswick, NJ) or a high fat diet (HFD; 34% (w/w) fat content, 60 kcal %; D12492, Research Diets Inc.) with and without VSL#3 (dissolved in PBS at a dose of 5 mg/kg body weight) by oral gavage for 8 weeks. VSL#3 is manufactured by Tau Sigma, Gaithersburg, MD, and was purchased online. VSL#3 was dissolved in PBS, and control mice were treated with equal volumes of PBS.
For the therapeutic model, we purchased male mice from The Jackson Laboratory (Bar Harbor, Maine) that were fed a HFD (D12492) for 13 weeks. The mice were divided into four groups (n = 9 in each group); two groups were fed with LFD with or without VSL#3, and two groups were continued on HFD with or without VSL#3 for 8 weeks. 4–6-week-old male Lepob/ob mice were also purchased from The Jackson Laboratory and were divided into VSL#3-treated and non-treated groups. Control animals that were not administered VSL#3 were given an oral dose of the same volume of PBS. Food intake studies were performed in individually caged mice by measuring diet consumed every week after normalizing diet spilled in the cage. All of the animal studies were conducted according to National Institutes of Health animal care guidelines and were approved by the NIDDK/NIH Animal Care and Use Committee.
Body Composition
Body composition was measured using an Echo3-in-1 NMR analyzer (Echo Medical Systems LLC, Houston, TX) in non-anesthetized mice.
Glucose and Insulin Tolerance Tests
For the glucose tolerance test, animals fasted overnight were injected intraperitoneally with glucose solution (2 mg/kg body weight). For the insulin tolerance test, fed mice were injected with human insulin (HumulinR, 0.75 unit/kg body weight). Blood glucose was measured at 0, 15, 30, 60, and 120 min.
Blood and Serum Biochemistry
Blood glucose was measured using a glucometer (Bayer Diagnostics), and serum total cholesterol, triglycerides, and free fatty acids were measured using Wako Diagnostic kits. Serum insulin, adiponectin, resistin, IL-6, MCP-1, PAI-1, and TNF-α were measured using BioPlex adipokine kits (Millipore). Serum gut hormones were measured using a gut hormone Bio-Plex kit (Millipore). Active GLP-1 in serum and cell supernatants was measured using an ELISA kit from Millipore.
Measurements of Hepatic Triglyceride Content
Liver fat was extracted by the method described by Folch et al. (24), and triglycerides were measured as described above.
Histological Analysis
Epididymal white adipose tissue and liver tissues were fixed in 10% neutral formalin, processed in paraffin blocks, sectioned at 6 μm, and stained with hematoxylin and eosin. Slides were scanned with a ScanScope machine (Aperio, Vista, CA), and mean adipocyte size was measured using Aperio software.
Fecal DNA Isolation and Microbial Gene Analysis
Fecal pellets were collected from individual mice in a sterile tube and immediately frozen until further use. DNA was isolated, using a DNeasy kit (Qiagen), from fecal samples as well as from cecum, intestinal fluid, and intestinal wall scrapings. Real time PCR was performed to measure the microbial community using microbe-specific primers (supplemental Table S3). The results are presented as percent of bacterial DNA abundance normalized by total bacterial DNA and compared with controls.
Real Time PCR Analysis
Total RNA was extracted from tissues and cells using an RNeasy kit, and reverse transcription reactions were performed using a cDNA high capacity kit from Applied Biosystems (ABI) for complementary cDNA synthesis. Real time PCR was performed using an ABI platform with a 20-μl total reaction volume that included 100–1000 ng of cDNA and each primer at 100–200 nm (supplemental Table S3) plus 10 μl of 2× SYBR Green Master Mix (Applied Biosystems). The fold changes in gene expression were calculated with β-actin as an internal control and using the ddCt method. All of the reactions were performed in triplicates.
Western Blot Analysis
The Western blotting procedure is described elsewhere (25). Primary antibodies for Stat3 (catalogue No. 9132) and phosphorylated Stat3 (catalogue No. 9145S) were from Cell Signaling, Inc.
LC/ESI/MS Analysis of SCFAs in Feces
For detection and measurement of SCFAs in fecal samples of mice, we used a method developed by Parise et al. (26). We used the LTQ-FT system (Thermo Scientific, Waltham, MA) that is equipped with a Phenomenex Synergi Polar-RP column (Phenomenex, Torrance, CA). The results are calculated in nmol/mg of fecal sample.
SCFA Analysis of Mice Plasma and Feces after VSL#3 Administration
Diet-induced obese male mice were purchased at 11 weeks old from The Jackson Laboratory. The mice were divided into four groups (n = 6 in each group); two groups were fed with LFD with or without VSL#3 (5 mg/kg body weight), and two groups were continued on HFD with or without VSL#3 for 4 weeks. VSL#3 group mice were given a daily oral dose of 5 mg/kg body weight of VSL#3 dissolved in PBS for 4 weeks, and control mice were given the same volume of PBS orally. Body weight and fasting glucose were measured at 0, 2, and 4 weeks. Plasma and feces were collected at 0, 2, and 4 weeks to measure the butyrate level and for butyrate-producing bacteria analysis, respectively.
The SCFA analysis performed on the mice plasma was a modification of the protocol described elsewhere (27). Because of the minute amount of sample (11–80 mg was analyzed, whereas the referenced method used 400 μl of plasma), the entire sample was transferred into a 2-ml vial and the weight recorded. The internal standard was spiked (with 2-ethylbutyric acid, Aldrich). The sample was acidified with HCl and vortexed. The sample was extracted twice with ether. The two ether phases were combined, and the SCFAs were derivatized with MTBSTFA (N-tert-butyldimethylsilyl-N-methyltrifluoroacetamide) with 1% t-BDMCS (tert-butyldimethylchlorosilane) at 40 °C for 2 h. The sample was then concentrated at room temperature under a stream of nitrogen to a final volume of approximately 100 μl. The derivatized sample was analyzed on a GC-MS (Thermo Trace GC Ultra-ISQ mass spectrometer) with an Rxi-5 ms 30 m × 0.25 mm ID, 0.25-μm coating (Restek). The GC program starting at 40 °C was heated at 5 °C/min to 70 °C, then held for 3.5 min, and then ramped at 20 °C/min to 160 °C followed by 35 °C/min to 280 °C and holding for 3 min. Butyric acid was measured at 145 m/z with 146 m/z as the confirmation mass, and 2-ethylbutyric acid was measured at 173 m/z. Butyric acid was quantified with a five-point calibration curve.
Butyrate Kinase (buk) Gene Expression in Feces and Butyrate Analysis in Plasma
The buk gene expression in the feces was measured by real-time qPCR after total DNA was extracted from feces (28). The primers for buk gene expression (supplemental Table S4) were designed according to the reference (50). Amplification and detection were carried out in 96-well plates with SYBR Green PCR 2× Master Mix (Applied Biosystems). Each reaction was run in duplicate in a final volume of 20 μl with 800 nm forward primers (buk-5F1 and buk-5F2, each at 400 nm), 1400 nm reverse primers (400 nm buk-6R1, 200 nm buk-6R2, and 800 nm buk-6R3), 1 μl of template, and 4.6 μl of water. The cycling conditions consisted of 5 min of incubation at 95 °C followed by 40 cycles of denaturation at 95 °C for 30 s, annealing at 52 °C for 30 s, and extension at 71 °C for 30 s. The level of buk gene expression was normalized to the level of total bacteria content assessed using total bacterial gene primer sets (29).
Cell Culture and GLP-1 Secretion Studies
NCI-H716 cells were grown in Dulbecco modified Eagle's medium supplemented with 10% FBS and 1% penicillin/streptomycin at 37 °C and 5% CO2. For GLP-1 secretion assay, cells grown in poly-d-lysine-coated plates were incubated overnight with 1, 2, 5, and 10 mm butyrate (Sigma, catalogue No. B5887). Media and cells were harvested for the GLP-1 secretion assay and gene expression analysis.
Statistical Analysis
All of the data are expressed as mean ± S.E. Statistical significance among the groups was calculated using a two-tailed t test and/or one-way analysis of variance followed by post hoc tests (i.e. least significant difference and Bonferroni correction), and p < 0.05 was considered statistically significant.
RESULTS
VSL#3 Feeding Protected from HFD-induced Adiposity and Glucose Intolerance
Six-week-old wild-type C57Bl6 male mice were fed on a HFD for 8 weeks with or without oral gavage administration of the probiotic VSL#3 three times a week. VSL#3 suppressed body weight gain equivalent to that of mice fed on a LFD (Fig. 1a and supplemental Fig. S1a). VSL#3 significantly decreased the fat depot size (Table 1), fat mass, and adipocyte size (Fig. 1, b and c, and supplemental Fig. S1c) without a significant change in lean mass (supplemental Fig. S1b). Furthermore, VSL#3 treatment induced a significant decrease in fasting and fed blood glucose levels (Table 1), enhanced glucose tolerance (Fig. 1d and supplemental Fig. S1d) and insulin tolerance (Fig. 1e andsupplemental Fig. S1e), and suppressed hyperinsulinemia (Table 1). VSL#3 decreased serum triglyceride and free fatty acid levels (Table 1) and reduced fat accumulation in the liver (hepatic steatosis) (Fig. 1f and supplemental Fig. S1f). VSL#3 feeding significantly decreased resistin and increased adiponectin levels in HFD-fed mice (Table 1). VSL#3 significantly decreased the circulating levels of inflammatory cytokines, i.e. IL-6, MCP-1, and TNF-a (Table 1), suggesting that VSL#3 reduced the inflammatory state that is often associated with obesity and insulin resistance. These beneficial metabolic effects of VSL#3 were associated with a significant decrease in food intake (Fig. 1g). These findings show that VSL#3 feeding enhanced glucose homeostasis while reducing food intake and body weight gain.
FIGURE 1.

VSL#3 prevented high fat diet-induced obesity and diabetes. a and b, VSL#3 administration reduced body weight gain (a) and fat mass (b) in HFD-fed mice. HFD+VSL#3-fed mice maintained body weight and fat mass similar to LFD-fed mice. c, adipocyte size is smaller in HFD+VSL#3-fed mice than in HFD-fed control mice. d and e, VSL#3 treatment in HFD-fed mice enhanced glucose homeostasis as shown by improved glucose tolerance tests (d) and insulin tolerance tests (e). f, VSL#3 administration in HFD-fed mice dramatically reduced hepatic steatosis in comparison with non-treated control HFD mice (fat droplets indicated by red arrows) and maintained liver morphology similar to LFD-fed mice. g, VSL#3-fed HFD mice exhibited reduced food intake. Values presented here represent the mean ± S.E. for each group. Values indicated with asterisks are significantly different at the level of: *, p < 0.05; **, p < 0.001; and ***, p < 0.0001. Values indicated with hash marks are significantly different at the level of: #, p < 0.05; ##, p < 0.001; and ###, p < 0.0001 from HFD-fed animals.
TABLE 1.
Physiological and serum biochemical effects of VSL#3 treatment in high fat diet-fed mice
Values presented here are mean ± S.E. (n = 7). **, different in comparison with LFD; ##, different in comparison with HFD.
| Measures | LFD | HFD | HFD + VSL#3 |
|---|---|---|---|
| Body weight gain (g) | 11.2 ± 1.02 | 23.2 ± 0.92 | 9.3 ± 1.03 |
| Organ weight (g) | |||
| Epididymal fat pad | 0.25 ± 0.02 | 0.78 ± 0.04** | 0.31 ± 0.07## |
| Retroperitoneal fat pad | 0.12 ± 0.04 | 0.33 ± 0.01** | 0.14 ± 0.02## |
| Subscapular fat pad | 0.17 ± 0.03 | 0.21 ± 0.01 | 0.18 ± 0.03 |
| Anterior subcutaneous | 0.21 ± 0.03 | 0.33 ± 0.02** | 0.23 ± 0.03## |
| Posterior subcutaneous | 0.19 ± 0.03 | 0.23 ± 0.01 | 0.18 ± 0.02 |
| Spleen | 0.11 ± 0.05 | 0.10 ± 0.01 | 0.11 ± 0.02 |
| Quadriceps muscle | 0.22 ± 0.04 | 0.23 ± 0.05 | 0.22 ± 0.05 |
| Liver | 1.23 ± 0.09 | 1.64 ± 0.1** | 1.21 ± 0.08## |
| Fasting blood glucose (mg/dl) | 60 ± 9.12 | 91 ± 10.34** | 72 ± 11.23## |
| Fed blood glucose (mg/dl) | 126 ± 12.13 | 178 ± 15.12** | 132 ± 10.41## |
| Serum insulin (pm) | 521.2 ± 26.3 | 1016.2 ± 51.2** | 500.9 ± 34.9## |
| Total cholesterol (mg/dl) | 54.8 ± 9.2 | 60.2 ± 12.3 | 52.4 ± 11.3 |
| Triglycerides (mg/dl) | 140.9 ± 12.4 | 302.5 ± 31.3** | 175.1 ± 27.1## |
| Free fatty acids (μm) | 588.2 ± 34.2 | 1121.3 ± 102.3** | 761.1 ± 73.2## |
| Adiponectin (μg/ml) | 22.2 ± 2.1 | 19.1 ± 4.2 | 26.3 ± 2.23## |
| Resistin (pg/ml) | 650.2 ± 24.2 | 982.5 ± 46.4** | 622.4 ± 44.3## |
| IL-6 (pg/ml) | 5.2 ± 1.1 | 10.2 ± 1.5** | 6.8 ± 1.3## |
| MCP-1 (pg/ml) | 60.3 ± 3.4 | 103.2 ± 6.2** | 81.2 ± 6.4## |
| PAI-1 (pg/ml) | 2532.1 ± 123.4 | 2723.5 ± 412.3 | 2445.9 ± 334.4 |
| TNF-α (pg/ml) | 67.2 ± 5.2 | 102.3 ± 9.3** | 72.4 ± 11.2## |
Therapeutic Effects of VSL#3 against HFD-induced Obesity and Diabetes
We next investigated whether the VSL#3 treatment could be therapeutic in reducing adiposity and restoring glucose homeostasis in obese mice. Diet-induced obese (DIO) mice were divided into four groups and fed either a LFD or continued on a HFD with or without VSL#3 administration for 8 weeks. VSL#3 ingestion significantly reduced body weight gain and fat mass (Fig. 2a and b), with no change in lean mass (Fig. S2b), in both LFD- and HFD-fed mice in comparison with their age-matched counterparts that did not get the VSL#3 dosing regimen (Fig. 2, a and b, supplemental Fig. S2a, and supplemental Table S1). VSL#3 administration also reduced adipocyte size (Fig. 2c and supplemental Fig. S2c) and improved glucose and insulin tolerance in obese mice (Fig. 2, d and e, and supplemental Fig. S2, d and e). In addition, VSL#3 feeding enhanced metabolic function as evidenced by reduced levels of insulin, triglyceride, free fatty acids, and resistin along with increased levels of adiponectin and an improved inflammatory response (supplemental Table S1). Further, VSL#3 ameliorated hepatic steatosis in HFD-fed mice (Fig. 2f and supplemental Fig. S2, f and g). The improved metabolic function was associated with reduced food intake (Fig. 2g and supplemental Table S1). Together, these results suggest that VSL#3 administration (i) protects against HFD-induced obesity and glucose intolerance and (ii) reverses existing obesity and diabetes in a HFD mouse model.
FIGURE 2.

VSL#3 reversed obesity and diabetes in HFD-fed mice. a and b, VSL#3 administration in DIO mice suppressed body weight gain (a) and fat mass (b). Beneficial effects of VSL#3 were also seen in mice switched to LFD. c, administration of VSL#3 reduced adipocyte size in white adipose tissue. d and e, glucose tolerance (d) and insulin tolerance (e) were significantly enhanced in VSL#3-treated DIO mice. f, hepatic steatosis was improved in VSL#3-treated DIO mice in both HFD- and LFD-fed groups as compared with their corresponding controls. g, VSL#3 treatment also decreased food intake in DIO mice. The values presented here represent the mean ± S.E. for each group. Values indicated with asterisks are significantly different at the level of: *, p < 0.05; **, p < 0.001; and ***, p < 0.0001.
VSL#3 Ameliorated Obesity and Diabetes in Lepob/ob Mice
Leptin levels are proportional to fat mass, and we observed reduced leptin levels (Fig. 3a and b) in VSL#3-administered HFD-fed mice exhibiting reduced fat mass (Figs. 1b and 2b). Levels of Stat3 phosphorylation were increased in the hypothalamus, indicative of enhanced leptin receptor signaling upon VSL#3 treatment (Fig. 3c). Further, we observed a dramatic switch in the expression of food intake-regulating genes, i.e. agouti-related protein (AgRP), neuropeptide Y (NpY), and pro-opiomelanocortin (POMC), in the hypothalamus of VSL#3-treated mice in both the preventive and therapeutic studies (Fig. 3d and supplemental Fig. S3a). VSL#3-treated mice exhibited significantly reduced the hunger-inducing genes, i.e. AgRP and NpY, whereas the expression of the satiety gene, POMC, was strongly induced (Fig. 3d and supplemental Fig. S3a), suggesting that VSL#3 treatment modulated central food intake mechanisms in the hypothalamus.
FIGURE 3.

Leptin levels in VSL#3-administered mice and effects of VSL#3 on obesity and diabetes in Lepob/ob mice. a and b, leptin levels upon VSL#3 treatment in the preventive (a) and therapeutic model (b). c, VSL#3 enhanced Stat3 phosphorylation in the hypothalamus of HFD-fed mice in comparison with HFD control mice. d, expression levels of food intake regulatory genes, i.e. AgRP, NpY, and POMC, were significantly modulated in the hypothalamus of VSL#3-treated mice compared with their control mice. e and f, Lepob/ob mice administered VSL#3 exhibited a significant reduction in body weight gain (e) and fat mass (f) compared with Lepob/ob mice not fed VSL#3. g and h, improved glucose tolerance tests (g) and insulin tolerance tests (h) in VSL#3-treated Lepob/ob mice compared with Lepob/ob mice not fed VSL#3. i, hepatic fat accumulation was substantially decreased in VSL#3-treated Lepob/ob mice. j, VSL#3-fed Lepob/ob mice exhibited decreased food intake. The values presented here represent the mean ± S.E. for each group. Values indicated with asterisks are significantly different at the level of: *, p < 0.05; **, p < 0.001; and ***, p < 0.0001.
To explore the role of leptin in VSL#3 actions, we tested the effects of VSL#3 in leptin-deficient mice (Lepob/ob mice). Upon 9 weeks of VSL#3 treatment, we observed a significant decrease in body weight gain, size of fat depots, fat mass, adipocyte size, liver triglycerides and hepatic steatosis in Lepob/ob mice (Fig. 3, e, f, and i, and supplemental Figs. S4, a and b, and S5d). In addition, we observed improved glucose homeostasis in terms of decreased blood glucose levels (supplemental Table S2) and improved glucose and insulin tolerance tests (Fig. 3, g and h, and supplemental Fig. S5, b and c), with no change in lean mass (supplemental Fig. S5a). VSL#3 suppressed food intake (Fig. 3j), and a significant decrease in AGRP and dramatic increase in POMC gene expression in the hypothalami of VSL#3-treated mice was observed (supplemental Fig. S3b). These results demonstrate that VSL#3 was able to ameliorate obesity and diabetes in Lepob/ob mice, suggesting that leptin-independent mechanisms underlie the actions of VSL#3.
VSL#3 Promotes Butyrate-mediated GLP-1 Secretion from Intestinal L-cells
Considering that it modifies the gut microbiota, we hypothesized that VSL#3 administration might also result in changes in the level of gut hormones. To delineate the plausible mechanism of VSL#3 action we measured the levels of gut hormones that regulate food intake (30). We found that the hunger-inducing hormone ghrelin was decreased (supplemental Fig. S6a), whereas the hunger-reducing hormone GLP-1 was dramatically increased in VSL#3-treated mice compared with HFD-fed control mice (Fig. 4a), with moderate or no change in other gut hormones, i.e. PYY3–36, amylin, gastric inhibitory polypeptide (GIP), and pancreatic peptide (PP) (supplemental Fig. S6a). In addition, we observed a significant increase in GLP-1 levels in the therapeutic models (DIO and Lepob/ob mice) described above (Fig. 4a and supplemental Fig. S6, b and c). These results demonstrate that increased GLP-1 levels correlate with the beneficial metabolic effects of VSL#3.
FIGURE 4.

VSL#3 altered gut flora composition and increased butyrate and GLP-1 levels. a, VSL#3 feeding dramatically increased serum GLP-1 levels in the three mouse models (preventive, therapeutic, and Lepob/ob mice). b, specific bacterial abundance, i.e. Firmicutes, Bacteriodetes, lactobacilli, and bifidobacteria, was significantly changed upon VSL#3 treatment. Abundance of bacteria in mice on either LFD or HFD, with or without VSL#3, is shown (black, LFD; red, HFD; light blue, HFD + VSL3). c–e, VSL#3 administration significantly increased butyrate levels in fecal samples of HFD-fed mice (c and d) and in Lepob/ob mice (e). f, genes implicated in GLP-1 synthesis and secretion (i.e. Gcg, Pcsk1, and Slc5a1) and butyrate-responsive gene (i.e. Ffar3) were significantly increased in different parts of the intestine from VSL#3-fed mice. g and h, butyrate treatment of NCI-H716 cells significantly increased GLP-1 secretion in a dose-dependent manner (g) and increased GLP-1 synthesis and secretion and butyrate-responsive gene expression (h). The values presented here represent the mean ± S.E. for each group. Values indicated with asterisks are significantly different at the level of: *, p < 0.05; **, p < 0.001; and ***, p < 0.0001.
To understand the mechanism underlying the increase in GLP-1 levels, we examined the abundance of specific bacterial species (i.e. Firmicutes, Bacteriodetes, lactobacilli, and bifidobacteria) in different parts of the intestine (i.e. cecum and small and large intestine) and in the feces of mice treated with VSL#3. We found a significant reduction in Firmicutes and a noteworthy increase in Bacteriodetes and bifidobacteria (with no change in lactobacilli) in the gastrointestinal tract and feces of all of the three mouse models administered VSL#3, i.e. the preventive (Fig. 4b and supplemental Fig. S7, a–e), therapeutic (supplemental Fig. S8, a–f), and Lepob/ob (supplemental Fig. S9, a–f) models. These results suggest that VSL#3 feeding promoted the colonization of a metabolically beneficial gut flora even in the face of a HFD challenge. Further, we observed an increase in the expression of GLP-1 synthesis genes (proglucagon (Gcg) and pro-protein convertase 1 (Pcsk1)) and GLP-1 secretion genes (sodium/glucose cotransporter or solute carrier family 5 member 1 (Slc5a1)) in the jejunum, ileum, and colon of VSL#3-treated mice (Fig. 4f). We found similar trend in all of the three mouse models treated with VSL#3 (supplemental Figs. S10, a–g , S11, a–k , and S12, a–k).
We next set out to examine the mechanisms linking the changes in the gut flora composition to increased circulating levels of GLP-1. We hypothesized that VSL#3 treatment might alter the composition of bacterial metabolites, i.e. short chain free fatty acids. We tested this notion by evaluating the abundance of SCFAs in the fecal samples using mass spectrometry techniques. Interestingly, the levels of the SCFA butyrate were significantly increased in all three VSL#3-treated mouse models (Fig. 4, c–e), clearly suggesting that changes in the gut flora composition lead to an altered metabolic environment in the gut.
We measured the abundance of butyrate-producing bacteria by assaying the gene expression of butyrate kinase (buk) after 2 and 4 weeks of VSL#3 ingestion and compared those levels with the levels seen in the LFD and HFD controls. Interestingly, buk expression was significantly increased in VSL#3-treated LFD- and HFD-fed mice by 2 weeks of VSL#3 ingestion (supplemental Fig. S13), suggesting that VSL#3 feeding increased the total abundance of butyrate-producing bacteria.
Further, we measured plasma butyrate levels from DIO mice and control LFD-fed mice that were orally administered VSL#3 or PBS daily for 2 weeks. Butyrate levels were significantly higher in mice treated with VSL#3 compared with mice administered control PBS (supplemental Fig. S14). Thus, 4 of 6 mice in both the DIO and LFD groups that were administered VSL#3 exhibited increased plasma butyrate levels (levels > 10% from base line; average 60–90% increase over base line). In contrast, none of the DIO or LFD mice fed a control PBS vehicle showed an increase in plasma butyrate levels (all <10% change from base line). Together, these results suggest that production and bioavailability of butyrate was substantially increased in VSL#3-administered mice.
To further confirm the interaction of butyrate and the rise in GLP-1 levels, we used the human L-cell line NCI-H716 and measured its GLP-1 secretion and synthesis capacity. Butyrate treatment of NCI-H716 cells resulted in enhanced secretion of GLP-1 (Fig. 4g). Further, we observed a butyrate-induced increase in expression of genes involved in GLP-1 synthesis (Gcg and Pcsk1) and secretion (Slc5a1) (Fig. 4h). Interestingly, we also observed increased expression of the free fatty acid receptor 3 (Ffar3) in VSL#3-treated intestinal tissues as well as in butyrate-treated NCI-H716 cells (Fig. 4h), with no change in the expression levels of other genes (supplemental Fig. S15), suggesting that butyrate interaction on L-cells might be mediated via Ffar3.
DISCUSSION
Probiotics are food supplements that confer beneficial effects under various clinical conditions (31, 32) inclusive of atherogenesis, allergy, and inflammatory bowel diseases (19, 20). However, the widespread use of probiotics against obesity and diabetes is lacking (21–23), primarily because of insufficient mechanistic insight and a paucity of efficacy data in small animal models. We addressed this issue in the present study and evaluated the preventive and therapeutic effects of the probiotic VSL#3 against obesity and diabetes. We show that VSL#3 protected against HFD-induced diabetes and obesity and also reversed existing obesity and diabetes in DIO mice and Lepob/ob mice. The beneficial metabolic effects of VSL#3 were elicited via changes in the microflora population resident in the gut of VSL#3-treated mice. Mice administered VSL#3 exhibited increased levels of the short chain fatty acid butyrate. This was correlated with an elevated level of the gut hormone GLP-1, which confers beneficial metabolic effects and protects against obesity, diabetes, and hepatic steatosis.
Pathways that regulate food intake and energy homeostasis are a rational target for the development of novel therapies against obesity and diabetes (33). The role of the gut-brain axis in regulating food intake is an area of active research (34, 35). VSL#3 induced Stat3-mediated leptin signaling in the hypothalamus and modulated the gene expression of hypothalamic target genes. However, VSL#3 was able to correct the glucose intolerance and adiposity in Lepob/ob mice, suggesting that VSL#3 action might involve leptin-independent effects. Detailed studies evaluating the action of leptin upon central nervous system stimulation in VSL#3-treated obese mice are needed to evaluate the leptin-dependent effects of VSL#3.
It is known that the anti-inflammatory role of probiotics helps in treating low grade inflammation (36). Inflammation is co-incident with obesity and diabetes (37), and it is plausible that the observed reduction in the inflammatory response in VSL#3-treated animals (Table 1 and supplemental Tables S1 and S2) might in part account for the overall beneficial phenotype seen in VSL#3-treated animals. A point worth noting is that in all experiments where VSL#3 was administered we observed a reduction in food intake and body weight. These findings represent a bias in interpreting the degree of insulin sensitivity, as typically leaner mice are more insulin-sensitive than heavier mice. We propose that the bulk of the VSL#3 beneficial effects are attributable to the reduction in food intake and body weight suppression, which in turn promoted insulin sensitivity in the treated mice. It is possible that VSL#3 actions do not directly lead to reduced inflammation and improvement of insulin sensitivity.
Although we did not detect significant differences in food intake between LFD control and VSL#3 LFD mice (Fig. 2g), we observed reductions in fat mass and body weight gain (Fig. 2, a and b). We postulate that the increased metabolic rate may account for these effects. Indeed, increased GLP-1 levels are associated with higher resting energy expenditure and enhanced fat oxidation rates in humans (38). In addition, we observed significantly increased POMC levels and suppressed NpY and AgRP levels in the hypothalamus of VSL#3-treated mice. Increased POMC and decreased NpY/AgRP signals are correlated with changes in energy expenditure and fat oxidation (39). Thus, taken together, the actions of GLP-1 and/or changes in these central nervous system signals might play an important role in weight loss and reduced fat mass in VSL#3-treated LFD-fed mice. Further, more direct studies are needed to distinguish between these possibilities.
Probiotics transmit their major effects through the modulation of the gut flora (40). The gastrointestinal tract is dominated by anaerobic bacteria belonging primarily to the three bacterial phyla: Firmicutes, Bacteriodetes, and Actinobacteria (23). More than 90% of the normal gut flora is represented by Firmicutes and Bacteriodetes phyla (41). Increased Firmicutes and decreased Bacteriodetes are associated with weight gain and insulin resistance (9). Our results show that VSL#3 feeding decreased the Firmicutes and increased Bacteriodetes in fecal samples. Further, the free and adhered amounts of those bacteria were similarly altered in different parts of the intestine, i.e. the cecum and small and large intestines. VSL#3 contains few strains of Lactobacillus and Bifidobacterium; we observed increased bifidobacterial DNA, whereas Lactobacillus-specific DNA abundance was not increased. It is plausible that the Lactobacillus strains in VSL#3 were unable to survive in mice intestines and failed to proliferate in comparison with the bifidobacterial strains and VSL#3-supported Bacteriodetes growth. Further studies with Lactobacillus-depleted VSL#3 are needed to test this hypothesis. The changes in bifidobacteria upon VSL#3 feeding were interesting considering that decreased Bifidobacterium levels have been correlated with increased body weight gain, adiposity, and insulin resistance in various human studies (42–44). However, it is plausible that other bacterial populations are significantly changed upon VSL#3 administration, and further metagenomic studies will provide a comprehensive understanding of the microbiome changes elicited by VSL#3.
The bacterial population residing in the gastrointestinal tract is metabolically active and able to degrade dietary fat, peptides, and fibers yielding metabolite end products, specifically SCFAs (45). Various SCFAs, i.e. acetate, propionate, and butyrate, have differential metabolic effects (46). Further, changing the proportional abundance of these metabolites that operate in close proximity to intestinal cells might produce significant changes in the host cell response. Interestingly, butyrate levels were significantly increased in response to VSL#3 treatments with no changes in other SCFAs. Butyrate exhibits beneficial metabolic effects in the context of obesity and insulin resistance (46, 47), and a recent metagenomic study on obese versus lean subjects showed that butyrate-producing bacterial abundance was substantially decreased in obese subjects (48). Further, oral ingestion of butyrate significantly decreased body weight gain and fat accumulation and enhanced insulin sensitivity in mice (46, 47). Together, these observations suggest that gut-derived butyrate plays an important role in the pathology of obesity and diabetes. It is unclear whether the butyrate is produced by the Bacteriodetes or by other bacteria, and extensive metagenomic analyses are needed to understand the type of bacteria that are responsible for producing butyrate. However, we provide evidence of increased colonization of butyrate-producing bacteria in mice administered VSL#3. Also, the rise in plasma butyrate levels in VSL#3-treated mice suggests that absorption of butyrate from the intestine is not inhibited and the butyrate is not eliminated from the intestine.
We observed that butyrate increased GLP-1 secretion from intestinal L-cells. GLP-1 secretion has been associated with gut flora modulation in other studies (49). However, little is known about the interactions between the gut flora and L-cells and their ability to secrete GLP-1. Our study uncovered a probiotic-gut flora-butyrate-GLP-1 pathway that confers protective metabolic effects. We also observed elevated transcript levels of Ffar3 upon butyrate treatment of L-cells and in VSL#3-treated mouse intestine. A recent study suggests that Ffar3 is a crucial receptor that senses butyrate levels and participates in GLP-1 biology (46). Our findings allow us to propose a model that might explain the VSL#3-mediated improved metabolic effects (Fig. 5). Probiotics (like VSL#3) modulate the gut flora composition (i.e. decreased Firmicutes and increased Bacteriodetes and bifidobacteria) and lead to improved metabolic efficacy. The altered gut microbiota stimulates differential production of SCFAs (like butyrate) that in turn promote GLP-1 secretion from L-cells to improve metabolic health and protect from obesity and diabetes. The studies proposed here will further justify the utility of probiotics, especially those that have the ability to positively influence the gut-SCFA-hormone axis, to prevent and treat obesity and diabetes. The possibility that dietary supplementation of probiotics can modify the gut flora and result in changes in the levels of short chain fatty acids that promote a release of hormones like GLP-1 will further stimulate research aimed at understanding the mechanism of action of other beneficial probiotics.
FIGURE 5.
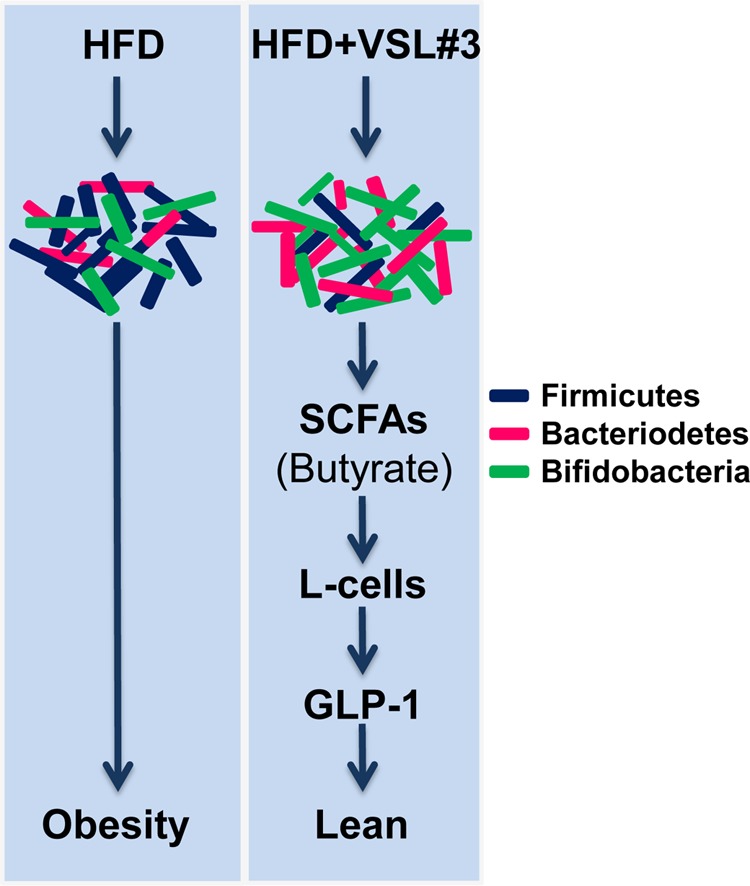
Proposed mechanism of action of VSL#3 against obesity and diabetes. VSL#3 feeding significantly changed the composition of the gut flora, i.e. decreased Firmicutes (dark blue rods) and increased Bacteriodetes (red rods) and bifidobacteria (green rods). This change in the microbiota is associated with increased butyrate production. Butyrate further increased GLP-1 secretion from intestinal L-cells that ultimately enhanced metabolic function to prevent obesity and diabetes in the three mouse models studied.
Acknowledgments
We thank Marc Reitman for stimulating discussions and critical reading of the manuscript. We also thank Dr. Thomas Ried for providing NCI-H716 cells.
This work was supported, in whole or in part, by the National Institutes of Health from the Intramural Program of NIDDK.

This article contains supplemental Figs. S1–S15 and Tables S1–S4.
- HFD
- high fat diet
- SCFA
- short chain fatty acid
- LFD
- low fat diet
- DIO
- diet-induced obese
- Ffar3
- free fatty acid receptor 3.
REFERENCES
- 1. Belkina A. C., Denis G. V. (2010) Obesity genes and insulin resistance. Curr. Opin. Endocrinol. Diabetes Obes. 17, 472–477 [DOI] [PMC free article] [PubMed] [Google Scholar]
- 2. Ding S., Lund P. K. (2011) Role of intestinal inflammation as an early event in obesity and insulin resistance. Curr. Opin. Clin. Nutr. Metab. Care 14, 328–333 [DOI] [PMC free article] [PubMed] [Google Scholar]
- 3. Kim M. S., Lee M. S., Kown D. Y. (2011) Inflammation-mediated obesity and insulin resistance as targets for nutraceuticals. Ann. N.Y. Acad. Sci. 1229, 140–146 [DOI] [PubMed] [Google Scholar]
- 4. Lin C. Y., Chen P. C., Kuo H. K., Lin L. Y., Lin J. W., Hwang J. J. (2010) Effects of obesity, physical activity, and cardiorespiratory fitness on blood pressure, inflammation, and insulin resistance in the National Health and Nutrition Survey 1999–2002. Nutr. Metab. Cardiovasc. Dis. 20, 713–719 [DOI] [PubMed] [Google Scholar]
- 5. Esteve E., Ricart W., Fernández-Real J. M. (2011) Gut microbiota interactions with obesity, insulin resistance and type 2 diabetes: did gut microbiote co-evolve with insulin resistance? Curr. Opin. Clin. Nutr. Metab. Care 14, 483–490 [DOI] [PubMed] [Google Scholar]
- 6. Manco M., Putignani L., Bottazzo G. F. (2010) Gut microbiota, lipopolysaccharides, and innate immunity in the pathogenesis of obesity and cardiovascular risk. Endocr. Rev. 31, 817–844 [DOI] [PubMed] [Google Scholar]
- 7. Musso G., Gambino R., Cassader M. (2010) Obesity, diabetes, and gut microbiota: the hygiene hypothesis expanded? Diabetes Care 33, 2277–2284 [DOI] [PMC free article] [PubMed] [Google Scholar]
- 8. Bäckhed F., Ding H., Wang T., Hooper L. V., Koh G. Y., Nagy A., Semenkovich C. F., Gordon J. I. (2004) The gut microbiota as an environmental factor that regulates fat storage. Proc. Natl. Acad. Sci. U.S.A. 101, 15718–15723 [DOI] [PMC free article] [PubMed] [Google Scholar]
- 9. Bajzer M., Seeley R. J. (2006) Physiology: obesity and gut flora. Nature 444, 1009–1010 [DOI] [PubMed] [Google Scholar]
- 10. Turnbaugh P. J., Hamady M., Yatsunenko T., Cantarel B. L., Duncan A., Ley R. E., Sogin M. L., Jones W. J., Roe B. A., Affourtit J. P., Egholm M., Henrissat B., Heath A. C., Knight R., Gordon J. I. (2009) A core gut microbiome in obese and lean twins. Nature 457, 480–484 [DOI] [PMC free article] [PubMed] [Google Scholar]
- 11. Turnbaugh P. J., Ley R. E., Mahowald M. A., Magrini V., Mardis E. R., Gordon J. I. (2006) An obesity-associated gut microbiome with increased capacity for energy harvest. Nature 444, 1027–1031 [DOI] [PubMed] [Google Scholar]
- 12. Ley R. E., Bäckhed F., Turnbaugh P., Lozupone C. A., Knight R. D., Gordon J. I. (2005) Obesity alters gut microbial ecology. Proc. Natl. Acad. Sci. U.S.A. 102, 11070–11075 [DOI] [PMC free article] [PubMed] [Google Scholar]
- 13. Velagapudi V. R., Hezaveh R., Reigstad C. S., Gopalacharyulu P., Yetukuri L., Islam S., Felin J., Perkins R., Boren J., Oresic M., Backhed F. (2010) The gut microbiota modulates host energy and lipid metabolism in mice. J. Lipid Res. 51, 1101–1112 [DOI] [PMC free article] [PubMed] [Google Scholar]
- 14. Diamant M., Blaak E. E., de Vos W. M. (2011) Do nutrient-gut-microbiota interactions play a role in human obesity, insulin resistance and type 2 diabetes? Obes. Rev. 12, 272–281 [DOI] [PubMed] [Google Scholar]
- 15. Caricilli A. M., Picardi P. K., de Abreu L. L., Ueno M., Prada P. O., Ropelle E. R., Hirabara S. M., Castoldi Â., Vieira P., Camara N. O., Curi R., Carvalheira J. B., Saad M. J. (2011) Gut microbiota is a key modulator of insulin resistance in TLR 2 knockout mice. PLoS Biol. 9, e1001212. [DOI] [PMC free article] [PubMed] [Google Scholar] [Retracted]
- 16. Cani P. D., Possemiers S., Van de Wiele T., Guiot Y., Everard A., Rottier O., Geurts L., Naslain D., Neyrinck A., Lambert D. M., Muccioli G. G., Delzenne N. M. (2009) Changes in gut microbiota control inflammation in obese mice through a mechanism involving GLP-2-driven improvement of gut permeability. Gut 58, 1091–1103 [DOI] [PMC free article] [PubMed] [Google Scholar]
- 17. Reid G., Sanders M. E., Gaskins H. R., Gibson G. R., Mercenier A., Rastall R., Roberfroid M., Rowland I., Cherbut C., Klaenhammer T. R. (2003) New scientific paradigms for probiotics and prebiotics. J. Clin. Gastroenterol. 37, 105–118 [DOI] [PubMed] [Google Scholar]
- 18. Fooks L. J., Gibson G. R. (2002) Probiotics as modulators of the gut flora. Br. J. Nutr. 88, Suppl. 1, S39–S49 [DOI] [PubMed] [Google Scholar]
- 19. Nagpal R., Kumar A., Kumar M., Behare P. V., Jain S., Yadav H. (2012) Probiotics, their health benefits and applications for developing healthier foods: a review. FEMS Microbiol. Lett. 334, 1–15 [DOI] [PubMed] [Google Scholar]
- 20. Rijkers G. T., de Vos W. M., Brummer R. J., Morelli L., Corthier G., Marteau P. (2011) Health benefits and health claims of probiotics: bridging science and marketing. Br. J. Nutr. 106, 1291–1296 [DOI] [PubMed] [Google Scholar]
- 21. Raoult D. (2009) Probiotics and obesity: a link? Nat. Rev. Microbiol. 7, 616. [DOI] [PubMed] [Google Scholar]
- 22. Delzenne N., Reid G. (2009) No causal link between obesity and probiotics. Nat. Rev. Microbiol. 7, 901. [DOI] [PubMed] [Google Scholar]
- 23. Ehrlich S. D. (2009) Probiotics: little evidence for a link to obesity. Nat. Rev. Microbiol. 7, 901. [DOI] [PubMed] [Google Scholar]
- 24. Folch J., Lees M., Sloane Stanley G. H. (1957) A simple method for the isolation and purification of total lipides from animal tissues. J. Biol. Chem. 226, 497–509 [PubMed] [Google Scholar]
- 25. Lin H. M., Lee J. H., Yadav H., Kamaraju A. K., Liu E., Zhigang D., Vieira A., Kim S. J., Collins H., Matschinsky F., Harlan D. M., Roberts A. B., Rane S. G. (2009) Transforming growth factor-β/Smad3 signaling regulates insulin gene transcription and pancreatic islet β-cell function. J. Biol. Chem. 284, 12246–12257 [DOI] [PMC free article] [PubMed] [Google Scholar]
- 26. Parise R. A., Shawaqfeh M., Egorin M. J., Beumer J. H. (2008) Liquid chromatography-mass spectrometric assay for the quantitation in human plasma of ABT-888, an orally available, small molecule inhibitor of poly(ADP-ribose) polymerase. J. Chromatogr. B Analyt. Technol. Biomed. Life Sci. 872, 141–147 [DOI] [PMC free article] [PubMed] [Google Scholar]
- 27. Moreau N. M., Goupry S. M., Antignac J. P., Monteau F. J., Le Bizec B. J., Champ M. M., Martin L. J., Dumon H. J. (2003) Simultaneous measurement of plasma concentrations and 13C-enrichment of short-chain fatty acids, lactic acid, and ketone bodies by gas chromatography coupled to mass spectrometry. J. Chromatogr. B Analyt. Technol. Biomed. Life Sci. 784, 395–403 [DOI] [PubMed] [Google Scholar]
- 28. Metzler-Zebeli B. U., Hooda S., Pieper R., Zijlstra R. T., van Kessel A. G., Mosenthin R., Gänzle M. G. (2010) Nonstarch polysaccharides modulate bacterial microbiota, pathways for butyrate production, and abundance of pathogenic Escherichia coli in the pig gastrointestinal tract. Appl. Environ. Microbiol. 76, 3692–3701 [DOI] [PMC free article] [PubMed] [Google Scholar]
- 29. Castillo M., Martín-Orúe S. M., Manzanilla E. G., Badiola I., Martín M., Gasa J. (2006) Quantification of total bacteria, enterobacteria, and lactobacilli populations in pig digesta by real-time PCR. Vet. Microbiol. 114, 165–170 [DOI] [PubMed] [Google Scholar]
- 30. le Roux C. W., Aylwin S. J. B., Batterham R. L., Borg C. M., Coyle F., Prasad V., Shurey S., Ghatei M. A., Patel A. G., Bloom S. R. (2006) Gut hormone profiles following bariatric surgery favor an anorectic state, facilitate weight loss, and improve metabolic parameters. Ann. Surg. 243, 108–114 [DOI] [PMC free article] [PubMed] [Google Scholar]
- 31. Yadav H., Jain S., Sinha P. R. (2007) Antidiabetic effect of probiotic dahi containing Lactobacillus acidophilus and Lactobacillus casei in high fructose fed rats. Nutrition 23, 62–68 [DOI] [PubMed] [Google Scholar]
- 32. Mengheri E. (2008) Health, probiotics, and inflammation. J. Clin. Gastroenterol. 42, Suppl. 3, S177–S178 [DOI] [PubMed] [Google Scholar]
- 33. Kazaks A., Stern J. S. (2003) Obesity: food intake. Prim. Care 30, 301–316 [DOI] [PubMed] [Google Scholar]
- 34. Rosas-Vargas H., Martínez-Ezquerro J. D., Bienvenu T. (2011) Brain-derived neurotrophic factor, food intake regulation, and obesity. Arch. Med. Res. 42, 482–494 [DOI] [PubMed] [Google Scholar]
- 35. Hussain S. S., Bloom S. R. (2013) The regulation of food intake by the gut-brain axis: implications for obesity. Int. J. Obes. (Lond.) 37, 625–633 [DOI] [PubMed] [Google Scholar]
- 36. Spiller R. (2005) Probiotics: an ideal anti-inflammatory treatment for IBS? Gastroenterology 128, 783–785 [DOI] [PubMed] [Google Scholar]
- 37. Fehervari Z. (2012) Bridging inflammation in obesity. Nat. Immunol. 13, 946 [Google Scholar]
- 38. Pannacciulli N., Bunt J. C., Koska J., Bogardus C., Krakoff J. (2006) Higher fasting plasma concentrations of glucagon-like peptide 1 are associated with higher resting energy expenditure and fat oxidation rates in humans. Am. J. Clin. Nutr. 84, 556–560 [DOI] [PubMed] [Google Scholar]
- 39. Belgardt B. F., Okamura T., Brüning J. C. (2009) Hormone and glucose signalling in POMC and AgRP neurons. J. Physiol. 587, 5305–5314 [DOI] [PMC free article] [PubMed] [Google Scholar]
- 40. Delzenne N. M., Neyrinck A. M., Bäckhed F., Cani P. D. (2011) Targeting gut microbiota in obesity: effects of prebiotics and probiotics. Nat. Rev. Endocrinol. 7, 639–646 [DOI] [PubMed] [Google Scholar]
- 41. Brown J. P. (1977) Role of gut bacterial flora in nutrition and health: a review of recent advances in bacteriological techniques, metabolism, and factors affecting flora composition. CRC Crit. Rev. Food Sci. Nutr. 8, 229-336 [DOI] [PubMed] [Google Scholar]
- 42. Kalliomäki M., Collado M. C., Salminen S., Isolauri E. (2008) Early differences in fecal microbiota composition in children may predict overweight. Am. J. Clin. Nutr. 87, 534–538 [DOI] [PubMed] [Google Scholar]
- 43. Collado M. C., Isolauri E., Laitinen K., Salminen S. (2008) Distinct composition of gut microbiota during pregnancy in overweight and normal-weight women. Am. J. Clin. Nutr. 88, 894–899 [DOI] [PubMed] [Google Scholar]
- 44. Wu X., Ma C., Han L., Nawaz M., Gao F., Zhang X., Yu P., Zhao C., Li L., Zhou A., Wang J., Moore J. E., Millar B. C., Xu J. (2010) Molecular characterisation of the faecal microbiota in patients with type II diabetes. Curr. Microbiol. 61, 69–78 [DOI] [PubMed] [Google Scholar]
- 45. Schwiertz A., Taras D., Schafer K., Beijer S., Bos N. A., Donus C., Hardt P. D. (2010) Microbiota and SCFA in lean and overweight healthy subjects. Obesity (Silver Spring) 18, 190–195 [DOI] [PubMed] [Google Scholar]
- 46. Lin H. V., Frassetto A., Kowalik E. J., Jr., Nawrocki A. R., Lu M. M., Kosinski J. R., Hubert J. A., Szeto D., Yao X., Forrest G., Marsh D. J. (2012) Butyrate and propionate protect against diet-induced obesity and regulate gut hormones via free fatty acid receptor 3-independent mechanisms. PloS One 7, e35240. [DOI] [PMC free article] [PubMed] [Google Scholar]
- 47. Gao Z., Yin J., Zhang J., Ward R. E., Martin R. J., Lefevre M., Cefalu W. T., Ye J. (2009) Butyrate improves insulin sensitivity and increases energy expenditure in mice. Diabetes 58, 1509–1517 [DOI] [PMC free article] [PubMed] [Google Scholar]
- 48. Qin J., Li Y., Cai Z., Li S., Zhu J., Zhang F., Liang S., Zhang W., Guan Y., Shen D., Peng Y., Zhang D., Jie Z., Wu W., Qin Y., Xue W., Li J., Han L., Lu D., Wu P., Dai Y., Sun X., Li Z., Tang A., Zhong S., Li X., Chen W., Xu R., Wang M., Feng Q., Gong M., Yu J., Zhang Y., Zhang M., Hansen T., Sanchez G., Raes J., Falony G., Okuda S., Almeida M., LeChatelier E., Renault P., Pons N., Batto J. M., Zhang Z., Chen H., Yang R., Zheng W., Yang H., Wang J., Ehrlich S. D., Nielsen R., Pedersen O., Kristiansen K. (2012) A metagenome-wide association study of gut microbiota in type 2 diabetes. Nature 490, 55–60 [DOI] [PubMed] [Google Scholar]
- 49. Cani P. D., Lecourt E., Dewulf E. M., Sohet F. M., Pachikian B. D., Naslain D., De Backer F., Neyrinck A. M., Delzenne N. M. (2009) Gut microbiota fermentation of prebiotics increases satietogenic and incretin gut peptide production with consequences for appetite sensation and glucose response after a meal. Am. J. Clin. Nutr. 90, 1236–1243 [DOI] [PubMed] [Google Scholar]
- 50. Zhu X. (October 2, 2007) U. S. Patent 7,276,358 B1