

Abstract
Protein identification by mass spectrometry is widely used in biological research. Here, we describe how the Global Proteome Machine (GPM) can be used for protein identification and for validation of the results. We cover identification by searching protein sequence collections and spectral libraries, as well as validation of the results using expectation values, rho-diagrams, and spectrum databases.
Keywords: proteomics, mass spectrometry, protein identification, spectrum libraries, validation
1. Introduction
Mass spectrometry based protein identification has become an invaluable tool for elucidating protein function, and several methods have been developed for protein identification, including: sequence collection searching with masses of peptides or their fragments, spectral library searching, and de novo sequencing (Fig. 1).
Figure 1. Mass spectrometry based workflows for protein identification.

A) searching a protein sequence collection with peptide mass information; B) searching a protein sequence collection with peptide fragment mass information; C) searching a spectrum library with peptide fragment mass information; D) de novo sequencing.
The first step in protein identification is to find peaks in the mass spectra that correspond to peptides and their fragments. It is important to find all the relevant peaks and at the same time minimizing the number of background peaks. This can be achieved by scanning the spectra for peaks of the expected width and selecting peaks above a signal to noise threshold (see Note 1), and then picking the monoisotopic peak for each isotope cluster (see Note 2). After picking the peaks, spectra with low information content that could not produce any meaningful results can be removed to increase the speed of subsequent analysis (1).
The first method for protein identification developed was peptide mass fingerprinting, PMF (2), i.e. matching measured proteolytic peptide masses to the theoretical proteolytic peptide masses of proteins in a sequence collection and calculating a score based on the matching peptides (see Note 3 and Fig. 1A). A basis of peptide mass fingerprinting is that the mass measurement of a single proteolytic peptide matches the masses of only a few different proteolytic peptide sequences (3). For example, a mass around 2000 Da measured with an accuracy of 1 ppm matches on the average 4 and 1.5 unmodified tryptic peptides in the entire proteome of human and yeast, respectively (Fig. 2). A single peptide mass measurement is typically not matched uniquely with a single protein species and is therefore not sufficient to identify a protein (the probability for more than one protein identified =1). But, a set of measured peptide masses from a single digested protein is useful for identification, since the probability is <<1 of randomly matching these mass values to a protein sequence in the collection searched. In theory, not only single proteins but also a large portion of the proteins in a complex protein mixture can be identified by the PMF approach (4). However, in practice mass spectrometers fail to detect simultaneously peptides originating from different sample proteins that differ significantly in abundance (5). Hence, a prerequisite for PMF-based protein identification is that the samples analyzed are reasonably pure and only contain a few different proteins (6).
Figure 2. The information value of a mass measurement.

The number of unmodified tryptic peptides as a function of peptide mass for different mass accuracies for A) human and C) yeast. The distribution of number of matching unmodified tryptic peptides at mass 2000 Da and mass accuracy of 1 ppm for B) human and D) yeast.
A more robust method for complex protein mixtures is to search sequence collections using the observed mass of an intact individual peptide ion species together with the masses of the fragment ions observed upon inducing fragmentation of the peptide in the mass spectrometer (Fig. 1B). This method requires only one or a few identified peptides to identify a gene. Peptides are fragmented by increasing their internal energy, usually through collisions. When their internal energy is increased, peptides fragment along their backbone, and ions characteristic of the amino acid sequence and the activation method are produced. The masses of these ions are compared with the theoretical fragment masses of the peptides in the sequence collection that match the mass of the intact peptide, and a score is calculated based on the matching fragments (7, 8). This method is based on the method developed for identifying organic molecules from their fragment mass spectra (9-11). The advantage of using a sequence collection is that it is not necessary to observe fragmentation next to every amino acid in the peptide; a few fragment ions are usually sufficient because the sequence collection can be used to fill in the missing information (See Note 4). The drawback is, however, that if the sequence is not in the sequence collection, it cannot be found using this method, but as more and more complete genome sequences are becoming available, this becomes less of an issue. The probability of fragmentation between a pair of adjacent amino acids is dependent on their chemical properties and to a lesser degree on the amino acids further away from the fragmentation site; therefore the intensity of fragment ions is highly sequence dependent. The information in the peak intensities cannot fully be utilized when searching protein sequence collections, because most implementations use the same intensity for all theoretical fragments due to the difficulty in accurately predicting their relative intensities from the amino acid sequence.
One way of utilizing the sequence specific fragment ion intensities and thereby improving the sensitivity is to instead search spectrum libraries (Fig. 1C), i.e. large collections of experimentally acquired fragment mass spectra that have been annotated. This is currently the predominant method for identification of small organic molecules (12), and has during the last few years been applied to peptide identification (13, 14). In this method the intensity information is fully utilized (see Note 5), because the matching is between two experimentally acquired fragment mass spectra, and therefore this is the most sensitive of the identification methods. The challenge is, however, to collect large high-quality sets of spectra that have sufficient coverage of the proteome.
In cases, when the genome has not been sequenced and there are no spectrum libraries available, the only possibility is to use de novo sequencing (Fig. 1D), i.e. use only the information in the fragment mass spectra and the mass of the intact peptide to obtain the peptide sequences (15-18). This requires much higher quality data because the entire space of all possible sequences is the search space (see Note 6). To search the entire space of potential sequences is impractical even for short peptides, but several algorithms have been developed that attempt at searching the relevant part of the search space in a reasonable time frame (15-18).
In all mass spectrometry based identification methods, a score is calculated to quantify the match between the observed mass spectrum and the collection of possible sequences. These scores are highly dependent on the details of the algorithm used, and they are not always easy to interpret, because the interpretation of the score depends on properties of the data and the search results. Therefore, it is desirable to convert the score to a measure that is easy to interpret, such as the probability that the result is random and false. For this conversion, the distribution of random and false scores is needed (Fig. 3). Estimates of this distribution can be generated using either simulations (19, 20), collecting statistics during the search (21-23), or direct calculations (24).
Figure 3. Expectation values.

The score can be transformed to an expectation value, i.e. the number of peptides that through random matching generate the score, if the distribution of random scores is known. This random distribution can be obtained for expectation values > 1 by collecting statistics during the search because most peptides in a sequence collection match a given mass spectrum purely through random matching. Estimating expectation values < 1 can be done by fitting the tail of the distribution to a Gumbel distribution and extrapolating.
Here, we describe how the different components of the Global Proteome Machine (GPM) can be used for protein and peptide identification and validation.
2. Methods
2.1. Searching protein sequence collections
X! Tandem (25-27) is a search engine for identifying proteins by searching sequence collections. X! Tandem scores the match between an observed tandem mass spectrum and a peptide sequence, by calculating a score that is based on the intensities of the fragment ions and the number of matching b- and y-ions (see Note 7). This score is converted to an expectation value using the distribution of the scores of randomly matching peptides (Fig. 3). Before the search, the user needs to specify a set of parameters including which sequence collection to search, the mass accuracy of peptides and their fragments, and modifications of the peptide sequence (see Note 8). The search is done iteratively: only proteins, that have at least one peptide identified in an iteration, are searched in subsequent iterations (25). This iterative search can be used to speed up and increase the sensitivity of the identification of modifications, non-specific enzymatic cleavage, and point mutations by restricting the search to unmodified tryptic peptides in the first iteration, and then widening the search in subsequent iterations. Another way to speed up the searches and make them more sensitive is to restrict the search to proteotypic peptides using X! P3 (27), which searches only peptides that have been previously identified and deposited in the GPM DataBase (GPMDB) (28).
2.2. Searching spectrum libraries
X! Hunter (13) is a search engine for searching annotated spectrum libraries. X! Hunter uses the same scoring as X! Tandem, except for that it compares the observed mass spectrum to libraries of spectra derived from experiments. Therefore, the peptide sequence dependent intensity information can be fully utilized, and the sensitivity of the search is increased. It is, however, critical that the spectrum libraries are constructed carefully. The libraries for X! Hunter are constructed by taking the fragment mass spectra from GPMDB and grouping them so that one library spectrum is constructed for each peptide, modification, and charge state. The selection criteria are that (i) the spectrum matches to a peptide with an expectation value less than 0.001 and (ii) at least 40% of the ion intensity in a spectrum is assignable as y- or b-ions or their corresponding neutral loss products. For the selected spectra, the m/z values of the matching peaks are substituted with the exact theoretical values. The 10 spectra with lowest expectation value are selected for each peptide, modification and charge state, and a composite spectrum is created and added to the library. These annotated spectrum libraries can also be extended to modification that do not affect the fragmentation pattern (e.g. some types of stable isotope labeling), by using the ion intensities of the fragmented unmodified peptide and reassigning the m/z values to correspond to the modified peptide.
2.3. Validation of results
The search results for all GPM search engines are displayed in a unified interface that allows the user to get an overview of the results as well as inspect the details of the results when needed. In the basic display, proteins for which there is evidence for their presence in the sample are listed. The strength of the evidence is quantified with an expectation value (see Note 9) (23), and the proteins are listed in the order of increasing expectation value, i.e. in the order of decreasing strength of the evidence. Other information that can be used to assess the identified proteins are also shown, including the sum of the intensity of the matching fragment ions for all peptides, the number of matching peptides, and the fraction of the protein sequence covered by the observed peptides. Details of the evidence for a protein can be displayed, listing all matching peptides sequences, modifications and charge state together with the peptide expectation values, error in the mass measurement, and the sum of the intensity of the fragment ions matching to the peptide sequences. For an individual peptide the annotated fragment mass spectrum can be displayed showing the peak assignments. There are also alternative ways to display the list of identified protein, including their distribution among gene ontology categories, pathways, and protein interaction networks. In these displays, a p-value is calculated to asses which gene ontology categories, pathways, or interactions are enriched or depleted in the data set.
Comparison of identification results to the large set of search results collected in GPMDB is an effective way to validate the results. One way to use GPMDB, is to visually compare the peptides observed for a protein to observations in other experiments in GPMDB (Fig. 4). Commonly, the same peptides are observed for a given protein in most proteomics experiments, and therefore an observation of a peptide that has not been observed in other experiments should be investigated manually. Another way of validating search results is to compare the sequence dependent ion intensity distribution of tandem mass spectra to spectra in GPMDB to evaluate if the fragmentation pattern is similar (Fig. 5). Several frequency measures from GPMDB for proteins and peptides are also reported together with the search results. For peptides, the number of times it has been observed in GPMDB, at and the fraction of the peptide identifications which are in a specific charge state (ω) are used. For proteins, Ω, a measure of peptide coverage with respect to charge state is used. Ω is a list of ratios denoting what fraction of the peptides in a particular charge state for a given protein were seen in a single protein identification. Proteins expectation values are also compared to other identifications of the protein in GPMDB and the rank is reported, allowing the user to judge how their result compares to other results. All these measures are shown to make the validation of the results easier by allowing detailed comparison with the large set of experimental results that are available in GPMDB.
Figure 4. Using proteotypic peptides for validation of identification results.
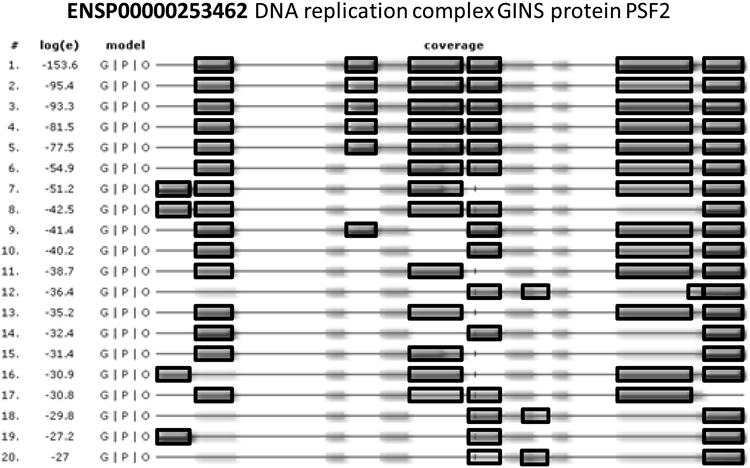
The peptides identified for a protein can be compared to observations in other experiments in GPMDB. Commonly, the same peptides are observed for a given protein in proteomics experiments, and therefore an observation of a peptide that has not been observed in other experiments should be investigated manually. The peptides observed for PSF2, a protein associated with the replication fork, are shown with black borders and regions of the protein that are difficult to observe in proteomics experiments are shown without borders. In a majority of the 20 experiments shown, the same 5 peptides are observed.
Figure 5. Using tandem mass spectra for validation of identification results.
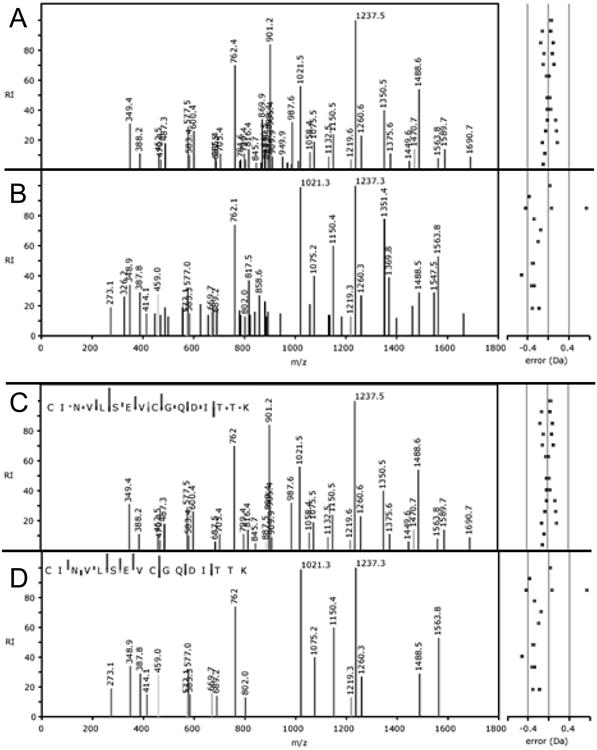
The intensity distribution of tandem mass spectra is mainly dependent on the peptide sequence. Therefore, comparing a fragment mass spectrum to spectra in GPMDB can be used for validation of the results. A,C) A stronger (log(e) = −12.8) and B,D) a weaker (log(e) = −3.6) spectrum matching to the sequence CINVLSEVCGQDITTK are shown (A,B - all peaks C,D - peaks matching the sequence). The stronger spectrum has many peaks matching the peptide sequence and little background, while the weaker spectrum has fewer matching peaks and more background peaks, but the intensity profile of the matching peaks is similar.
The information in GPMDB can also be used to design experiments. It is advisable to start planning an experiment by inspecting the information associated with proteins of interest to find out what has been observed in other proteomics experiments. For example, GPMDB supports the design of experiments targeted to investigate a group of proteins (Multiple Reaction Monitoring, MRM). Through the MRM module, the information in GPMDB is used to aid in the selection of peptides and their fragment ions that produce a strong signal and are specific to the protein.
The quality of the overall match between the whole data set and the sequence collection can be evaluated using p-diagrams and ρ-scores (29). A ρ-diagram is a comparison between the distribution of peptide expectation values for a data set and the predicted distribution for random matching (see Note 10). For a data set that only has random matches to a sequence collection, the data points in the ρ-diagram will fall on the diagonal, ρ = log(e), i.e. the expectation values for the peptides are distribution as expected from random matching (Fig. 6A). In contrast, for data sets that are high quality, typically many peptides match well with the sequence collection, and the data points in the ρ-diagram deviate from the diagonal and are closer to log(e) = 0 (Fig. 6B). The ρ-score corresponding to a ρ-diagram is defined as the area between the data points and the diagonal (ρ = log(e)) normalized to a value between 0 and 100, where ρ-score of 0 corresponds to purely random matching and ρ-score of 100 corresponds to no random matching. The ρ-score, being a measure of the quality of a match between an entire data set and a sequence collection, can be used for optimizing search parameters, evaluating algorithms, and for quality control of data sets.
Figure 6. ρ-diagram.

A ρ-diagram shows the quality of the match between a data set and a proteome. A) The data points are close to the line ρ = log(e) when the results are dominated by random matching between the data and the proteome. The three data sets shown were obtained by searching against a collection of reversed sequences. B) Three data sets of different quality are shown (ρ-scores are 95, 87, 57 respectively). The highest quality data set (filled circles) is closest to the line log(e) = 0 and the lowest quality data set (open squares) is closest to the line ρ = log(e).
Acknowledgments
This work was supported by funding provided by the National Institutes of Health Grants RR00862 and RR022220.
Footnotes
Peaks in mass spectra are detected by finding local maxima in over the expected peak width wl for each point, l, in the spectrum, where l(k) is the measured intensity at a point k, 0 ≤ k ≤ N, 0 ≤ l ≤ N, and N is the total number of points in the mass spectrum. The signal to noise ratio (the ratio of the root mean square deviation of the peak and of the background) is usually used to decide if the peak should be used for identification. The mass of an analyte can be determined using the centroid, is the mass to charge ratio at a point k) of the corresponding peak in the mass spectrum, where w′ is the width of the centroid calculation.
Because peptides naturally contain heavy isotopes of atoms (e.g. 1.11% 13C and 0.366% 15N), they are observed as clusters of peaks. The relative intensities of these isotope clusters are dependent on the mass of the peptide because the number of atoms increases with mass and therefore the probability of the peptide containing one or more heavy isotopes increases. The largest effect comes from 13C and a first order estimate of the peak intensities is given by , where Tm is the intensity of peak m in the distribution, m is the number of 13C, n the total number of carbon atoms in the peptide, and p is the probability for 13C (i.e. 1.11%).
The simplest method for peptide mass fingerprinting is to count the number of peptides in the mass spectrum that match to each protein in the sequence collection. This count can then be used as a score to rank the proteins. This simple scoring scheme works well when the data is high-quality, but with low-quality data, typically a large protein will get the highest score due to random matching. This is because the probability for random matching increases with the size of the protein simply because there are more peptides to match. More sophisticated scoring methods that have been developed to attempt at compensating for this effect (24, 30-32).
The sequence collections used for protein identification are based on the genes predicted from the genome sequence, and are therefore a very small subset of all possible sequences. For example, there are # unique tryptic peptides of length 15 in the human proteome compared to 2015 possible unmodified peptides of length 15. Because a vast majority of possible peptides are not used in an organism, the distance between real peptides in sequence space is typically large, and therefore missing information can be filled in using the sequence collection.
Typically the normalized inner product of the two spectra is used to score how well their intensities match. If the spectra are represented as vectors with the number of dimension equal to the number of matching peaks, n, and the length of the vector in each dimension equal to the intensity of the corresponding ion, the dot product is given by where I = (I1, I2, …, In) is the observed spectrum, and L =(L1, L2, …, Ln) is the library spectrum. The range of the normalized dot product is from −1 to 1. If the observed and library spectra are identical the resulting dot product is 1 and any differences between them will result in lower values of the dot product.
The search space for de novo sequencing of unmodified peptides is 20N where N is the length of the peptide. If there are m types of potential modifications then search space increases to (20+m)N.
The score, called hyperscore, is based on the assumption of a hypergeometric distribution and is given by SH = SI · nb! · ny!, where ny is the number of matching y-ions, nb the number of matching b-ions, and SI, is the dot product between the observed spectrum and the spectrum predicted from the peptide sequence. The intensities for the spectrum predicted from the peptide sequence are usually set to 1 for each expected fragment mass and 0 for all other masses. However, X! Tandem also supports using intensities that are dependent on the two amino acids on each side of the fragmented bond.
A complete description of the input parameters for X! Tandem, X! P3 and X! Hunter can be found at http://thegpm.org/TANDEM/api/.
Protein expectation values can be estimated from the expectation values of its matching peptides. If more than one peptide has been found for a protein, the expectation values for the peptides are combined with a simple Bayesian model for the probability of having two peptides from the same protein having the best score in different spectra: , where n is the number of unique peptide sequences matching the protein, ej is the expectation value of the jth peptide, N is the total number of peptides scored to find the n unique peptides, s is the number of mass spectra in data set, and β is N/(the total number of peptides in the proteome considered). If only one peptide is matching the protein, the protein expectation value is set to the peptide expectation value, epro= e1.
ρ is defined as , where i is an integer, i = log(e), e is the expectation value, and Ei is the number of peptides with expectation values between exp(i) and exp(i−1). For purely random matching, , where N is the total number of peptides that have been assigned to spectra, and therefore for random matching.
References
- 1.Flikka K, Martens L, Vandekerckhove J, Gevaert K, Eidhammer I. Improving the reliability and throughput of mass spectrometry-based proteomics by spectrum quality filtering. Proteomics. 2006;6:2086–94. doi: 10.1002/pmic.200500309. [DOI] [PubMed] [Google Scholar]
- 2.Henzel WJ, Billeci TM, Stults JT, Wong SC, Grimley C, Watanabe C. Identifying proteins from two-dimensional gels by molecular mass searching of peptide fragments in protein sequence databases. Proc Natl Acad Sci U S A. 1993;90:5011–5. doi: 10.1073/pnas.90.11.5011. [DOI] [PMC free article] [PubMed] [Google Scholar]
- 3.Fenyo D, Qin J, Chait BT. Protein identification using mass spectrometric information. Electrophoresis. 1998;19:998–1005. doi: 10.1002/elps.1150190615. [DOI] [PubMed] [Google Scholar]
- 4.Eriksson J, Fenyo D. Protein identification in complex mixtures. J Proteome Res. 2005;4:387–93. doi: 10.1021/pr049816f. [DOI] [PubMed] [Google Scholar]
- 5.Eriksson J, Fenyo D. Improving the success rate of proteome analysis by modeling protein-abundance distributions and experimental designs. Nat Biotechnol. 2007;25:651–5. doi: 10.1038/nbt1315. [DOI] [PubMed] [Google Scholar]
- 6.Jensen ON, Podtelejnikov AV, Mann M. Identification of the components of simple protein mixtures by high- accuracy peptide mass mapping and database searching. Anal Chem. 1997;69:4741–50. doi: 10.1021/ac970896z. [DOI] [PubMed] [Google Scholar]
- 7.Eng JK, McCormack AL, Yates JR. An approach to correlate mass spectral data with amino acid sequences in a protein database. J Am Soc Mass Spectrom. 1994;5:976. doi: 10.1016/1044-0305(94)80016-2. [DOI] [PubMed] [Google Scholar]
- 8.Mann M, Wilm M. Error-tolerant identification of peptides in sequence databases by peptide sequence tags. Anal Chem. 1994;66:4390–9. doi: 10.1021/ac00096a002. [DOI] [PubMed] [Google Scholar]
- 9.Duffield AM, Robertson AV, Djerassi C, Buchanan BG, Sutherland GL, Feigenbaum EA, Lederberg J. Applications of Artificial Intelligence for Chemical Inference. II. Interpretation of Low-Resolution Mass Spectra of Ketones. J Am Chem Soc. 1969;91:2977–81. doi: 10.1021/ja00772a005. [DOI] [PubMed] [Google Scholar]
- 10.Lederberg J, Sutherland GL, Buchanan BG, Feigenbaum EA, Robertson AV, Duffield AM, Djerassi C. Applications of Artificial Intelligence for Chemical Inference. I. The Number of Possible Organic Compounds. Acyclic Structures Containing C, H, O, and N. J Am Chem Soc. 1969;91:2973–6. [Google Scholar]
- 11.Schroll G. Applications of Artificial Intelligence for Chemical Inference. III. Aliphatic Ethers Diagnosed by Their Low-Resolution Mass Spectra and Nuclear Magnetic Resonance Data. J Am Chem Soc. 1969;91:2977–81. [Google Scholar]
- 12.Heller S. The history of the NIST/EPA/NIH mass spectral database. Today's Chemist at Work. 1999;8:45–50. [Google Scholar]
- 13.Craig R, Cortens JC, Fenyo D, Beavis RC. Using annotated peptide mass spectrum libraries for protein identification. J Proteome Res. 2006;5:1843–9. doi: 10.1021/pr0602085. [DOI] [PubMed] [Google Scholar]
- 14.Lam H, Deutsch EW, Eddes JS, Eng JK, King N, Stein SE, Aebersold R. Development and validation of a spectral library searching method for peptide identification from MS/MS. Proteomics. 2007;7:655–67. doi: 10.1002/pmic.200600625. [DOI] [PubMed] [Google Scholar]
- 15.Taylor JA, Johnson RS. Sequence database searches via de novo peptide sequencing by tandem mass spectrometry. Rapid Commun Mass Spectrom. 1997;11:1067–75. doi: 10.1002/(SICI)1097-0231(19970615)11:9<1067::AID-RCM953>3.0.CO;2-L. [DOI] [PubMed] [Google Scholar]
- 16.Dancik V, Addona TA, Clauser KR, Vath JE, Pevzner PA. De novo peptide sequencing via tandem mass spectrometry. J Comput Biol. 1999;6:327–42. doi: 10.1089/106652799318300. [DOI] [PubMed] [Google Scholar]
- 17.Ma B, Zhang K, Hendrie C, Liang C, Li M, Doherty-Kirby A, Lajoie G. PEAKS: powerful software for peptide de novo sequencing by tandem mass spectrometry. Rapid Commun Mass Spectrom. 2003;17:2337–42. doi: 10.1002/rcm.1196. [DOI] [PubMed] [Google Scholar]
- 18.Spengler B. De novo sequencing, peptide composition analysis, and composition-based sequencing: a new strategy employing accurate mass determination by fourier transform ion cyclotron resonance mass spectrometry. J Am Soc Mass Spectrom. 2004;15:703–14. doi: 10.1016/j.jasms.2004.01.007. [DOI] [PubMed] [Google Scholar]
- 19.Eriksson J, Chait BT, Fenyo D. A statistical basis for testing the significance of mass spectrometric protein identification results. Anal Chem. 2000;72:999–1005. doi: 10.1021/ac990792j. [DOI] [PubMed] [Google Scholar]
- 20.Elias JE, Gygi SP. Target-decoy search strategy for increased confidence in large-scale protein identifications by mass spectrometry. Nat Methods. 2007;4:207–14. doi: 10.1038/nmeth1019. [DOI] [PubMed] [Google Scholar]
- 21.Field HI, Fenyo D, Beavis RC. RADARS, a bioinformatics solution that automates proteome mass spectral analysis, optimises protein identification, and archives data in a relational database. Proteomics. 2002;2:36–47. [PubMed] [Google Scholar]
- 22.Keller A, Nesvizhskii AI, Kolker E, Aebersold R. Empirical statistical model to estimate the accuracy of peptide identifications made by MS/MS and database search. Anal Chem. 2002;74:5383–92. doi: 10.1021/ac025747h. [DOI] [PubMed] [Google Scholar]
- 23.Fenyo D, Beavis RC. A method for assessing the statistical significance of mass spectrometry-based protein identifications using general scoring schemes. Anal Chem. 2003;75:768–74. doi: 10.1021/ac0258709. [DOI] [PubMed] [Google Scholar]
- 24.Eriksson J, Fenyo D. Probity, A Protein Identification Algorithm with Accurate Assignment of the Statistical Significance of the Results. Journal of Proteome Research. 2004;3:32–36. doi: 10.1021/pr034048y. [DOI] [PubMed] [Google Scholar]
- 25.Craig R, Beavis RC. A method for reducing the time required to match protein sequences with tandem mass spectra. Rapid Commun Mass Spectrom. 2003;17:2310–6. doi: 10.1002/rcm.1198. [DOI] [PubMed] [Google Scholar]
- 26.Craig R, Beavis RC. TANDEM: matching proteins with tandem mass spectra. Bioinformatics. 2004;20:1466–7. doi: 10.1093/bioinformatics/bth092. [DOI] [PubMed] [Google Scholar]
- 27.Craig R, Cortens JP, Beavis RC. The use of proteotypic peptide libraries for protein identification. Rapid Commun Mass Spectrom. 2005;19:1844–50. doi: 10.1002/rcm.1992. [DOI] [PubMed] [Google Scholar]
- 28.Craig R, Cortens JP, Beavis RC. Open source system for analyzing, validating, and storing protein identification data. J Proteome Res. 2004;3:1234–42. doi: 10.1021/pr049882h. [DOI] [PubMed] [Google Scholar]
- 29.Fenyo D, Phinney BS, Beavis RC. Determining the overall merit of protein identification data sets: rho-diagrams and rho-scores. J Proteome Res. 2007;6:1997–2004. doi: 10.1021/pr070025y. [DOI] [PubMed] [Google Scholar]
- 30.Perkins DN, Pappin DJ, Creasy DM, Cottrell JS. Probability-based protein identification by searching sequence databases using mass spectrometry data. Electrophoresis. 1999;20:3551–67. doi: 10.1002/(SICI)1522-2683(19991201)20:18<3551::AID-ELPS3551>3.0.CO;2-2. [DOI] [PubMed] [Google Scholar]
- 31.Zhang W, Chait BT. ProFound: an expert system for protein identification using mass spectrometric peptide mapping information. Anal Chem. 2000;72:2482–9. doi: 10.1021/ac991363o. [DOI] [PubMed] [Google Scholar]
- 32.Magnin J, Masselot A, Menzel C, Colinge J. OLAV-PMF: a novel scoring scheme for high-throughput peptide mass fingerprinting. J Proteome Res. 2004;3:55–60. doi: 10.1021/pr034055m. [DOI] [PubMed] [Google Scholar]