Abstract
Listeners with sensorineural hearing loss (SNHL) often show poorer thresholds for fundamental-frequency (F0) discrimination, and poorer discrimination between harmonic and frequency-shifted (inharmonic) complex tones, than normal-hearing (NH) listeners—especially when these tones contain resolved or partially resolved components. It has been suggested that these perceptual deficits reflect reduced access to temporal-fine-structure (TFS) information, and could be due to degraded phase-locking in the auditory nerve (AN) with SNHL. In the present study, TFS and temporal-envelope (ENV) cues in single AN-fiber responses to bandpass-filtered harmonic and inharmonic complex tones were measured in chinchillas with either normal hearing or noise-induced SNHL. The stimuli were comparable to those used in recent psychophysical studies of F0 and harmonic/inharmonic discrimination. As in those studies, the rank of the center component was manipulated to produce different resolvability conditions, different phase relationships (cosine and random phase) were tested, and background noise was present. Neural TFS and ENV cues were quantified using cross-correlation coefficients computed using shuffled cross-correlograms between neural responses to REF (harmonic) and TEST (F0- or frequency-shifted) stimuli. In animals with SNHL, AN-fiber tuning curves showed elevated thresholds, broadened tuning, best-frequency shifts, and downward shifts in the dominant TFS response component; however, no significant degradation in the ability of AN fibers to encode TFS or ENV cues was found. Consistent with optimal-observer analyses, the results indicate that TFS and ENV cues depended only on the relevant frequency shift in Hz and thus were not degraded because phase-locking remained intact. These results suggest that perceptual “TFS-processing” deficits do not simply reflect degraded phase-locking at the level of the AN. To the extent that performance in F0 and harmonic/inharmonic discrimination tasks depend on TFS cues, it is likely through a more complicated (sub-optimal) decoding mechanism, which may involve “spatiotemporal” (place-time) neural representations.
Keywords: auditory nerve, temporal fine structure, temporal envelope, noise-induced hearing loss
1 Introduction
In normal-hearing (NH) listeners, fundamental-frequency (F0) discrimination thresholds are usually lower (better) when low-rank harmonics are present than when only high-rank harmonics are available (e.g., Houtsma and Smurzynski 1990). Moreover, in hearing-impaired (HI) listeners, F0-discrimination thresholds for complex tones containing low-rank harmonics are often elevated compared to those measured using comparable stimuli in NH listeners (e.g., Moore et al. 2006). A traditional explanation for these findings is that accurate F0 discrimination requires having access to “resolved” harmonics, which in turn depends on cochlear frequency selectivity—which is often adversely affected by sensorineural hearing loss (SNHL). An alternative explanation is that accurate F0 discrimination depends on temporal fine structure (TFS) cues, specifically, intervals between TFS peaks under temporal-envelope (ENV) maxima, and that these cues are degraded by SNHL (e.g., Hopkins and Moore 2007). However, the effects of SNHL on the neural representation of TFS and ENV information at the level of the auditory nerve (AN) have not been thoroughly studied. In this study, we used a combination of computational modeling and neurophysiological recordings in NH and HI (noise-exposed) chinchillas in order to (1) assess the impact of SNHL on the neural representation of TFS and ENV cues for the discrimination of F0, or coherent frequency shifts, for complex tones similar to those used in recent psychophysical studies (Moore et al., 2009), as a function of the lowest harmonic number present in the stimulus; (2) predict the thresholds that could in theory be obtained by using either all of the information (including TFS, ENV, and place information) contained in AN-fiber responses, or solely place and average firing-rate information.
2 Methods
2.1 Experimental procedures
Single-fiber AN recordings were obtained in nine NH and six HI chinchillas using standard procedures (Kale and Heinz 2010). Noise-induced hearing loss was produced by presenting an octave-wide band of noise centered at 500 Hz continuously for 2 hours at ∼117 dB SPL. This acoustic over-exposure resulted in mild to moderate hearing loss over the CF range of 0.3-6 kHz, consistent with previous studies in chinchillas showing mixed hair-cell losses well beyond the octave-wide exposure band (Harding and Bohne 2007). The animals were allowed to recover for 4-6 weeks prior to the recordings. Except for the impaired-fiber CFs, which were determined manually (as in: Liberman, 1984), CF, threshold, and Q10 were determined using an automated algorithm. Spike times were measured with 10-μsec resolution. All procedures were approved by the Animal Care and Use Committee of Purdue University.
2.2 Stimuli
The stimuli were as similar as possible to those used in a recent psychophysical study of F0- and H-I discrimination (Moore et al. 2009). The “reference” (REF) stimulus was a harmonic complex tone. The “test” (TEST) stimulus was either another harmonic complex tone with a different F0 (as in the F0-discrimination task), or an inharmonic complex tone produced by shifting the frequencies of all components in the REF complex upwards by a constant amount in Hz (as in the H-I discrimination task). F0 shifts of 0.04, 0.1, and 0.5% were tested in most fibers; larger shifts were also tested in some fibers, whenever possible. Constant frequency shifts of 0.04, 0.1, or 0.5% of the F0 were tested. The complexes were bandpass filtered with a 5th-order Butterworth filter; the filter passband contained approximately five components. The center frequency of the REF complex matched the CF of the fiber. The rank of the lowest component contained within the 3-dB passband of the stimulus (hereafter referred to as the “harmonic rank”) was manipulated by varying the F0 of the stimulus. Four harmonic ranks (2, 4, 6, and 20) were tested. The component starting phases were either cosine or randomized. All stimuli were presented in background noise. The level of the noise was set 10 dB below the masked threshold defined as the noise level required to just mask the response to the supra-threshold tone complex.
2.3 Analysis metrics
Shuffled correlograms were used to quantify within-fiber TFS and ENV coding (e.g., Louage et al. 2004). Shuffled autocorrelograms (SACs) were computed by tallying inter-spike intervals (ISIs) across spike trains obtained in response to a single polarity of the stimulus. Shuffled cross-polarity correlograms (SCCs) were obtained by computing ISIs across spike trains obtained in response to positive and negative polarities of the stimulus. Stimulus polarity inversion inverts the fine structure while keeping the envelope unchanged. Therefore, differences between SAC and SCC (difcor) functions reflect TFS information, whereas averages of SAC and SCC (sumcor functions) represent ENV information. Neural cross-correlation coefficients for difcor and sumcor functions were used to quantify the degree of similarity (from 0 to 1) in neural responses to the TFS (ρTFS), or to the ENV (ρENV), of the REF and TEST stimuli (Heinz and Swaminathan 2009); ρTFS (or ρENV) values close to 1 indicate a high degree of similarity in neural responses to TFS (or ENV)—and therefore, poor discriminability—of the REF and TEST stimuli.
2.4 Optimal-observer model
To determine the just noticeable differences (JNDs) for F0 discrimination and H-I discrimination that could be achieved using the information contained in neural responses to the REF and TEST stimuli used in the present study, we used an approach similar to that used by Heinz et al. (2001). Simulated neural responses obtained using a physiologically realistic AN model (Zilany and Bruce 2006) were analyzed using an optimal-observer model (Siebert 1970). Two versions of the model were considered: rate-place (RP) and all-information (AI) (Heinz et al. 2001); the RP observer uses only spike-count information, whereas the AI observer uses the actual spike times (see Heinz et al. 2001 for details). Both models rest on the assumption that AN spiking is well described as a non-homogeneous Poisson process. Responses from 150 AN-model fibers, with CFs ranging from 150 to 2500 Hz, were simulated.
3 Results
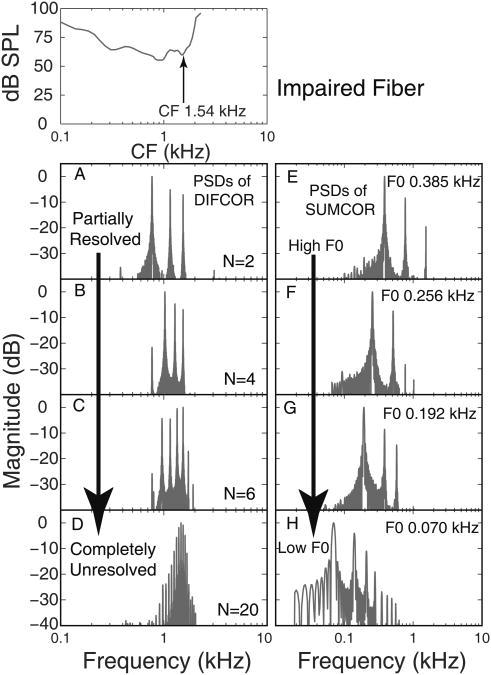
Figure 1 shows examples of power spectral densities of difcor and sumcor functions computed using the responses of a noise-exposed fiber (CF = 1.54 kHz) to REF (harmonic) stimuli, for different values of the harmonic rank (N). As N increased from 2 (partially resolved components) to 20 (completely unresolved components), the number of peaks in the difcor function increased (Fig. 1A-D), reflecting the increase in the number of TFS components falling in the passband of the fiber's tuning curve. Note that, for N = 2, the most dominant difcor (TFS) component corresponded to a frequency nearly 1 octave below the estimated CF of the fiber (Fig. 1A). In contrast, for N = 20, the frequency of the most dominant difcor peak corresponded to the estimated CF (compare Fig. 1A with 1D). The sumcor functions reflected F0-related periodicities and distortion components in the modulation spectrum (Fig. 1E-F). Qualitatively similar results were obtained across the entire population of impaired fibers. These results show that, even when the stimulus contains only unresolved harmonics, the temporal responses of AN fibers convey both TFS and ENV information, and this is the case even for impaired AN fibers.
Figure 1.
Following SNHL, the most dominant TFS response component was below the estimated cochlear CF (arrow in top left panel; Liberman 1984). A-D: Normalized power spectra of difcor functions. E-F: same for sumcor functions. Each row represents a rank and F0 condition.
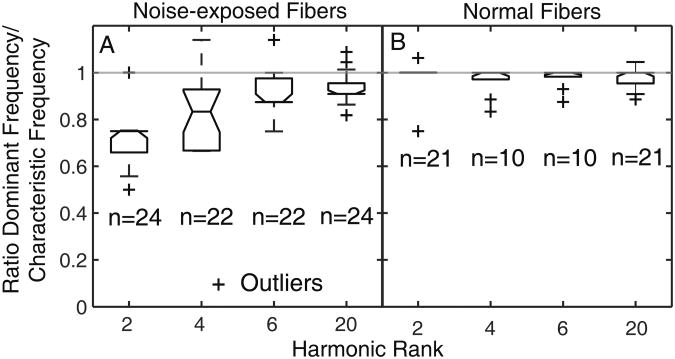
To quantify the mismatch between the frequency of the most dominant TFS component and the estimated cochlear CF, the ratio of these two quantities was computed for every fiber. For noise-exposed fibers, the ratio was lower than 1 on average for low harmonic ranks (N = 2 or 4), and it slowly approached 1 as N increased toward 20 (Fig. 2). These results provide further evidence that, following SNHL, there is a mismatch between the CF of a fiber and the frequency of the TFS component that is most strongly represented in the ISIs of this fiber; this mismatch is most marked for fibers responding to partially resolved components. In contrast, for normal fibers, the ratio was always around one, indicating a good match between cochlear CF and the most dominant TFS response component for all harmonic-rank conditions.
Figure 2.
Ratio of the most dominant TFS response component to cochlear CF for a population of normal and noise-exposed fibers. A: Noise-exposed fibers. B: Normal fibers. Number of fibers (n) that went into the computation of median and inter-quartile ranges is shown below each box-whisker plot. Outliers are indicated by “+”.
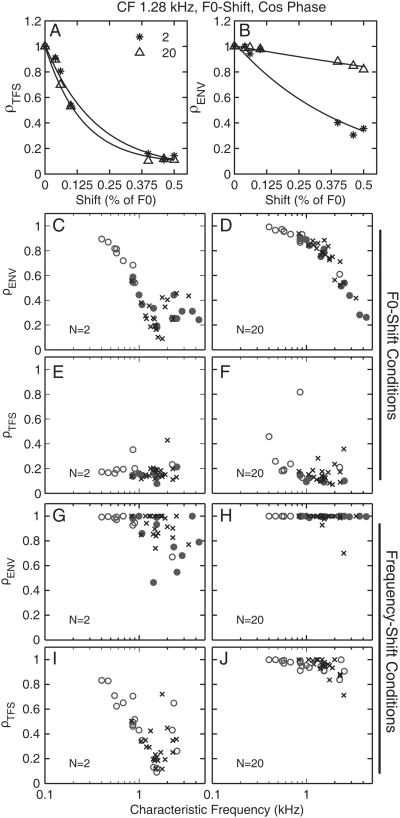
Figures 3A and 3B show the correlation coefficients, ρTFS and ρENV, as a function of the F0 difference (ΔF0) between REF and TEST stimuli. Although both coefficients decreased as ΔF0 increased, for ρENV, the decrease became less and less steep as N increased. The latter effect can be explained by considering that, for a given CF, the F0 was lower for N = 20 than for N = 2 and hence the ΔF0 in Hz was lower for N = 20 than for N = 2. Consistently across the population of normal and impaired fibers, ρENV corresponding to a frequency shift of 0.5% (of F0) was higher for N = 20 than for N = 2 (Fig. 3C and D). Further analysis of the data showed that a given ΔF in Hz produced equivalent changes in ρTFS and ρENV. These results suggest that, based on within-fiber spike-timing information, TFS and ENV cues for the discrimination of frequency shifts in Hz are equally strong. Figs. 3E and 3F show that, for both fiber populations, the ρTFS value corresponding to a ΔF0 of 0.5% was similar for N = 2 and N = 20.
Figure 3.
ρTFS (a) and ρENV (b) as a function of ΔF0 (in % of F0) are shown for a normal fiber. ρTFS and ρENV corresponding to ΔF0 of 0.5% are shown for the populations of normal (x) and impaired (o) fibers for F0-discrimination (A-D) and H-I discrimination (E-H). Filled circles are fibers with significantly broadened tuning.
For H-I discrimination, ρENV was saturated near 1 (Fig. 3G-H). The latter result is consistent with the fact that the temporal envelope of a sound is unaffected by a coherent frequency shift of all the components in the sound, and it demonstrates that this was also the case after cochlear filtering—at least for small frequency shifts, for the cosine phase condition, and for the stimuli and fibers considered here. Overall, the ρ metrics across the NH and HI fiber populations were quite similar, suggesting that the ability of AN fibers to encode F0 or frequency shifts in the timing of their discharges (phase locking to the TFS or the ENV) is not affected by SNHL.
Comparison with psychophysical data
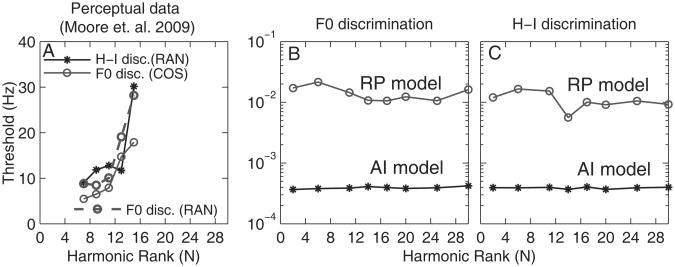
Figure 4A shows JNDs for F0 and JNDs for frequency shifts (H-I discrimination) measured in human listeners (Moore et al. 2009) using complex tones similar to those used in the current study, re-plotted here in terms of the frequency shift (in Hz) of the center component. Our decision to transform these thresholds into frequency shifts of the center component in Hz, rather than as percentages, was motivated by our finding that ρTFS and ρENV values were equal for equal changes in either the F0, or the TFS components near CF, in Hz. Using this metric, the thresholds measured in the two tasks (F0 and H-I discrimination) were comparable suggesting that performance in these two tasks may have been based on the same cue, the usability of which depends on the magnitude of the shift (in Hz) of the center component.
Figure 4.
A: F0 and H-I discrimination thresholds in humans (Moore et al. 2009), converted to frequency shifts of the center component in Hz. Thresholds are averaged across three F0 conditions (35, 50 and 100 Hz) and correspond to d' = 1. B: F0-discrimination thresholds predicted using the AI (asterisks) and RP (circles) models. C: Same as B but for F-discrimination.
Figures 4B and 4C show predicted JNDs (in Hz) corresponding to d' = 1 for F0 discrimination and H-I discrimination, respectively, based on AI or RP information only. The shift in the TFS component near CF was the stimulus parameter to be discriminated in both tasks. Note that the predicted thresholds do not depend on N. This result is inconsistent with the psychophysical results illustrated in Fig. 4A, but is consistent with our neural data showing that the decrease in ρTFS as a function of ΔF0 (or ΔF) did not depend on N (Fig. 3A).
4 Discussion
The results of this study indicate that the main effect of SNHL on TFS encoding at the level of single AN fibers is a mismatch between the fiber's cochlear CF (estimated based on the tuning curve) and the frequency of the most dominant TFS component in the neural response. No significant effect of SNHL on the ability of AN fibers to phase-lock to the TFS of complex tones was found. This suggests that poorer F0- and frequency-shift discrimination performance (or thresholds) in listeners with SNHL than in NH listeners are due to factors other than degraded phase locking to TFS at the level of AN. It is possible that these perceptual deficits originate beyond the AN, and/or are due to factors such as mismatches between TFS and place (tonotopic) information. Based on analyses of actual and simulated neural responses to harmonic and inharmonic complex tones, neither F0-discrimination performance nor frequency-shift detection performance (i.e., H-I discrimination) should be expected to degrade as the rank (N) of the lowest component in the stimulus increases. This stands in sharp contrast with psychophysical data, which show marked increases in F0- and F-discrimination thresholds as N increases (Moore et al. 2009). Therefore, it appears that performance in these perceptual tasks either does not depend on TFS cues, or does depend on TFS cues but via a complex and sub-optimal decoding mechanism that has yet to be identified, and that may involve a combination of place and temporal information.
Acknowledgments
Work supported by NIH R01-DC009838 (SK and MGH) and R01-DC05216 (CM). Some of the results presented in this chapter will be described in greater detail elsewhere (Kale et al. in prep).
Contributor Information
Sushrut Kale, Email: sk3646@columbia.edu.
Christophe Micheyl, Email: cmicheyl@umn.edu.
References
- Harding GW, Bohne BA. Distribution of focal lesions in the chinchilla organ of Corti following exposure to a 4-kHz or a 0.5-kHz octave band of noise. Hear Res. 2007;225:50–59. doi: 10.1016/j.heares.2006.12.012. [DOI] [PubMed] [Google Scholar]
- Heinz MG, Colburn HS, Carney LH. Evaluating auditory performance limits: I. one-parameter discrimination using a computational model for the auditory nerve. Neural Comput. 2001;13:2273–2316. doi: 10.1162/089976601750541804. [DOI] [PubMed] [Google Scholar]
- Heinz MG, Swaminathan J. Quantifying envelope and fine-structure coding in auditory-nerve responses to chimaeric speech. J Assoc Res Otolaryngol. 2009;10:407–423. doi: 10.1007/s10162-009-0169-8. [DOI] [PMC free article] [PubMed] [Google Scholar]
- Hopkins K, Moore BC. Moderate cochlear hearing loss leads to a reduced ability to use temporal fine structure information. J Acoust Soc Am. 2007;122:1055–1068. doi: 10.1121/1.2749457. [DOI] [PubMed] [Google Scholar]
- Houtsma AJM, Smurzynski J. Pitch Identification and Discrimination for Complex Tones with Many Harmonics. J Acoust Soc Am. 1990;87:304–310. [Google Scholar]
- Kale S, Heinz MG. Envelope coding in auditory nerve fibers following noise-induced hearing loss. J Assoc Res Otolaryngol. 2010;11:657–673. doi: 10.1007/s10162-010-0223-6. [DOI] [PMC free article] [PubMed] [Google Scholar]
- Kale S, Micheyl C, Heinz MG. Implications of within-fiber temporal coding for perceptual studies of F0-discrimination and discrimination of harmonic and inharmonic tone complexes. prep. doi: 10.1007/s10162-014-0451-2. [DOI] [PMC free article] [PubMed] [Google Scholar]
- Liberman MC. Single-neuron labeling and chronic cochlear pathology. I. Threshold shift and characteristic-frequency shift. Hear Res. 1984;16:33–41. doi: 10.1016/0378-5955(84)90023-6. [DOI] [PubMed] [Google Scholar]
- Louage DH, Van Der Heijden M, Joris PX. Temporal properties of responses to broadband noise in the auditory nerve. J Neurophysiol. 2004;91:2051–2065. doi: 10.1152/jn.00816.2003. [DOI] [PubMed] [Google Scholar]
- Moore BC, Glasberg BR, Hopkins K. Frequency discrimination of complex tones by hearing-impaired subjects: Evidence for loss of ability to use temporal fine structure. Hear Res. 2006;222:16–27. doi: 10.1016/j.heares.2006.08.007. [DOI] [PubMed] [Google Scholar]
- Moore BC, Hopkins K, Cuthbertson S. Discrimination of complex tones with unresolved components using temporal fine structure information. J Acoust Soc Am. 2009;125:3214–3222. doi: 10.1121/1.3106135. [DOI] [PubMed] [Google Scholar]
- Siebert WM. Frequency Discrimination in Auditory System - Place or Periodicity Mechanisms? Proc IEEE. 1970;58:723–750. [Google Scholar]
- Zilany MSA, Bruce IC. Modeling auditory-nerve responses for high sound pressure levels in the normal and impaired auditory periphery. J Acoust Soc Am. 2006;120:1446–1466. doi: 10.1121/1.2225512. [DOI] [PubMed] [Google Scholar]


